The article "2025 SDN Price Prediction: Expert Analysis and Market Outlook for the Coming Year" provides a comprehensive overview of Shiden Network's (SDN) market position, historical price trajectory, and future forecasts. It addresses investment strategies, risks, and market analysis, focusing on SDN's role within the Kusama ecosystem and its technological impact. The article is tailored for institutional and retail investors seeking insights into SDN's price dynamics from 2025 to 2030. Structured into sections covering historical analysis, price forecasts, investment strategies, and risk management, it facilitates quick reading and understanding for those interested in SDN's potential within the multi-chain sector.
Introduction: SDN's Market Position and Investment Value
Shiden Network (SDN) operates as a multi-chain decentralized application layer on the Kusama network, providing essential smart contract functionality to the Kusama ecosystem. Since its launch in 2021, SDN has established itself as a critical infrastructure component supporting various applications including DeFi and NFT. As of December 2025, SDN maintains a market capitalization of approximately $2.27 million USD with a circulating supply of around 68.1 million tokens, currently trading at $0.02592 per token.
This asset serves as a bridge for various blockchains while supporting Ethereum Virtual Machine, WebAssembly, and Layer 2 solutions—positioning it as an innovative platform within the multi-chain ecosystem.
This article will provide a comprehensive analysis of SDN's price trajectories from 2025 through 2030, integrating historical price patterns, market supply and demand dynamics, ecosystem development, and macroeconomic factors to deliver professional price forecasts and practical investment strategies for investors.
Shiden Network (SDN) Market Analysis Report
I. SDN Price History Review and Current Market Status
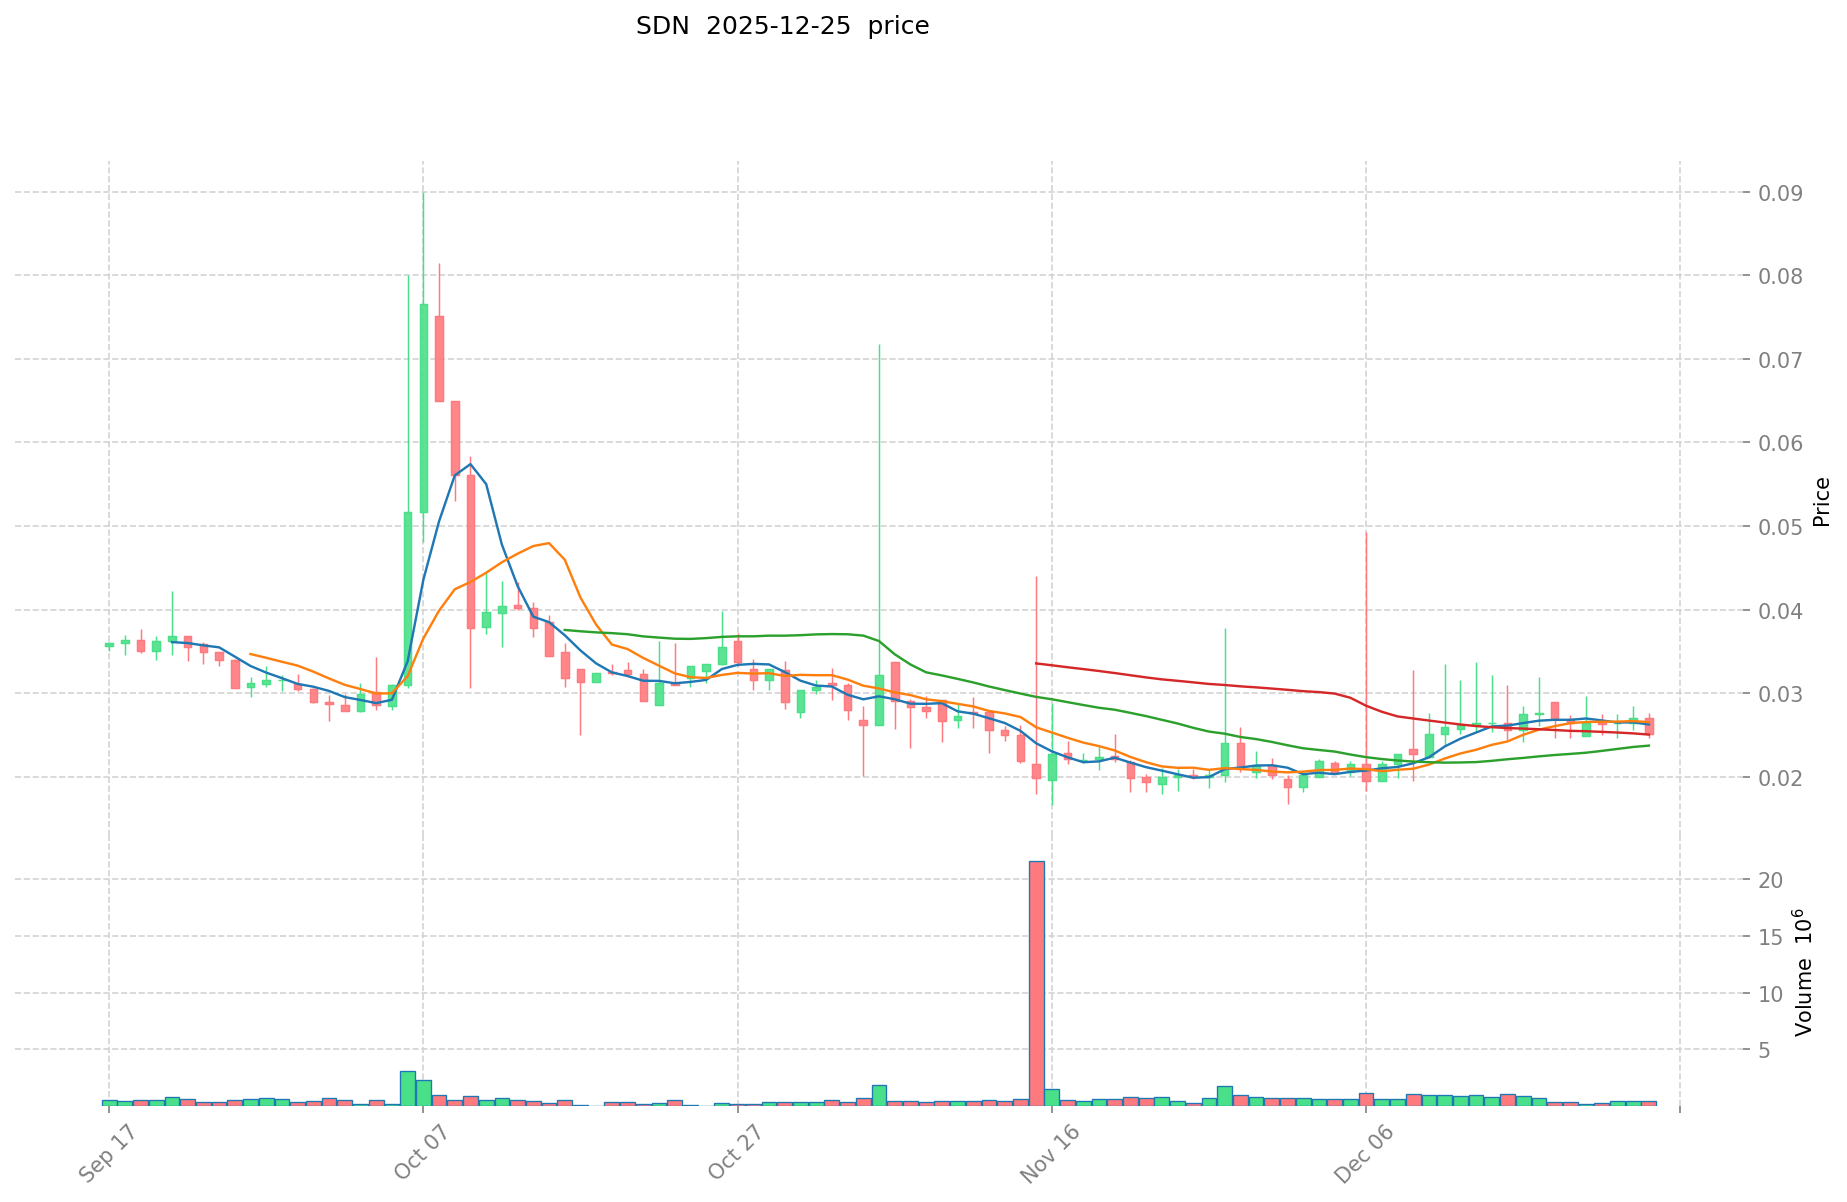
SDN Historical Price Trajectory
-
September 2021: SDN reached its all-time high of $8.36, marking the peak of its initial market enthusiasm following the project's launch on Kusama Network.
-
2021-2024 Period: The token experienced significant depreciation from its historical highs, reflecting broader market cycles in the crypto ecosystem and changing investor sentiment toward parachain projects on Kusama.
-
November 2025: SDN hit its all-time low of $0.01801155 on November 23, 2025, representing an 84.56% decline over the one-year period and highlighting the sustained downward pressure on the token's valuation.
SDN Current Market Status
As of December 25, 2025, Shiden Network's native token SDN is trading at $0.02592, reflecting a modest recovery with a 24-hour gain of 2.36%. The token shows mixed short-term performance with a 1-hour decline of 0.80%, while maintaining a 30-day positive return of 22.7% from the recent lows.
The token's market capitalization stands at $1,765,367.64, with a fully diluted valuation of $2,265,196.71. The 24-hour trading volume reaches $11,323.54, indicating modest liquidity. With 68,108,319.26 SDN in circulation out of a total supply of 87,391,848.43 tokens (83.53% circulation ratio), the circulating supply demonstrates a healthy release schedule. The project maintains 13,108 token holders and maintains a market dominance of 0.000071%.
The current market sentiment indicates extreme fear conditions, with a VIX reading of 23, suggesting heightened volatility and cautious investor positioning across the broader crypto market. The token's weekly performance shows a 9.99% decline over the past 7 days, indicating ongoing market pressure despite recent daily gains.
Click to view current SDN market price
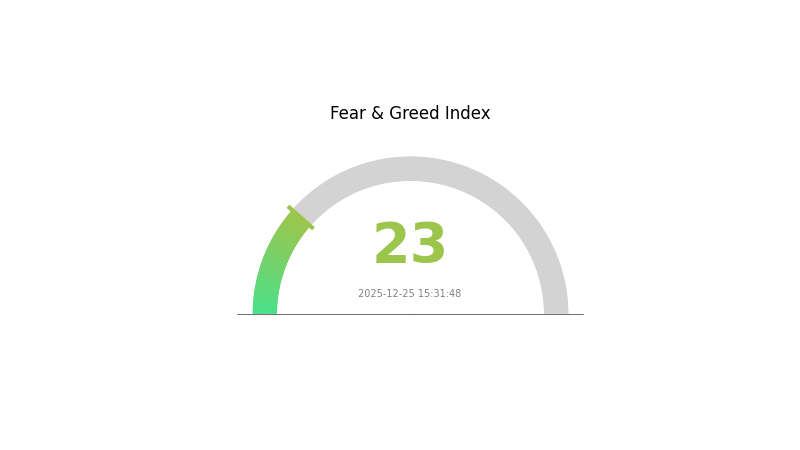
SDN Market Sentiment Indicator
2025-12-25 Fear and Greed Index: 23 (Extreme Fear)
Click to view the current Fear & Greed Index
The crypto market is currently experiencing extreme fear, with the Fear and Greed Index dropping to 23. This significant decline reflects heightened market uncertainty and risk aversion among investors. When the index reaches such extreme lows, it typically signals oversold conditions and potential buying opportunities for contrarian traders. However, investors should exercise caution and conduct thorough research before making investment decisions. Monitor market developments closely on Gate.com to stay informed about price movements and sentiment shifts during this volatile period.
SDN Holdings Distribution
The address holdings distribution represents a critical on-chain metric that maps the concentration of token ownership across wallet addresses. This distribution pattern serves as a fundamental indicator of market structure health, decentralization level, and potential systemic risks. By analyzing how SDN tokens are allocated among top holders, researchers can assess the degree of wealth concentration and evaluate the network's vulnerability to price manipulation or coordinated selling pressure.
The data provided reveals the current state of SDN's holder concentration. However, without specific quantitative figures in the dataset, a comprehensive assessment of excessive concentration cannot be fully determined. Generally, a healthy token ecosystem exhibits a relatively distributed holder base where no single address commands an overwhelming proportion of total supply. Should top addresses collectively represent a significant percentage of circulating tokens, this would indicate elevated concentration risk and potential governance concerns. The presence of major holders creates scenarios where coordinated actions—such as large liquidations or accumulation phases—could materially impact market dynamics and price stability.
The structural implications of current address distribution patterns directly influence SDN's market microstructure. High concentration levels may amplify volatility, as significant holders possess the capacity to move markets through large transactions. Conversely, a more distributed holder base typically correlates with improved price discovery mechanisms and reduced manipulation susceptibility. The stability of this distribution over time also reflects the token's underlying adoption trajectory and community engagement strength.
Visit SDN Holdings Distribution on Gate.com for real-time data

| Top |
Address |
Holding Qty |
Holding (%) |
Core Factors Affecting SDN's Future Price
Institutional and Major Holder Dynamics
-
Enterprise Adoption: Major enterprises in the SDN and Network Function Virtualization (NFV) sector include Huawei, IBM, NEC, Intel, Pica8, Cisco Systems, Juniper, Pluribus Networks, Hewlett Packard, Ciena, and Big Switch Networks. These companies play significant roles in the SDN market development.
-
Market Expansion: According to market research, the global SDN and NFV market is projected to experience sustained growth through 2030, with the market expanding across telecommunications, information technology, government and public utilities, banking, and healthcare sectors.
Macroeconomic Environment
-
Market Growth Trajectory: The SDN industry is experiencing continuous market expansion as enterprises increasingly adopt digital transformation strategies. The market is driven by growing demand for network virtualization and software-defined solutions across multiple industries and regions, including Asia, North America, and Europe.
-
Digital Transformation Impact: Enterprise adoption of SDN technology is closely tied to broader digital transformation initiatives. Approximately 90% of enterprises are currently undertaking digital transformation plans, which directly increases demand for flexible, automated, and intelligent network infrastructure solutions that SDN provides.
Technology Development and Ecosystem Building
-
Core Technology: The OpenFlow protocol represents the fundamental technology underlying SDN, enabling the separation of network device control planes from data planes. This architecture provides flexible traffic control and creates an intelligent network pipeline, offering a solid foundation for network and application innovation.
-
Network Modernization: SDN technology, combined with cloud computing and NFV, facilitates software-defined and cloud-based network transformation. This enables networks to become more agile, open, and automated, serving as an efficient enabler platform for business operations and innovation.
-
Ecosystem Applications: SDN technology applications span data center network optimization, wide-area network modernization through SD-WAN, and access edge infrastructure enhancement. The technology addresses key digital transformation requirements including IoT device connectivity, cloud application deployment, and unified security management across wired and wireless networks.
III. 2025-2030 SDN Price Forecast
2025 Outlook
- Conservative Forecast: $0.02058 - $0.02573
- Base Case Forecast: $0.02573
- Optimistic Forecast: $0.02727 (requiring sustained market sentiment and positive ecosystem developments)
2026-2028 Mid-term Outlook
- Market Stage Expectation: Gradual recovery and consolidation phase with incremental growth trajectory
- Price Range Forecast:
- 2026: $0.01431 - $0.0371
- 2027: $0.01813 - $0.04102
- 2028: $0.0193 - $0.05061
- Key Catalysts: Enhanced protocol functionality, increased institutional adoption, expanding use cases within the ecosystem, and overall market sentiment improvement
2029-2030 Long-term Outlook
- Base Case Scenario: $0.02785 - $0.05352 (assuming steady ecosystem growth and moderate market expansion)
- Optimistic Scenario: $0.04351 - $0.06162 (contingent on accelerated DeFi adoption and broader market recovery)
- Transformative Scenario: $0.05352 - $0.06162 (requiring breakthrough technological advancement and significant mainstream adoption)
- 2030-12-25: SDN trading at $0.06162 (reflecting 87% potential cumulative appreciation from current levels)
| 年份 |
预测最高价 |
预测平均价格 |
预测最低价 |
涨跌幅 |
| 2025 |
0.02727 |
0.02573 |
0.02058 |
0 |
| 2026 |
0.0371 |
0.0265 |
0.01431 |
2 |
| 2027 |
0.04102 |
0.0318 |
0.01813 |
22 |
| 2028 |
0.05061 |
0.03641 |
0.0193 |
40 |
| 2029 |
0.05352 |
0.04351 |
0.02785 |
67 |
| 2030 |
0.06162 |
0.04852 |
0.02474 |
87 |
Shiden Network (SDN) Professional Investment Strategy and Risk Management Report
IV. SDN Professional Investment Strategy and Risk Management
SDN Investment Methodology
(1) Long-term Holding Strategy
- Target Investors: Institutional investors and long-term retail holders with medium-to-high risk tolerance seeking exposure to Kusama ecosystem infrastructure
- Operation Recommendations:
- Accumulate SDN during market downturns, leveraging the 24-hour positive momentum of +2.36% as potential entry confirmation signals
- Hold through multiple market cycles to benefit from ecosystem development, particularly as Shiden Network's multi-chain DeFi and NFT applications mature
- Dollar-cost averaging (DCA) strategy to mitigate volatility given the -84.56% one-year decline
(2) Active Trading Strategy
- Technical Analysis Tools:
- Support and Resistance Levels: Utilize the all-time high of $8.36 (recorded September 12, 2021) and recent all-time low of $0.01801155 (November 23, 2025) to establish trading boundaries
- Volume Analysis: Monitor the 24-hour trading volume of $11,323.54 USD to identify breakout opportunities and liquidity conditions
- Wave Operation Key Points:
- Execute short-term trades during the +22.7% monthly gains to capture intermediate trend reversals
- Set stop-loss orders at -2% below entry points given the -9.99% seven-day decline, indicating recent downward pressure
- Capitalize on the 83.53% circulating supply-to-total supply ratio, which suggests limited additional dilution risk in the near term
SDN Risk Management Framework
(1) Asset Allocation Principles
- Conservative Investors: 1-2% of total portfolio allocation
- Aggressive Investors: 3-5% of total portfolio allocation
- Professional Investors: 5-10% of total portfolio allocation with active hedging strategies
(2) Risk Hedging Solutions
- Position Sizing Discipline: Maintain maximum position sizes aligned with your risk tolerance, reducing SDN exposure during periods of heightened volatility or when technical indicators show bearish divergence
- Profit-Taking Strategy: Gradually liquidate positions during 20%+ price rallies to lock in gains, given the asset's history of significant drawdowns
(3) Secure Storage Solutions
- Hardware wallet Approach: Store SDN holdings on secure self-custody solutions with proper backup and recovery phrase management
- Exchange Account Security: For active trading SDN on Gate.com, enable all available security features including two-factor authentication (2FA), withdrawal whitelist, and IP address restrictions
- Security Considerations: Never share private keys, recovery phrases, or sensitive account information; use only official project websites and verified exchange platforms when transacting
V. SDN Potential Risks and Challenges
SDN Market Risks
- Extreme Price Volatility: SDN has declined 84.56% over one year, indicating significant price instability that can result in substantial losses for long-term holders
- Liquidity Risk: With only 2 exchange listings and a daily trading volume of $11,323.54 USD, SDN exhibits limited liquidity that may create slippage during large trades and difficulty executing exit positions during market stress
- Market Capitalization Erosion: The token's market cap of $1.77 million represents diminished investor confidence compared to larger ecosystem projects, potentially limiting future fund inflows
SDN Regulatory Risks
- Kusama Network Dependency: SDN's regulatory status is directly tied to regulatory outcomes for Kusama Network; adverse regulations targeting Kusama could negatively impact SDN's viability
- Jurisdiction-Specific Restrictions: Certain jurisdictions may impose restrictions on tokens operating on specific blockchain networks, affecting trading availability and adoption rates
- Compliance Uncertainty: The evolving regulatory landscape for Layer 2 solutions and smart contract platforms introduces ongoing uncertainty regarding SDN's long-term compliance requirements
SDN Technical Risks
- Ecosystem Adoption Risk: SDN's utility depends on widespread adoption of DeFi and NFT applications on Shiden Network; limited development activity could restrict token value growth
- Cross-Chain Integration Complexity: Supporting Ethereum Virtual Machine, WebAssembly, and Layer 2 solutions creates technical implementation risks that could affect network stability or security
- Network Upgrades and Forks: Planned or emergency network upgrades may introduce technical vulnerabilities or unexpected consequences for token holders
VI. Conclusion and Action Recommendations
SDN Investment Value Assessment
Shiden Network (SDN) operates as a critical infrastructure layer within the Kusama ecosystem, providing essential smart contract functionality for a network lacking native EVM support. However, the token faces significant headwinds, including an 84.56% annual decline, minimal market capitalization, limited exchange access, and concentrated liquidity. While the underlying technology addresses genuine market needs through support for EVM, WebAssembly, and Layer 2 solutions, the weak price action and thin trading volume suggest limited institutional adoption and modest retail interest. For most investors, SDN represents a high-risk, speculative allocation appropriate only within diversified crypto portfolios with clearly defined risk parameters.
SDN Investment Recommendations
✅ Beginners: Approach SDN with extreme caution; allocate only 0.5-1% of crypto holdings if pursuing Kusama ecosystem exposure, emphasizing long-term hold strategy over active trading given volatility and illiquidity
✅ Experienced Investors: Consider SDN as a tactical position within a broader Kusama ecosystem allocation; employ technical analysis to trade 20-30% daily volume movements during identified support/resistance zones; maintain strict position sizing discipline
✅ Institutional Investors: Evaluate SDN for minimal strategic allocation (1-3%) only after comprehensive due diligence on Shiden Network development roadmap and ecosystem adoption metrics; coordinate position building through established trading channels to minimize market impact
SDN Trading Participation Methods
- Direct Token Purchase: Acquire SDN through Gate.com using BTC, ETH, USDT, or other major trading pairs with proper verification and two-factor authentication enabled
- Limit Order Strategy: Place limit buy orders below current market price ($0.02592) during identified technical support levels to improve entry pricing and reduce slippage
- Dollar-Cost Averaging: Execute scheduled purchases over multiple weeks or months to accumulate SDN exposure while averaging entry prices across varying market conditions
Cryptocurrency investments carry extreme risk. This report does not constitute investment advice. All investors must conduct independent research, assess personal risk tolerance, and consult qualified financial advisors before making investment decisions. Never invest capital you cannot afford to lose completely.
FAQ
What is the maximum supply of Shiden crypto?
The maximum supply of Shiden crypto is 81.54 million coins. The current circulating supply stands at 68.10 million coins, representing approximately 83.5% of the total maximum supply.
What is Shiden Network (SDN) and what is its use case?
Shiden Network (SDN) is a decentralized application layer built on Kusama, designed to enable multi-chain applications. It provides a scalable and interoperable platform for decentralized applications, facilitating cross-chain functionality and innovation.
What factors influence SDN price movements?
SDN price movements are driven by market demand, trading volume, network adoption rates, cryptocurrency market sentiment, Bitcoin correlation, technological developments, and macroeconomic factors affecting the broader digital asset ecosystem.
What is the current market cap and trading volume of SDN?
The current market cap of SDN is $1.76 million, and the 24-hour trading volume is $16,976.
Is SDN a good investment for 2025?
SDN shows neutral investment potential in 2025 based on technical analysis. With growing ecosystem development and increasing adoption, it could offer moderate upside opportunities for long-term investors seeking exposure to the platform's expansion.
* The information is not intended to be and does not constitute financial advice or any other recommendation of any sort offered or endorsed by Gate.