Master the hammer candlestick pattern in cryptocurrency trading. Learn to identify reversal signals in Bitcoin and Ethereum with proven strategies for beginner and intermediate traders. Complete technical analysis guide.
The cryptocurrency market presents unique challenges for investors and traders due to its high volatility and decentralized nature. To successfully navigate this dynamic environment, market participants must master various technical analysis tools. Among these, Japanese candlestick charts have established themselves as one of the most effective and widely used methods for interpreting price behavior.
Candlestick charts are not only applicable to cryptocurrency trading but are also fundamental in stock, forex, and other financial markets. Their versatility lies in their ability to condense complex information about price action into an easy-to-interpret visual format. When used correctly, these patterns can reveal important signals about potential trend reversals, support and resistance levels, and the balance between buyers and sellers in the market.
One of the most recognized and frequently used candlestick patterns by experienced traders is the hammer pattern. This specific pattern has proven to be a valuable tool for identifying potential trend reversals across various timeframes and markets.
What Is the Hammer Candlestick Pattern?
The hammer candlestick pattern is a technical formation that can be applied across most financial markets, including cryptocurrencies, stocks, commodities, and forex. This pattern is especially appreciated by traders for its ability to signal possible bullish reversals in the market.
Essentially, the hammer represents a bullish signal indicating a possible change in price direction. When this pattern appears after a downtrend, it suggests that selling pressure is waning and buyers are starting to take control of the market. This shift in power dynamics between sellers and buyers is what makes the hammer pattern so valuable for traders.
It is important to note that, although the hammer is a powerful signal, it should not be used in isolation. Experienced traders combine this pattern with other methods and technical indicators to confirm the signal. For example, they may verify the formation of the hammer using momentum indicators, trading volume, or previously identified support and resistance levels. This multi-dimensional approach significantly increases the reliability of trading signals and reduces the risk of acting on false signals.
The effectiveness of the hammer pattern lies in its ability to capture a crucial moment in market psychology: the point at which sellers are exhausted and buyers begin to enter with conviction.
What Does the Hammer Pattern Look Like?
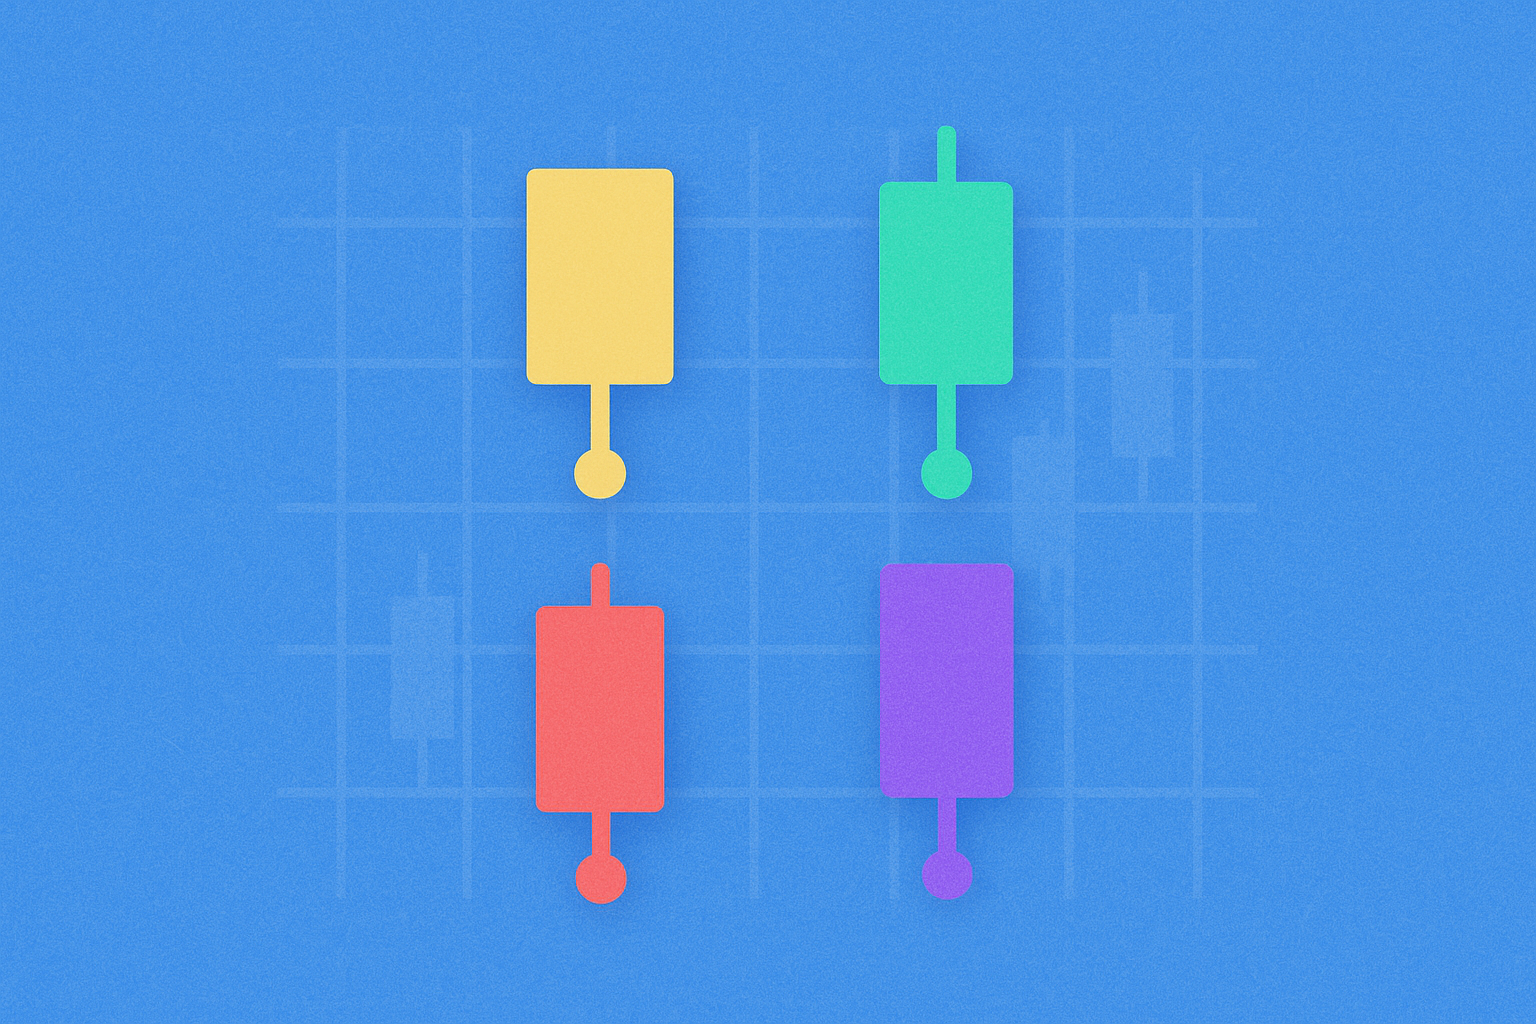
The hammer pattern is relatively easy to identify on a candlestick chart once you know its distinctive features. It consists of a single candle with two main visual elements: a small body and a long lower wick.
The body of the candle represents the difference between the opening and closing prices. In a typical hammer, this body is compact and positioned at the top of the formation. The most distinctive feature is the long lower wick (also known as the shadow), which extends significantly below the candle's body. This long wick indicates that during the candle's formation period, the price fell substantially but then recovered before closing.
The strength and reliability of the hammer pattern depend largely on the proportion between the length of the wick and the size of the body. A strong and reliable hammer pattern shows a wick that is at least twice as long as the body. Generally, the larger the ratio between the wick and the body, the stronger the bullish reversal signal.
In addition to the wick-body ratio, other important visual factors include:
- The position of the body: should be at the top of the formation
- The upper wick: should be minimal or nonexistent
- The trend context: the hammer is more significant when appearing after a prolonged downtrend
- Trading volume: high volume during the formation of the hammer strengthens the signal
These combined visual elements provide traders with a powerful tool to identify potential entry points in the market.
Traditional Hammer Candle
The traditional hammer is the quintessential bullish pattern within this family of formations. It is characterized by having a close price above the open, resulting in a candle body typically green or white, depending on the chart configuration.
This pattern's formation tells a specific story about market dynamics during that period. At the start of the session, sellers exert significant pressure, pushing the price sharply downward. This is reflected in the long lower wick. However, as the session progresses, buyers enter the market with enough force to not only halt the decline but also push the price back up, closing above the open price.
This dynamic suggests several important aspects of market sentiment:
- Sellers have exhausted their strength and could not keep the price at low levels
- Buyers are willing to step in even after an initial drop, showing conviction
- There is a significant support level at the area where the lower wick formed
- The market momentum is beginning to shift from bearish to bullish
In cryptocurrency trading, the traditional hammer can signal the end of a price correction or the beginning of a new bullish trend. Traders often look for this pattern near key technical support levels or after fundamental events that may have caused a temporary oversold condition of the asset.
Inverted Hammer Candle
The inverted hammer is another bullish variant of the hammer pattern, although it presents different visual features. In this case, the formation shows the open price below the close price, similar to the traditional hammer. However, the key difference lies in the position of the long wick: instead of extending downward, the wick projects upward, above the candle body.
This setup reflects a different but equally significant market narrative. During the formation of this candle, buyers attempted aggressively to push the price higher, creating the long upper wick. However, they encountered resistance, and the price was pushed back down before closing. Despite this retracement, the price managed to close above the open, indicating that buyers maintained some control.
Although the inverted hammer is not as strong as the traditional hammer from a bullish perspective, it remains an important signal indicating:
- Significant buying pressure attempting to push the price higher
- Buyers are willing to pay higher prices, albeit temporarily
- The resistance encountered at higher levels could be overcome with sufficient momentum
- The market's power balance is beginning to favor buyers
In cryptocurrency trading, the inverted hammer often appears at consolidation points or at the end of downtrends. Experienced traders wait for additional confirmation in subsequent candles before taking long positions based on this pattern. A typical confirmation would be a bullish candle closing above the inverted hammer's high.
Hanging Man Candlestick
The Hanging Man pattern indicates a significant shift in market sentiment, serving as a bearish signal unlike the previous hammer patterns. Visually, this pattern closely resembles a traditional hammer, but its context and meaning are entirely different.
The Hanging Man candle forms when the open price is above the close price, resulting in a candle body typically red or black. Similar to the traditional hammer, it features a long lower wick indicating that during the session, the price experienced a significant decline. However, the crucial difference is that the price did not recover enough to close above the open.
This formation is particularly significant when it appears after an uptrend, suggesting:
- Sellers are beginning to exert pressure on the market
- Buyers who previously dominated are losing control
- There is a possible distribution of long positions
- Bullish momentum is weakening
The market narrative reflected by the Hanging Man is concerning for bullish traders: although buyers attempted to defend the price during the session (as shown by the recovery from the low), they lacked enough strength to close positive. This indicates that sellers maintain control and a bearish reversal could be developing.
In cryptocurrency markets, the Hanging Man can appear after significant rallies or near important resistance levels. Prudent traders consider this pattern as a warning to protect gains or consider short positions, especially if confirmed by high volume or additional bearish signals on subsequent candles.
Shooting Star Candle
The Shooting Star is the fourth key pattern within the hammer-type formations, representing a clear bearish signal. Visually, this pattern resembles an inverted hammer, but its context and meaning are opposite, indicating a potential bearish reversal instead of bullish.
The Shooting Star is characterized by a long upper wick and a small body located at the lower part of the formation. Most importantly, the price closes below its open price, creating a bearish body. This setup tells a specific story about the market's rejection of higher prices.
During the formation of a Shooting Star, the price attempts to break higher forcefully, reaching significantly above the open. This creates the long upper wick. However, this bullish breakout is rejected, and the price is pushed back down, closing even below the open. This dynamic suggests several critical aspects:
- Buyers attempted to push the price higher but faced significant resistance
- Sellers aggressively entered at higher levels, rejecting the breakout
- Active distribution of positions at higher levels exists
- The market sentiment is shifting from bullish to bearish
- An imminent bearish reversal is likely
The Shooting Star is especially powerful when it appears after an extended rally or near key technical resistance levels. In the cryptocurrency market, this pattern can signal the exhaustion of a rally and the start of a correction or more significant downtrend.
Experienced traders seek additional confirmation before acting on a Shooting Star, such as:
- High volume during pattern formation
- A confirming bearish candle in the following session
- Break of nearby support levels
- Bearish signals in other technical indicators
This cautious approach helps filter false signals and increases the likelihood of successful trades based on this pattern.
How to Trade with the Hammer Pattern?
Successfully trading the hammer pattern requires more than just identifying the formation on a chart. Experienced traders follow a systematic process that combines pattern recognition with additional analysis and prudent risk management.
Step 1: Identification and Context
The first step is to correctly identify the hammer pattern and assess its context within the overall market trend. A bullish hammer is more meaningful when appearing after a prolonged downtrend or near important support levels. Similarly, bearish patterns like the Hanging Man or Shooting Star are more relevant after uptrends.
Step 2: Confirmation with Technical Indicators
You should never rely solely on the appearance of the hammer pattern. It is essential to seek confirmation using other technical indicators:
- Moving Averages: Check if the price is bouncing off a significant moving average (50, 100, or 200 periods)
- RSI (Relative Strength Index): Look for oversold conditions (RSI < 30) for bullish hammers or overbought (RSI > 70) for bearish patterns
- Volume: High volume during the formation of the hammer significantly reinforces the signal
- MACD: Look for divergences or crossovers confirming momentum change
- Support/Resistance levels: The pattern is more reliable when forming near key technical levels
Step 3: Fundamental Analysis
Fundamental analysis can provide valuable context for why the hammer pattern formed. Investigate whether there were:
- Major announcements about the cryptocurrency project
- Regulatory changes affecting the market
- Relevant macroeconomic events
- News that could have triggered significant buying or selling
Step 4: Wait for Confirmation
A prudent practice is to wait for the next candle to confirm the hammer signal. For a bullish hammer, look for a candle closing above the hammer's high. For bearish patterns, wait for a candle closing below the pattern's low.
Step 5: Risk Management
Always set appropriate stop-loss levels:
- For bullish hammers: place stop-loss just below the lower shadow
- For bearish patterns: place stop-loss above the pattern's high
- Set realistic profit targets based on identifiable technical levels
- Consider risk/reward ratio, ideally 1:2 or better
Following this systematic approach helps traders maximize the effectiveness of the hammer pattern while minimizing false signals and losses.
Advantages of the Hammer Candlestick Pattern
The hammer candlestick pattern offers numerous advantages that make it a favorite tool among traders of all experience levels:
Versatility Across Markets
A primary strength of the hammer pattern is its universal applicability. This pattern reliably indicates price trends not only in the cryptocurrency market but also in stocks, forex, commodities, and other financial markets. This versatility allows traders to develop transferable skills applicable across different asset classes.
Compatibility with Other Tools
The hammer pattern integrates exceptionally well with other technical analysis tools and price action strategies. It can be effectively combined with momentum indicators, Bollinger Bands, Fibonacci levels, and additional candlestick patterns to create robust, multi-dimensional trading strategies.
Application Flexibility
Market participants can use the hammer pattern in multiple ways:
- As a trend reversal signal at the end of bearish or bullish moves
- As a continuation pattern during consolidations within established trends
- Across various timeframes, from minutes to weekly or monthly charts
- To identify both buying and selling opportunities, depending on the type of hammer
Ease of Identification
Unlike some complex technical patterns requiring significant experience to identify correctly, hammer candles are relatively easy to recognize even for beginner traders. Their distinctive visual features (small body and long wick) make them stand out clearly on candlestick charts.
Market Psychology Insights
Beyond being just a technical signal, the hammer pattern provides valuable insight into market psychology and the balance between buyers and sellers. This deep understanding helps traders make better-informed decisions about the probable direction of the price.
Limitations of the Hammer Candlestick Pattern
Despite its numerous advantages, it is crucial to recognize the limitations of the hammer pattern to use it effectively and avoid unnecessary losses:
False Signals
The most significant limitation of the hammer pattern is that it is not 100% reliable and can generate false signals. In highly volatile markets like cryptocurrencies, the price may continue downward even after a seemingly strong bullish hammer appears. This can happen for various reasons:
- Unexpected fundamental events that change market sentiment
- Market manipulation by large participants
- Lack of sufficient volume to support the reversal
- The pattern formed on a lower timeframe without confirmation on higher timeframes
Context Dependence
Traders cannot rely solely on this indicator for trading decisions. The hammer pattern must always be evaluated within the broader market context. A hammer that appears in isolation, without confirmation from other indicators or a clear trend context, has a significantly lower probability of success.
Requires Confirmation
The need to wait for confirmation can lead to:
- Loss of part of the potential price movement
- Uncertainty about how much confirmation is enough
- Confusion when confirmation signals are contradictory
Subjectivity in Interpretation
Although the basic pattern is easy to identify, there can be subjectivity in determining:
- If the wick-to-body ratio is sufficiently strong
- If the trend context is appropriate
- When the pattern is "complete" and ready for action
Limitations in Highly Volatile Markets
In the cryptocurrency market, extreme volatility can produce numerous hammer patterns over short periods, leading to:
- Signal fatigue and confusion
- Higher frequency of false signals
- Difficulty distinguishing between significant patterns and market noise
Inherent Delay
Like all candlestick patterns, the hammer is an inherently lagging indicator. It can only be identified after the candle has formed, meaning part of the price movement has already occurred by the time a trader can act.
Recognizing these limitations does not diminish the value of the hammer pattern but helps traders use it more effectively within a well-balanced trading strategy.
Why You Should Remember the Hammer Candlestick Pattern
The hammer candlestick pattern deserves a prominent place in the toolkit of any serious trader, whether in the cryptocurrency market or other financial markets. Although it has advantages and disadvantages like any technical analysis tool, its practical value and applicability make it essential knowledge.
Balance of Utility and Caution
The most significant drawback of the hammer pattern is its potential to generate false signals. The appearance of a hammer candle suggests a trend reversal is imminent, but external factors, unexpected market events, or simply natural volatility can interrupt this anticipated reversal. This reality underscores the importance of never trading based solely on a single indicator.
Accessibility and Frequency
One of the greatest strengths of the hammer pattern is its accessibility. Hammer candles are relatively easy to detect even for traders with limited experience and appear frequently across various timeframes, providing regular trading opportunities. This combination of easy identification and frequent occurrence makes the pattern particularly valuable for traders seeking consistent actionable signals.
The Importance of Confirmation
Above all, remember that confirmation is essential. Never act impulsively upon seeing a hammer pattern. Instead, develop the habit of:
- Verifying the signal with multiple technical indicators
- Assessing the fundamental market context
- Waiting for confirmation in subsequent price action
- Considering the timeframe and overall trend
- Implementing appropriate risk management with stop-loss orders
Navigating Cryptocurrency Market Volatility
The cryptocurrency market presents unique challenges due to its extreme volatility. This volatility can create both exceptional opportunities and significant risks. When used correctly within an integrated strategy, the hammer pattern can help traders:
- Identify potential entry and exit points
- Better understand market sentiment
- Make more informed decisions based on price action
- Manage risk more effectively
Developing Trading Skills
Learning to identify and trade with hammer patterns is more than simply memorizing a candlestick formation. It is part of developing a deeper understanding of:
- Market psychology and participant behavior
- The dynamics between buyers and sellers
- How to interpret technical signals within broader contexts
- The importance of patience and discipline in trading
Practical Conclusion
The hammer candlestick pattern is a valuable tool that, when used prudently and combined with other analysis methods, can significantly improve your trading results. Market participants should always stay alert and cautious, especially in the volatile cryptocurrency market. Success in trading does not come from finding the perfect tool but from using multiple tools in a disciplined and systematic manner.
Remember that successful trading is a marathon, not a sprint. The hammer pattern is an important piece of the puzzle, but only one piece. Develop a comprehensive strategy that incorporates technical analysis, fundamental analysis, risk management, and emotional discipline. With this holistic approach, the hammer candlestick pattern can become a reliable ally on your trading journey.
FAQ
What is the exact definition of a hammer candle, and what are its main characteristics?
A hammer candle is a reversal pattern with a small body and a long lower wick. Its main features are: a compact body at the top, a lower wick at least twice the body, little to no upper wick, and a bullish indication of a trend reversal.
How to correctly identify a hammer candle on a price chart?
A hammer has a small body at the top and a long lower wick, with no significant upper wick. It indicates rejection of lower prices and a possible bullish reversal. It forms when the price falls but closes near the open, showing buying strength.
What is the most effective trading strategy when detecting a hammer?
The most effective approach is to wait for confirmation on the next candle, verify key support and high trading volume. Buy when the price bounces from support, setting a stop loss just below the hammer’s lower shadow to manage risk.
What is the difference between a bullish and bearish hammer candle?
The bullish hammer appears in downtrends and suggests an upward reversal, closing near the high. The bearish hammer forms in uptrends, indicating a potential reversal downward, closing near the low. The main difference is their context and expected direction.
What is the accuracy or reliability rate of the hammer candle as a buy/sell signal?
The hammer has an approximate reliability of 60–70% when used correctly. Its effectiveness depends on market context, prior trend, and confirmation with other technical indicators. In downtrends, its bullish signal is more reliable than in sideways markets.
* The information is not intended to be and does not constitute financial advice or any other recommendation of any sort offered or endorsed by Gate.