NAI vs OP: The Battle for AI Dominance in Content Creation

2025-10-29 02:13:33
AI
Altcoins
Crypto Insights
DeFi
Layer 2
Article Rating : 4
0 ratings
This article delves into the investment landscape between Nuklai (NAI) and Optimism (OP), two significant players in AI and Ethereum scaling, respectively. It offers a comprehensive analysis of price trends, technological advancements, and investment strategies. Readers will gain insights into factors affecting each asset's value, such as supply mechanisms and institutional adoption. The article targets investors considering diversification in cryptocurrencies, highlighting associated risks. With an emphasis on NAI's AI potential and OP's DeFi integration, it provides a strategic guide for both new and experienced investors.
NAI vs OP: The Battle for AI Dominance in Content Creation

Introduction: NAI vs OP Investment Comparison

In the cryptocurrency market, the comparison between Nuklai (NAI) vs Optimism (OP) has been an unavoidable topic for investors. The two not only show significant differences in market cap ranking, application scenarios, and price performance, but also represent different positioning in the crypto asset landscape.

Nuklai (NAI): Since its launch, it has gained market recognition for its role as a Layer 1 infrastructure provider for data ecosystems empowering next-generation AI.

Optimism (OP): Introduced in 2022, it has been hailed as a low-cost, lightning-fast Ethereum Layer 2 blockchain solution, addressing the practical needs of developers and users.

This article will provide a comprehensive analysis of the investment value comparison between NAI and OP, focusing on historical price trends, supply mechanisms, institutional adoption, technological ecosystems, and future predictions, attempting to answer the question investors are most concerned about:

"Which is the better buy right now?"

I. Price History Comparison and Current Market Status

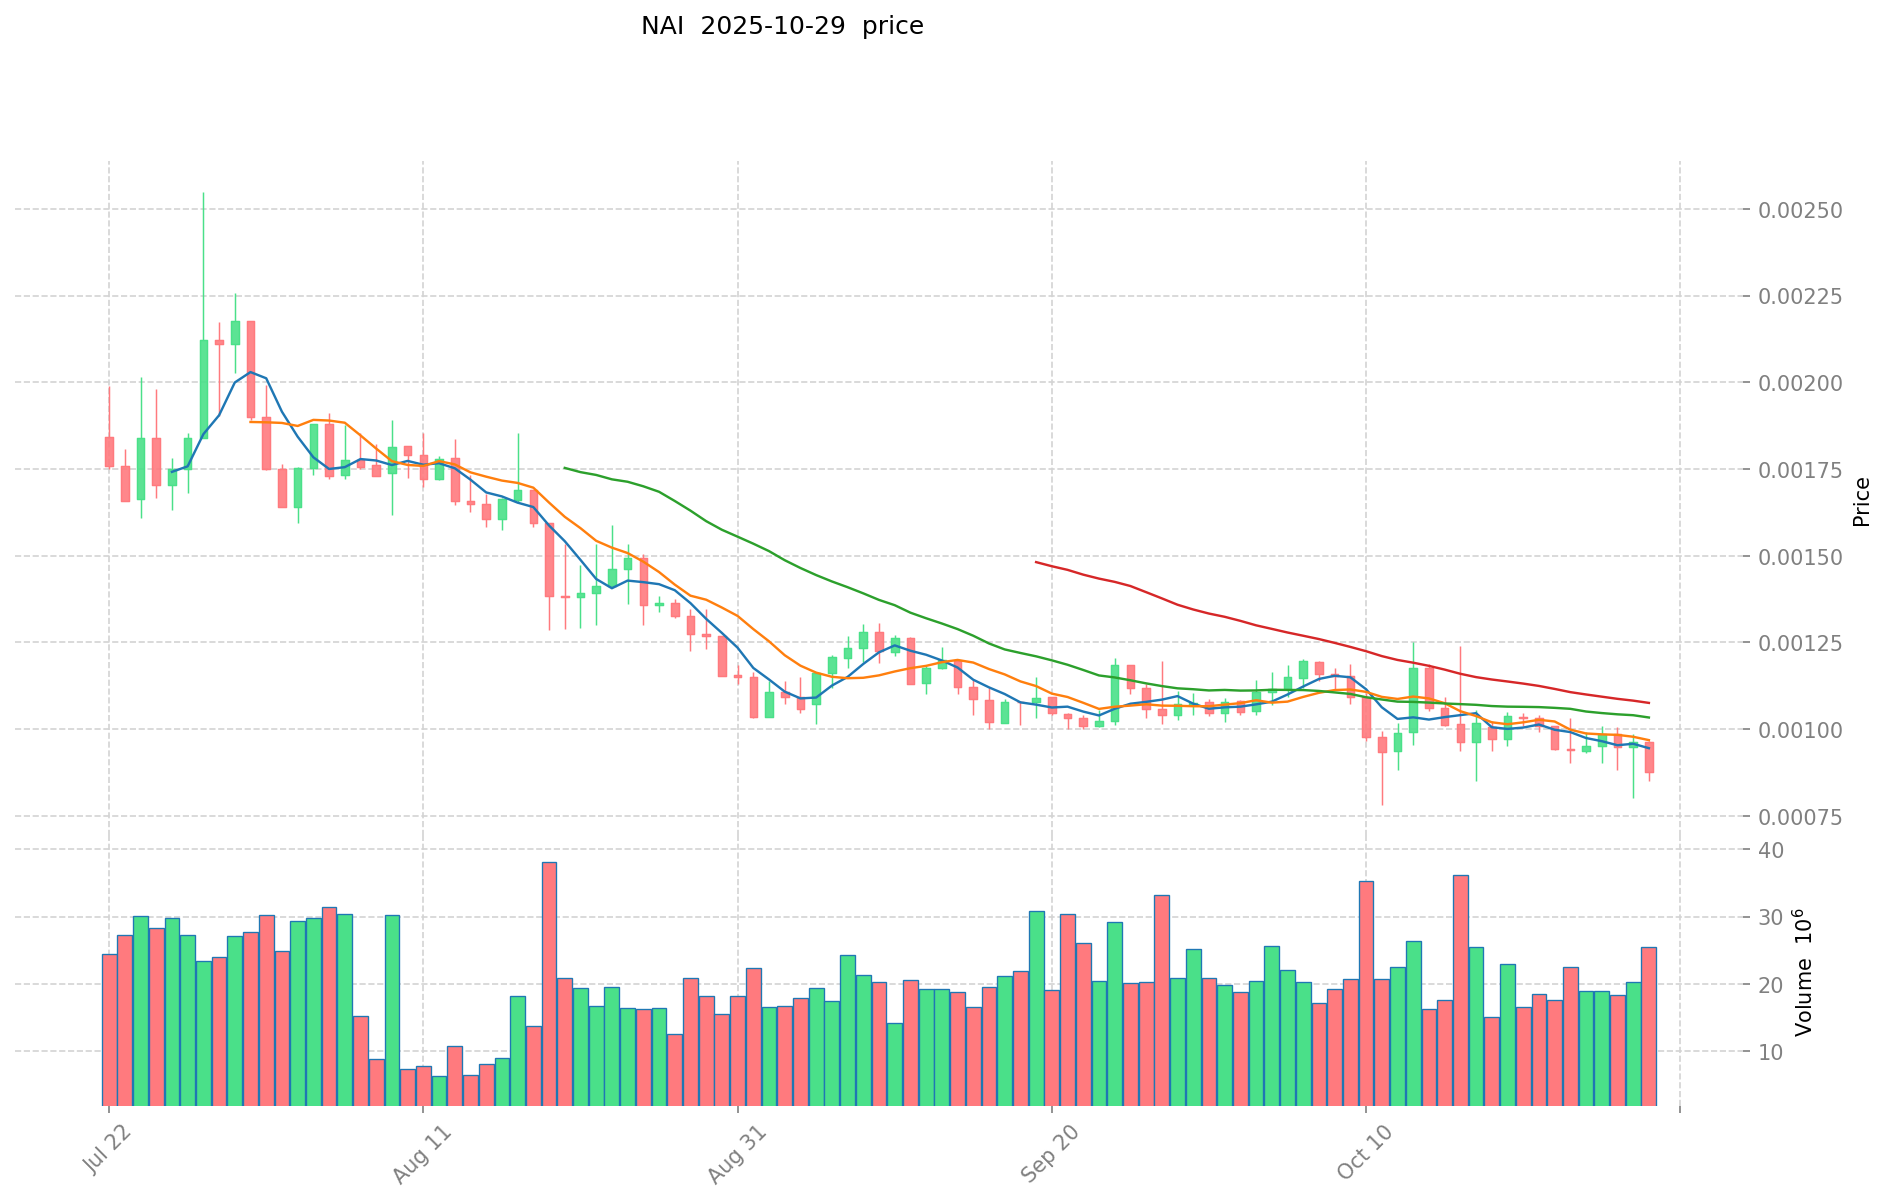
  • 2024: NAI reached its all-time high of $0.078273 on April 19, 2024.
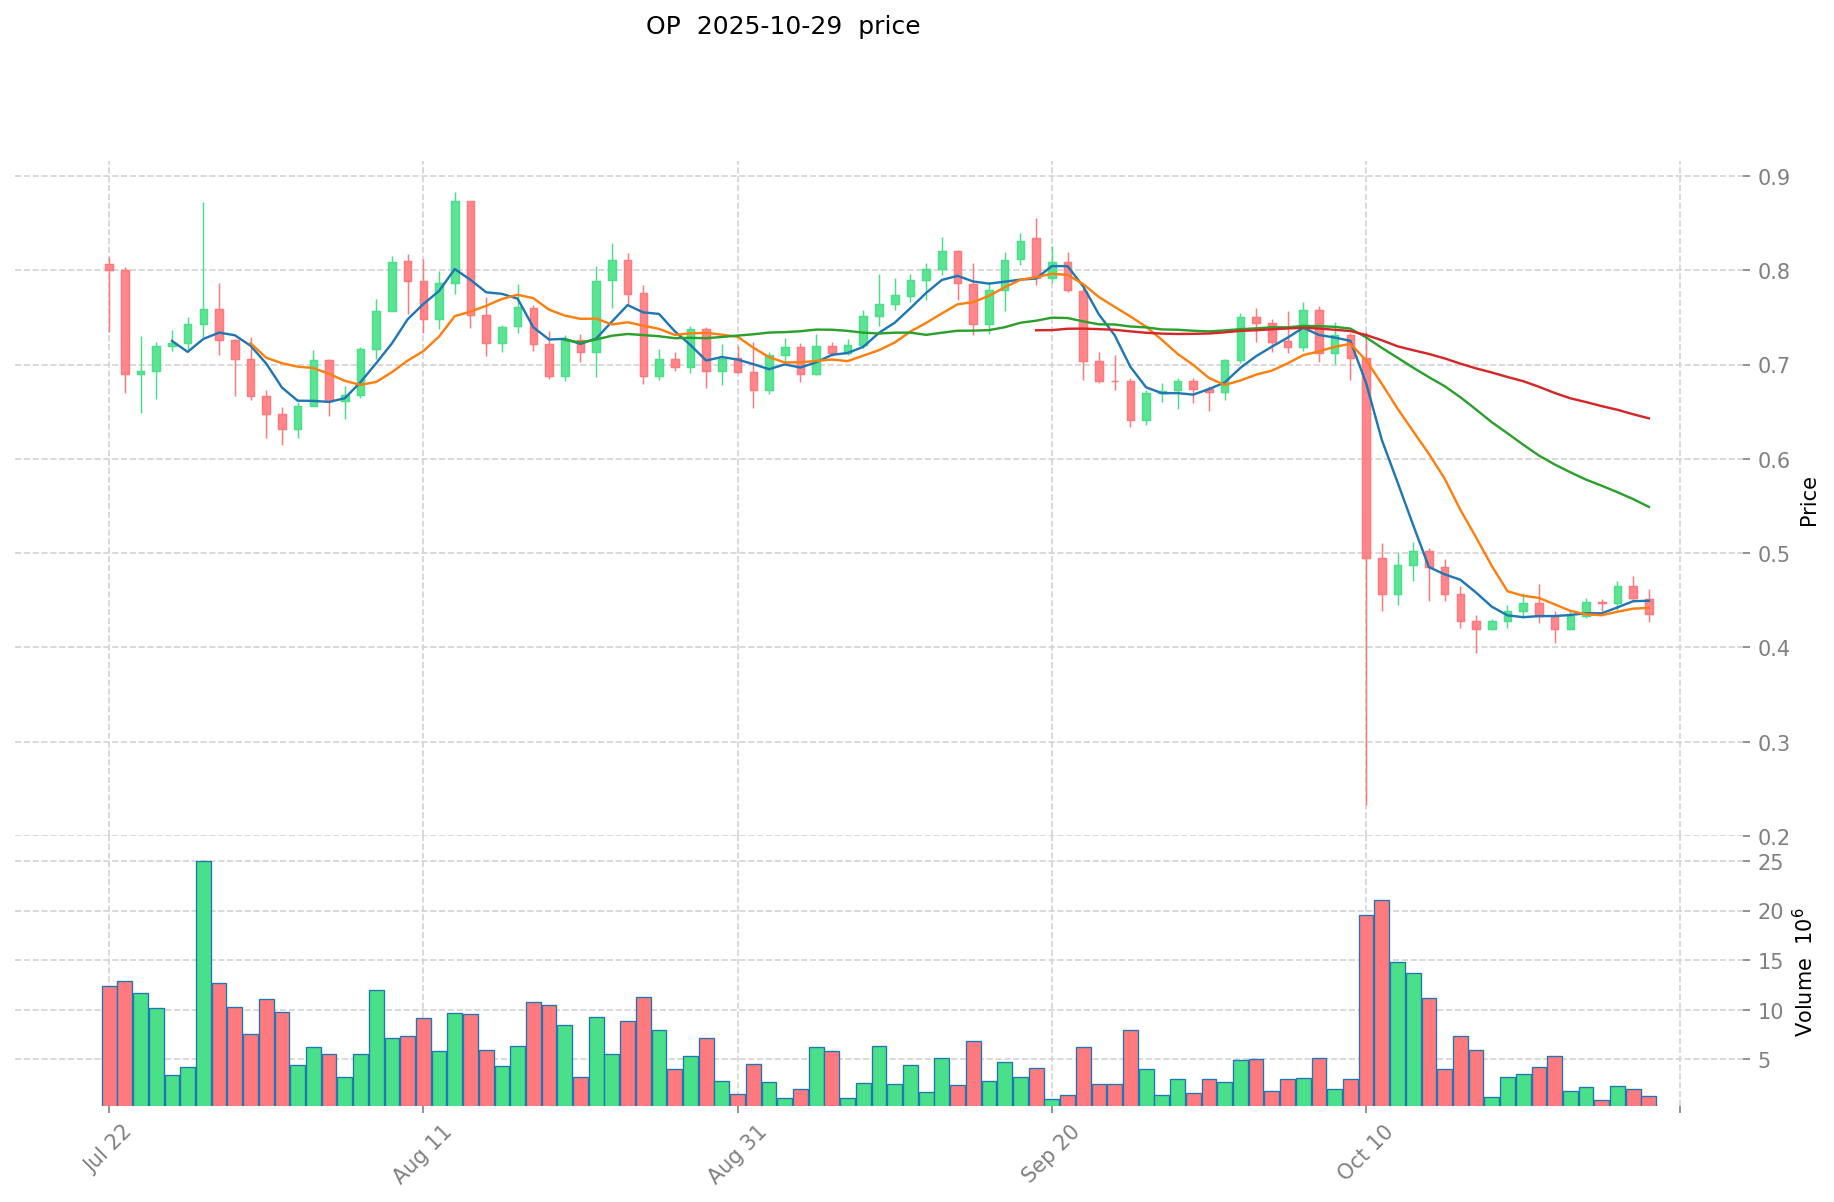
  • 2024: OP hit its peak price of $4.84 on March 6, 2024.
  • Comparative analysis: In the recent market cycle, NAI dropped from its high of $0.078273 to a low of $0.00078, while OP declined from $4.84 to $0.34081.

Current Market Situation (2025-10-29)

  • NAI current price: $0.0008765
  • OP current price: $0.437
  • 24-hour trading volume: NAI $23,379.90 vs OP $544,544.83
  • Market Sentiment Index (Fear & Greed Index): 51 (Neutral)

Click to view real-time prices:

price_image1 price_image2

II. Core Factors Influencing NAI vs OP Investment Value

Supply Mechanism Comparison (Tokenomics)

  • NAI: Fixed supply with deflationary model
  • OP: Gradual release mechanism with strategic distribution
  • 📌 Historical Pattern: Supply mechanisms drive cyclical price movements by creating predictable scarcity periods.

Institutional Adoption and Market Applications

  • Institutional Holdings: OP appears to have stronger institutional backing
  • Enterprise Adoption: NAI/OP differ in cross-border payment efficiency, settlement capabilities, and portfolio inclusion
  • Government Policies: Regulatory approaches vary significantly across jurisdictions

Technology Development and Ecosystem Building

  • NAI Technical Upgrades: Enhanced scalability solutions with focus on security
  • OP Technical Development: Layer-2 optimization with emphasis on transaction throughput
  • Ecosystem Comparison: OP demonstrates stronger DeFi integration while NAI shows advantages in payment infrastructure

Macroeconomic Factors and Market Cycles

  • Inflation Performance: Both assets demonstrate inflation hedging capabilities in varying degrees
  • Monetary Policy Impact: Interest rates and USD index fluctuations affect valuation metrics
  • Geopolitical Factors: Cross-border transaction demand increases during international uncertainty

III. 2025-2030 Price Prediction: NAI vs OP

Short-term Prediction (2025)

  • NAI: Conservative $0.000841632 - $0.0008767 | Optimistic $0.0008767 - $0.000955603
  • OP: Conservative $0.406038 - $0.4366 | Optimistic $0.4366 - $0.637436

Mid-term Prediction (2027)

  • NAI may enter a growth phase, with prices expected in the range of $0.0006872968553 - $0.00162955867305
  • OP may enter a bullish market, with prices expected in the range of $0.3877806978 - $0.869163633
  • Key drivers: Institutional capital inflow, ETF, ecosystem development

Long-term Prediction (2030)

  • NAI: Base scenario $0.001653608243133 - $0.002232371128229 | Optimistic scenario $0.002232371128229
  • OP: Base scenario $0.831596542166362 - $1.022863746864625 | Optimistic scenario $1.022863746864625

View detailed price predictions for NAI and OP

Disclaimer: This analysis is based on historical data and market projections. Cryptocurrency markets are highly volatile and unpredictable. This information should not be considered as financial advice. Always conduct your own research before making investment decisions.

NAI:

年份 预测最高价 预测平均价格 预测最低价 涨跌幅
2025 0.000955603 0.0008767 0.000841632 0
2026 0.00130093513 0.0009161515 0.000632144535 4
2027 0.00162955867305 0.001108543315 0.0006872968553 26
2028 0.001889290371754 0.001369050994025 0.000876192636176 56
2029 0.001678045803376 0.001629170682889 0.001010085823391 85
2030 0.002232371128229 0.001653608243133 0.001190597935055 88

OP:

年份 预测最高价 预测平均价格 预测最低价 涨跌幅
2025 0.637436 0.4366 0.406038 0
2026 0.80015682 0.537018 0.46183548 22
2027 0.869163633 0.66858741 0.3877806978 52
2028 0.822696808005 0.7688755215 0.469014068115 75
2029 0.867406919580225 0.7957861647525 0.692333963334675 82
2030 1.022863746864625 0.831596542166362 0.640329337468099 90

IV. Investment Strategy Comparison: NAI vs OP

Long-term vs Short-term Investment Strategies

  • NAI: Suitable for investors focused on AI and data ecosystem potential
  • OP: Suitable for investors looking for Ethereum scaling solutions and DeFi integration

Risk Management and Asset Allocation

  • Conservative investors: NAI: 20% vs OP: 80%
  • Aggressive investors: NAI: 40% vs OP: 60%
  • Hedging tools: Stablecoin allocation, options, cross-currency portfolios

V. Potential Risk Comparison

Market Risk

  • NAI: Higher volatility due to lower market cap and trading volume
  • OP: Exposure to Ethereum ecosystem risks and Layer 2 competition

Technical Risk

  • NAI: Scalability, network stability
  • OP: Ethereum dependency, potential vulnerabilities in Layer 2 technology

Regulatory Risk

  • Global regulatory policies may impact both differently, with OP potentially facing more scrutiny due to its DeFi focus

VI. Conclusion: Which Is the Better Buy?

📌 Investment Value Summary:

  • NAI advantages: Potential in AI and data ecosystems, fixed supply with deflationary model
  • OP advantages: Strong institutional backing, established Layer 2 solution, DeFi integration

✅ Investment Advice:

  • New investors: Consider a small allocation to OP as part of a diversified crypto portfolio
  • Experienced investors: Balanced approach with both NAI and OP, adjusting based on risk tolerance
  • Institutional investors: Higher allocation to OP due to its established market position and ecosystem

⚠️ Risk Warning: Cryptocurrency markets are highly volatile. This article does not constitute investment advice. None

VII. FAQ

Q1: What are the main differences between NAI and OP? A: NAI is a Layer 1 infrastructure provider for AI data ecosystems, while OP is a Layer 2 scaling solution for Ethereum. NAI has a fixed supply with a deflationary model, while OP has a gradual release mechanism. OP has stronger institutional backing and DeFi integration, while NAI shows advantages in payment infrastructure.

Q2: Which cryptocurrency has shown better price performance recently? A: Based on the data provided, OP has shown better price performance. While NAI's all-time high was $0.078273, OP reached $4.84. Currently, OP is trading at $0.437, while NAI is at $0.0008765.

Q3: What are the key factors influencing the investment value of NAI and OP? A: Key factors include supply mechanisms, institutional adoption, technological development, ecosystem building, macroeconomic factors, and market cycles. OP appears to have stronger institutional backing and DeFi integration, while NAI focuses on AI and data ecosystems.

Q4: What are the price predictions for NAI and OP in 2030? A: For NAI, the base scenario predicts a range of $0.001653608243133 - $0.002232371128229. For OP, the base scenario predicts a range of $0.831596542166362 - $1.022863746864625. However, these are projections and should not be considered as financial advice.

Q5: How should investors allocate their assets between NAI and OP? A: Conservative investors might consider allocating 20% to NAI and 80% to OP, while aggressive investors might opt for 40% NAI and 60% OP. However, individual allocations should be based on personal risk tolerance and investment goals.

Q6: What are the main risks associated with investing in NAI and OP? A: Both face market risks due to cryptocurrency volatility. NAI has higher volatility due to lower market cap and trading volume. OP is exposed to Ethereum ecosystem risks and Layer 2 competition. Technical risks include scalability issues for NAI and potential vulnerabilities in Layer 2 technology for OP. Both also face regulatory risks, with OP potentially facing more scrutiny due to its DeFi focus.

* The information is not intended to be and does not constitute financial advice or any other recommendation of any sort offered or endorsed by Gate.
Related Articles
QFS Crypto Explained: What the Quantum Financial System Means for Digital Assets

QFS Crypto Explained: What the Quantum Financial System Means for Digital Assets

Discover the groundbreaking Quantum Financial System (QFS) and its transformative impact on digital assets, combining quantum computing, AI, and blockchain for unparalleled transaction security, speed, and decentralization. This article dissects QFS technology, compares it to traditional crypto systems, and explores its integration with blockchain for enhanced smart contracts and scalability. Addressing digital asset management challenges, it highlights quantum-resistant cryptocurrencies as future-proven solutions. Perfect for finance professionals and crypto enthusiasts, this thorough exploration includes insights into the role of Gate in supporting quantum-resilient projects.
2025-09-04 19:09:33
2025 LUMIA Price Prediction: Future Value Analysis and Market Trends for Investors

2025 LUMIA Price Prediction: Future Value Analysis and Market Trends for Investors

This article offers a comprehensive analysis of Lumia's price trends from 2025 to 2030, emphasizing its role in the DeFi landscape and potential investment value. It explores Lumia's market position, historical price movements, and factors influencing future prices, providing investment strategies for different risk tolerances. Investors will benefit from insights into market sentiment, macroeconomic impacts, and technological developments. Suitable for beginners to institutional investors, the article highlights key risks, including market volatility and regulatory challenges, while recommending trading options like spot trading and staking on Gate.
2025-10-05 02:02:29
What is Moni ? A Guide

What is Moni ? A Guide

Explore Moni cryptocurrency, a decentralized innovation on the BNB Smart Chain, designed to empower investors with AI-driven insights and community engagement tools. The article delves into Moni's unique blockchain features, including fast transactions, extensive interoperability, and advanced tokenomics. It guides beginners on integrating Moni tokens into investment strategies while highlighting Moni's superiority over traditional cryptocurrencies in areas such as transaction speeds and AI integration. This resourceful guide is ideal for crypto enthusiasts and newcomers aiming to leverage cutting-edge technology in their investment approaches.
2025-09-11 03:26:43
2025 SPrice Prediction: Analyzing Future Market Trends and Investment Opportunities

2025 SPrice Prediction: Analyzing Future Market Trends and Investment Opportunities

The article "2025 S Price Prediction: Analyzing Future Market Trends and Investment Opportunities" provides a deep dive into Sonic (S)'s market potential as an EVM Layer 1 platform with a focus on its price trends from 2025 to 2030. It addresses key areas such as price history, current market conditions, and factors influencing future prices, including supply mechanisms, institutional dynamics, macroeconomic influences, and technical advancements. The piece is designed for investors seeking insights into price predictions, investment strategies, and risk management, alongside potential market challenges. Its structured analysis benefits investors ranging from beginners to institutions by offering clear investment recommendations and trading strategies.
2025-09-16 06:40:38
How Does Sui's On-Chain Data Analysis Reveal Its Growth in 2025?

How Does Sui's On-Chain Data Analysis Reveal Its Growth in 2025?

The article explores Sui's substantial growth in 2025 through on-chain data analysis, highlighting the surge in active addresses and daily transaction volumes due to DeFi expansion. It addresses the network’s adoption driven by gaming, NFT marketplaces, and its robust technical architecture. Readers interested in blockchain growth will find insights into Sui's rising TVL, stablecoin supply, and whale activity, underscoring the platform’s maturity and investor confidence. Keywords like "Sui Network growth," "DeFi," "active addresses," and "whale activity" enhance readability for quick scanning.
2025-11-03 08:42:45
2025 LRC Price Prediction: Analyzing Market Trends, Tokenomics and Growth Potential in the Layer 2 Ecosystem

2025 LRC Price Prediction: Analyzing Market Trends, Tokenomics and Growth Potential in the Layer 2 Ecosystem

This article provides an in-depth analysis of Loopring (LRC) within the layer-2 ecosystem, focusing on its market position, historical price trends, and growth potential as of 2025. It offers professional price predictions from 2025 to 2030, exploring key factors such as tokenomics, macroeconomic impacts, and technological advancements influencing LRC's future value. Targeting investors and crypto enthusiasts, the piece outlines investment strategies, risk management frameworks, and addresses potential market, regulatory, and technical risks. Readers will gain insights into LRC's investment value, trading methods, and FAQs on future price projections.
2025-09-26 07:47:40
Recommended for You
What is Hopium in Crypto?

What is Hopium in Crypto?

# Understanding Hopium in the World of Cryptocurrency This comprehensive guide explores "hopium"—a critical cryptocurrency slang term blending "hope" and "opium"—essential for investors navigating volatile markets. Discover how hopium manifests as unfounded optimism about struggling tokens and differs from related concepts like FOMO and copium. The article examines hopium's negative connotations within crypto communities, provides real-world usage examples, and offers practical strategies to identify and avoid hopium traps on Gate. Learn how irrational sentiment drives market volatility and financial losses, empowering you to make evidence-based investment decisions.
2026-01-06 02:39:16
Japan's New Crypto Regulatory Shift: What Investors Need to Know in 2026

Japan's New Crypto Regulatory Shift: What Investors Need to Know in 2026

# Article Introduction Japan's 2026 "Digital Year" declaration marks a historic transformation in cryptocurrency regulation, fundamentally reshaping how digital assets are classified, taxed, and traded. This comprehensive guide explores Japan's shift from payment-based frameworks to securities law governance, the revolutionary flat 20% tax rate on crypto gains, and the integration of 105 approved cryptocurrencies into traditional stock exchanges. Designed for crypto investors, institutional traders, and financial advisors, this article reveals how regulated access through platforms like Gate creates institutional-grade market infrastructure comparable to global securities markets. Discover how Japan's coordinated regulatory reforms position digital assets as legitimate investment vehicles, eliminating previous tax inefficiencies while establishing transparent, protected trading environments that attract mainstream capital participation.
2026-01-06 02:38:42
Buy XRP

Buy XRP

# Guide to Purchasing XRP (XRP) Easily This comprehensive guide empowers beginners and experienced traders to buy XRP securely on Gate through multiple payment methods. Learn how to create an account, select your preferred purchase option—including debit/credit cards, Google Pay, Apple Pay, peer-to-peer trading, and spot trading—then manage your XRP holdings effectively. The guide addresses key concerns about security, fees, and market risks while highlighting Gate's advantages: fast execution, intuitive interface, industry-leading liquidity, and multi-layer security infrastructure. Whether you're buying XRP for international transfers, portfolio diversification, or yield earning opportunities, this step-by-step walkthrough simplifies the entire process from account setup to trading your XRP across thousands of supported pairs.
2026-01-06 02:38:05
Why Silver Surged Past $75 as Venezuela Tensions Escalated

Why Silver Surged Past $75 as Venezuela Tensions Escalated

# Article Overview: Why Silver Surged Past $75 as Venezuela Tensions Escalated This comprehensive analysis examines how Venezuela's geopolitical crisis triggered a dramatic safe-haven rally in precious metals, propelling silver to $75.968 per ounce. The article explores the interconnected factors driving this surge: immediate safe-haven demand from institutional investors, silver's outperformance over gold, supply chain vulnerabilities in major exporting nations, and amplifying effects from central bank buying and Federal Reserve monetary easing expectations. Designed for commodity traders, portfolio managers, and risk-conscious investors, this piece demonstrates how geopolitical shocks reshape asset allocation strategies and create trading opportunities on Gate. Key topics include XAG/USD technical breakouts, precious metals diversification frameworks, real interest rate implications, and structural market shifts validating alternative asset hedging strategies during periods of international instability.
2026-01-06 02:37:50
Memecoin Market Rebounds in Early 2026: What It Means for Dogecoin, SHIB & BONK

Memecoin Market Rebounds in Early 2026: What It Means for Dogecoin, SHIB & BONK

# Article Overview: Memecoin Market Rebounds in Early 2026 The memecoin market has staged a dramatic 34% recovery to $47 billion in early 2026, with Dogecoin, SHIB, and BONK leading the charge. This comprehensive guide examines the structural drivers behind this memecoin surge, retail investor participation patterns, and critical factors determining whether this rally sustains or reverses. Ideal for traders and investors on Gate seeking to understand memecoin market dynamics, the article analyzes performance metrics across leading tokens, explores psychological drivers reshaping capital allocation, and evaluates sustainability through technical and on-chain analysis. Discover what distinguishes temporary momentum from structural recovery, enabling data-driven decisions within the volatile memecoin sector.
2026-01-06 02:37:32
What Bank of America's 1%–4% Crypto Guideline Means for Bitcoin ETF Demand

What Bank of America's 1%–4% Crypto Guideline Means for Bitcoin ETF Demand

# Article Overview: Bank of America's 1%–4% Crypto Allocation Guideline and Bitcoin ETF Demand Bank of America's approval of proactive spot Bitcoin ETF recommendations marks a watershed moment in institutional cryptocurrency adoption, with the nation's second-largest bank establishing formal 1%–4% allocation guidelines for its 15,000+ wealth advisors managing $2.9 trillion in assets. This comprehensive analysis examines how institutional-grade crypto frameworks are transforming Bitcoin ETF demand among conservative allocators, addressing wealth managers' historical hesitations through regulatory-approved ETFs, custody safeguards, and curated product selections. The article explores the strategic shift from reactive client requests to proactive advisor recommendations, the convergence of major Wall Street institutions around consensus allocation ranges, and why the 1%–4% corridor represents the optimal balance between meaningful exposure and institutional risk management. Designed for wealth managers, institu
2026-01-06 02:36:08