Descubra una comparativa exhaustiva entre PUNDIX y GRT, dos tokens de utilidad destacados en el ámbito blockchain. El artículo examina el potencial de inversión, la evolución de los precios y las particularidades de cada uno en el ecosistema cripto, aportando claves sobre cuál podría ser la mejor alternativa de compra en este momento. Analice la tokenomics, las dinámicas de mercado y las proyecciones futuras para optimizar su estrategia de inversión en estos activos de vanguardia exclusivamente en Gate.
Introducción: Comparativa de inversión PUNDIX vs GRT
En el sector de las criptomonedas, la comparación entre PUNDIX y GRT es una cuestión clave para cualquier inversor. Ambas presentan diferencias sustanciales en capitalización de mercado, aplicaciones, evolución de precios y posicionamiento en el universo de activos digitales.
PUNDIX (PUNDIX): Desde su lanzamiento, ha destacado por facilitar el uso cotidiano de criptomonedas, permitiendo a los usuarios comprar y gastar cripto en cualquier momento y lugar mediante una red de pagos descentralizada offline, soportada por dispositivos XPOS instalados en más de 25 países.
GRT (GRT): Desde su creación, se ha posicionado como protocolo descentralizado para indexación y consulta de datos blockchain en Ethereum, convirtiéndose en una infraestructura esencial que permite a cualquier usuario crear y publicar APIs abiertas (subgraphs) para el acceso ágil a datos.
Este artículo realiza un análisis exhaustivo sobre el valor de inversión de PUNDIX y GRT, abordando tendencias históricas de precios, mecanismos de suministro, adopción de mercado y entorno tecnológico, con el objetivo de responder la pregunta principal del inversor:
"¿Cuál es la mejor opción de compra actualmente?"
Informe comparativo: PUNDIX vs The Graph (GRT)
I. Comparativa histórica de precios y situación de mercado actual
Tendencias históricas de precios: PUNDIX y GRT
PUNDIX (Pundi X):
- 31 de marzo de 2021: Máximo histórico de $10,07 tras migración de token de NPXS a PUNDIX con reducción 1000:1
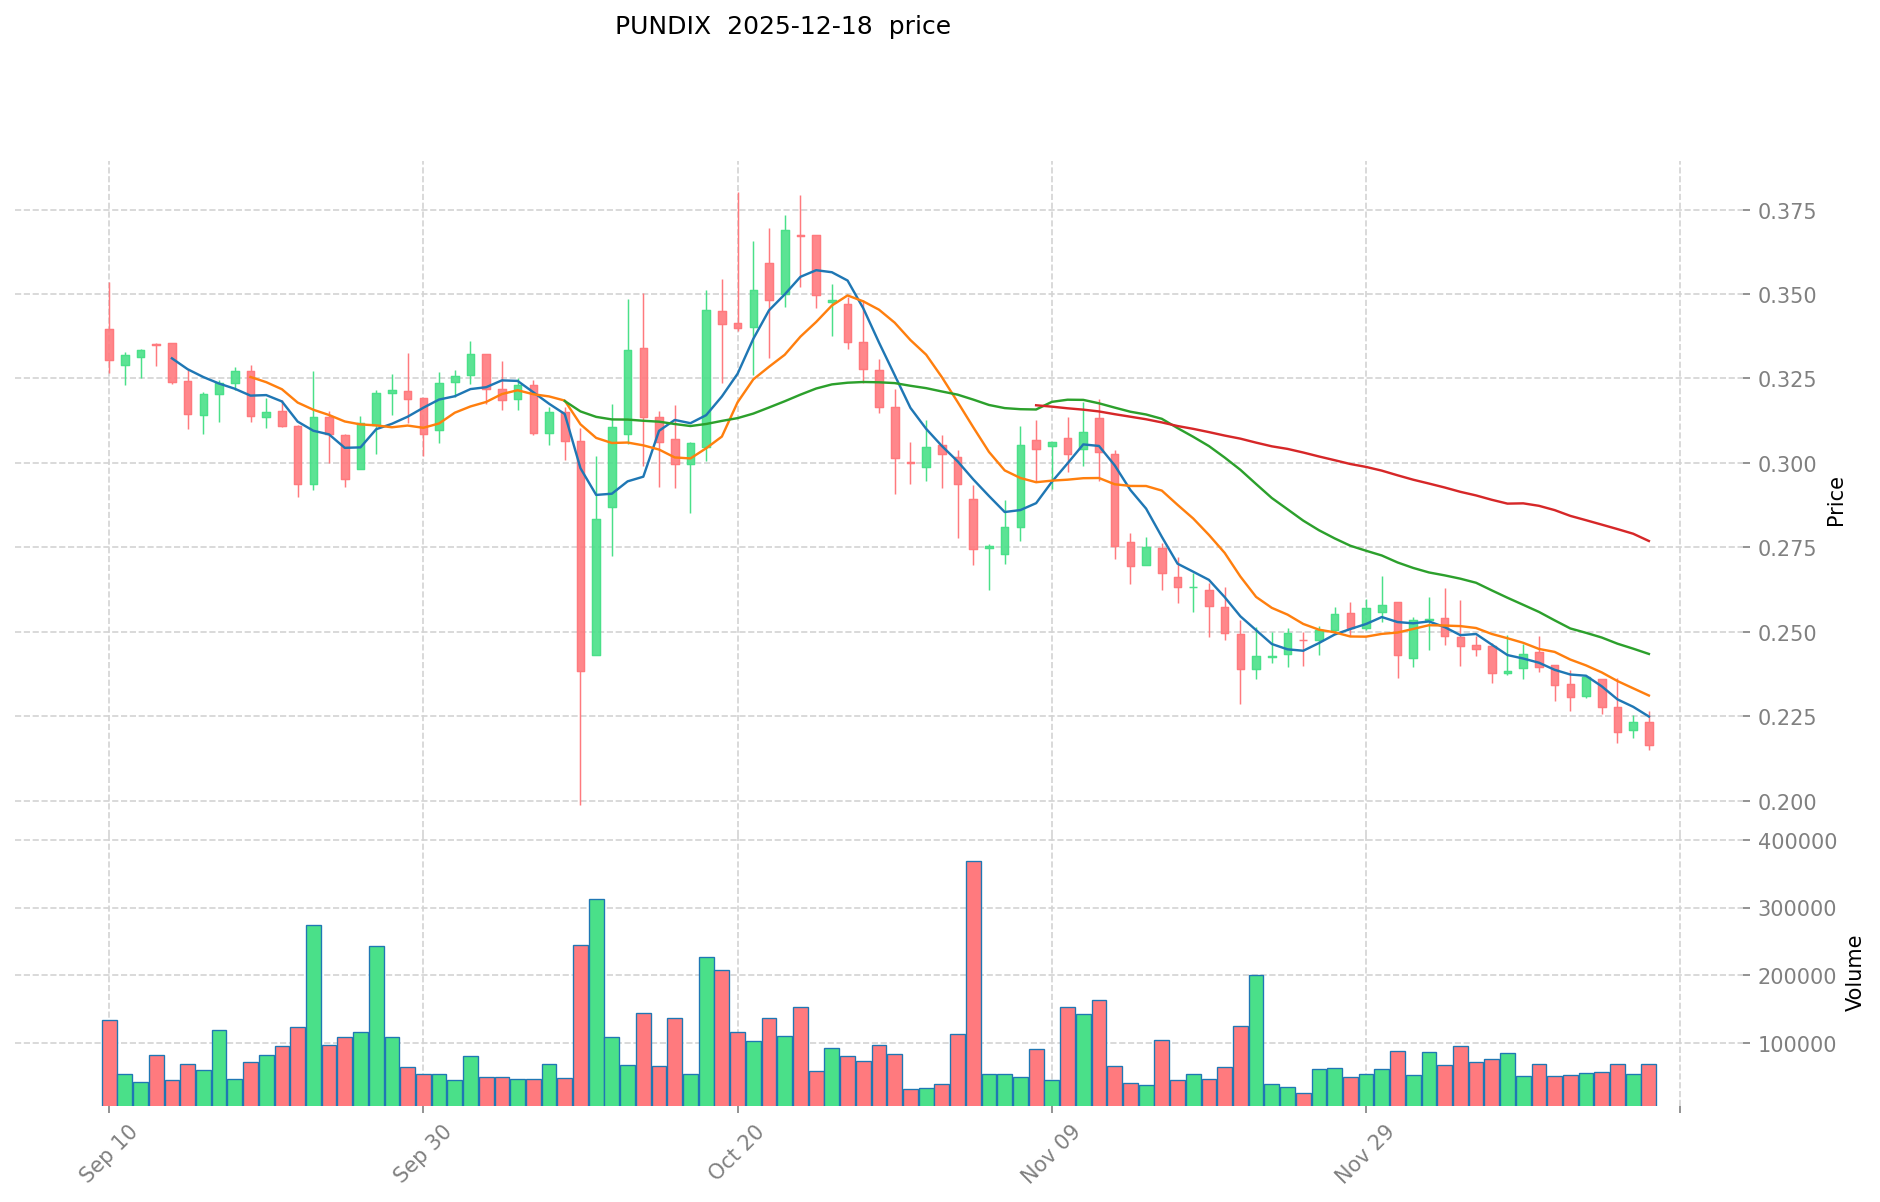
- 11 de octubre de 2025: Mínimo histórico de $0,212924
- Evolución de precio: Caída de $10,07 a niveles actuales, descenso del 99,78% desde el máximo
The Graph (GRT):
- 12 de febrero de 2021: Máximo histórico de $2,84
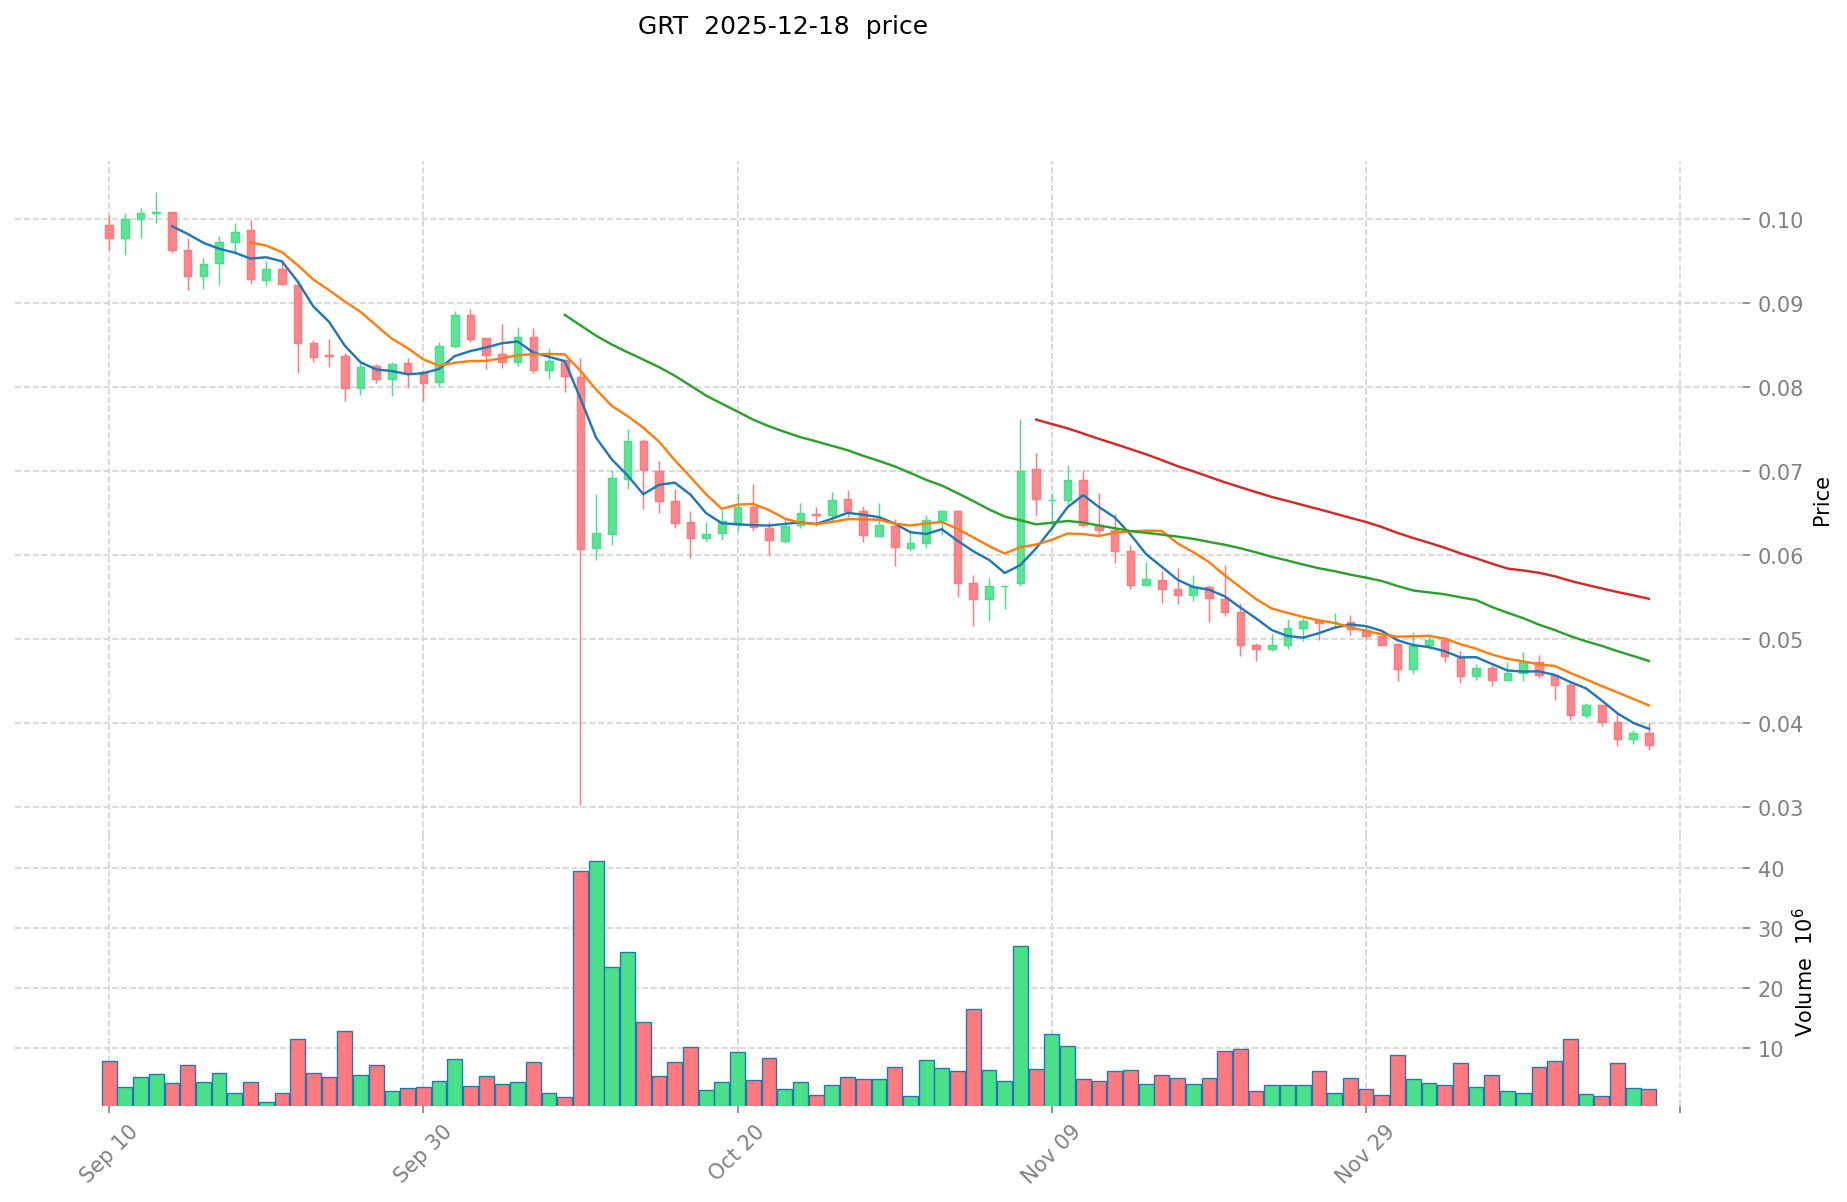
- 18 de diciembre de 2025: Mínimo histórico de $0,03679815
- Evolución de precio: Descenso de $2,84 a niveles actuales, caída del 87,05% desde el máximo
Análisis comparativo:
Ambos tokens han sufrido presiones bajistas desde sus picos de 2021. PUNDIX ha registrado una depreciación más marcada en términos porcentuales, mientras GRT mantiene mayor volumen negociado y adopción de mercado en aplicaciones de infraestructura. Ambos reflejan la complejidad del entorno altcoin tras el ciclo alcista de 2021.
Situación actual de mercado (18 de diciembre de 2025)
PUNDIX:
- Precio actual: $0,2175
- Capitalización de mercado: $56 199 072,69
- Volumen negociado 24h: $15 106,75
- Ranking de mercado: #467
- Cantidad en circulación: 258 386 541 PUNDIX
- Variación 1h: -0,5%
- Variación 24h: -2,55%
- Variación 7 días: -5,48%
- Variación 30 días: -16,76%
- Variación anual: -56,98%
The Graph (GRT):
- Precio actual: $0,0367
- Capitalización de mercado: $391 038 732,94
- Volumen negociado 24h: $127 782,37
- Ranking de mercado: #142
- Cantidad en circulación: 10 655 006 347,16 GRT
- Variación 1h: -1,13%
- Variación 24h: -4,7%
- Variación 7 días: -16,66%
- Variación 30 días: -34,12%
- Variación anual: -85,91%
Índice de Sentimiento de Mercado (Fear & Greed Index):
- Valor actual: 17
- Estado: Miedo extremo
Referencias de precios actuales:
II. Descripción de proyectos y fundamentos
PUNDIX - Ecosistema Pundi X
Misión del proyecto:
Pundi X busca democratizar el acceso a las criptomonedas para facilitar su uso cotidiano. El protocolo establece la red descentralizada offline más grande del mundo mediante integración física en puntos de venta.
Infraestructura principal:
- XPOS: Dispositivos POS instalados en comercios de más de 25 países
- XWallet: Aplicación móvil con más de 100 000 usuarios registrados
- Tarjetas de recarga cripto: Más de 50 000 emitidas
- Utilidad del token: PUNDIX sirve para comisiones, recompensas y incentivos en el ecosistema Pundi X
Métricas clave:
- Titulares totales: 18 417
- Disponibilidad en exchanges: 20
- Cuota de mercado: 0,0018%
The Graph (GRT) - Infraestructura de datos blockchain
Misión del proyecto:
The Graph proporciona un protocolo descentralizado para indexar y consultar datos blockchain, especialmente en Ethereum e IPFS. Permite a los desarrolladores crear y publicar APIs abiertas (subgraphs) para un acceso sencillo a datos.
Funciones económicas principales:
- Staking de indexadores staking: Los indexadores hacen staking de GRT para ser visibles en el mercado de consultas y aportar seguridad económica
- Señalización de curadores: Los curadores bloquean GRT para predecir subgraphs valiosos y reciben recompensas
- Liquidación de consultas: Los usuarios pagan en ETH o DAI; la liquidación final es en GRT como unidad contable
- Incentivos inflacionarios: Política dinámica de inflación para fomentar conductas específicas en la red
Métricas clave:
- Titulares totales: 173 475
- Disponibilidad en exchanges: 61
- Cuota de mercado: 0,012%
- Redes soportadas: Ethereum (ETH), Arbitrum (ARBEVM)
Análisis de volatilidad de precios
Desempeño reciente de PUNDIX:
- Corto plazo: Negativo (caída del 2,55% en 24h)
- Medio plazo: Moderado (caída del 5,48% en 7 días)
- Largo plazo: Bajista (caída del 56,98% anual)
Desempeño reciente de The Graph:
- Corto plazo: Más negativo (caída del 4,7% en 24h)
- Medio plazo: Significativo (caída del 16,66% en 7 días)
- Largo plazo: Bajista severo (caída del 85,91% anual)
Comparativa de capitalización de mercado
| Métrica |
PUNDIX |
The Graph |
| Capitalización de mercado |
$56,20 M |
$391,04 M |
| Valoración totalmente diluida |
$56,20 M |
$396,37 M |
| Ratio Capitalización/FDV |
99,95% |
98,66% |
| Dominio de mercado |
0,0018% |
0,012% |
The Graph mantiene una capitalización y reconocimiento de mercado notablemente superiores, con un valor de mercado 7 veces mayor que PUNDIX.
Volumen negociado y liquidez
- Volumen 24h PUNDIX: $15 106,75
- Volumen 24h The Graph: $127 782,37
- Ratio de volumen: GRT registra 8,5 veces más actividad negociadora
GRT demuestra mayor liquidez y actividad, lo que indica mayor interés institucional y mejor acceso al mercado.
IV. Infraestructura on-chain y adopción de red
Desarrollo del ecosistema PUNDIX
La infraestructura se orienta a la integración física en comercios, más allá de métricas blockchain. El despliegue de más de 25 000 terminales XPOS en 25 países y la emisión de 50 000+ tarjetas de recarga muestran intentos de expansión real, pero el número de titulares (18 417) es bajo respecto a sus ambiciones globales.
Red de protocolo The Graph
The Graph opera a nivel de protocolo blockchain, facilitando el desarrollo de aplicaciones descentralizadas. Destaca su integración con DeFi (Aave, Curve, Uniswap). El número de titulares (173 475) refleja mayor participación institucional y de desarrolladores. El despliegue multichain amplía el soporte ecosistémico.
Análisis de valor de inversión: PUNDIX vs GRT
I. Resumen ejecutivo
Este informe examina los factores clave de valor de inversión de PUNDIX y GRT, dos activos cripto con funciones distintas en el ecosistema blockchain. PUNDIX se orienta a pagos blockchain, GRT a infraestructura DeFi. El análisis abarca tokenomics, adopción de mercado, desarrollo tecnológico e impacto macroeconómico.
II. Factores que influyen en el valor de inversión PUNDIX vs GRT
Mecanismo de suministro y tokenomics
- PUNDIX: La escasez de suministro y la circulación de tokens sustentan su valor. La estructura de suministro afecta la volatilidad de precios y el potencial de crecimiento a largo plazo.
- GRT: Los mecanismos de suministro impactan la dinámica de mercado a través de ciclos de adopción institucional y masiva.
- 📌 Patrón histórico: Los mecanismos de suministro generan ciclos de precios influidos por la percepción de escasez y velocidad de circulación.
Adopción institucional y aplicaciones de mercado
- Tenencias institucionales: La preferencia varía según el caso de uso y la certidumbre regulatoria. PUNDIX atrae perfiles distintos respecto a GRT.
- Adopción empresarial:
- PUNDIX: Solución de pago blockchain para superar barreras en transacciones cotidianas.
- GRT: Infraestructura para DeFi, con casos de uso y segmentos diferenciados.
- Entorno regulatorio: La política y la actitud regulatoria en cada jurisdicción condicionan la adopción y el interés inversor.
Desarrollo tecnológico y ecosistema
- PUNDIX: Fundado en 2018 por Pundi X Labs para resolver obstáculos prácticos de adopción. Su desarrollo técnico busca agilizar transacciones cripto cotidianas.
- GRT: Proporciona utilidades infraestructurales al sector DeFi.
- Comparativa ecosistémica: PUNDIX opera en pagos y GRT en infraestructura DeFi. El desarrollo técnico y ecológico es clave para el valor sostenido.
Factores macroeconómicos y ciclos de mercado
- Entorno inflacionario: Macrotendencias, regulaciones y avances tecnológicos influyen en los precios. El sentimiento ante adopción masiva o innovaciones técnicas marca los movimientos de precio.
- Política monetaria: Tasas de interés y fluctuaciones del dólar afectan la valoración de ambos activos.
- Factores geopolíticos: La demanda de transacciones internacionales y eventos globales influyen en la adopción y el mercado.
III. Factores clave para el precio
El sentimiento de mercado es crítico para los pares PUNDIX/USD y similares. La confianza inversora incide directamente en la evolución de precios, especialmente ante:
- Anuncios de adopción masiva
- Innovaciones tecnológicas relevantes
- Cambios regulatorios
- Variaciones macroeconómicas
IV. Factores de riesgo y consideraciones
- La volatilidad de precio es elevada en ambos activos
- La incertidumbre regulatoria persiste en distintas jurisdicciones
- El sentimiento de mercado puede cambiar rápidamente ante anuncios técnicos o regulatorios
- Las condiciones macroeconómicas afectan la valoración de los activos
V. Conclusión
PUNDIX y GRT son oportunidades de inversión diferenciadas en el entorno cripto y cubren segmentos de mercado distintos. Su valor depende de mecanismos de suministro, adopción institucional, progreso tecnológico y factores macroeconómicos. El inversor debe monitorizar la evolución regulatoria, las novedades técnicas y el sentimiento de mercado para valorar la oportunidad en cada momento.
Advertencia legal: Este informe es solo informativo y no constituye asesoramiento de inversión.
III. Pronóstico de precios 2025-2030: PUNDIX vs GRT
Pronóstico a corto plazo (2025)
- PUNDIX: Conservador $0,124-$0,218 | Optimista $0,218-$0,259
- GRT: Conservador $0,022-$0,037 | Optimista $0,037-$0,043
Pronóstico a medio plazo (2027-2028)
- PUNDIX podría entrar en fase de acumulación con rango $0,281-$0,431 y potencial de crecimiento del 33-65%
- GRT podría entrar en fase de descubrimiento temprano con rango $0,041-$0,075 y apreciación del 27-58%
- Factores clave: entrada de capital institucional, aprobación de ETF spot, expansión del ecosistema y adopción por desarrolladores
Pronóstico a largo plazo (2029-2030)
- PUNDIX: Base $0,390-$0,428 | Optimista $0,553-$0,679
- GRT: Base $0,066-$0,078 | Optimista $0,090-$0,097
Consulta predicciones detalladas de precios de PUNDIX y GRT
Advertencia legal: Este análisis se basa en datos históricos y modelización matemática. Los mercados de criptomonedas son altamente volátiles y dependen de factores regulatorios, tecnológicos y macroeconómicos. Las predicciones no son asesoramiento de inversión. Haz tu propia investigación y consulta a un profesional antes de invertir. El rendimiento pasado no garantiza resultados futuros.
PUNDIX:
| Año |
Precio máximo previsto |
Precio medio previsto |
Precio mínimo previsto |
Variación |
| 2025 |
0,259182 |
0,2178 |
0,124146 |
0 |
| 2026 |
0,34342704 |
0,238491 |
0,12401532 |
9 |
| 2027 |
0,4306193496 |
0,29095902 |
0,174575412 |
33 |
| 2028 |
0,418515454368 |
0,3607891848 |
0,281415564144 |
65 |
| 2029 |
0,55330629380928 |
0,389652319584 |
0,24937748453376 |
79 |
| 2030 |
0,678930201643161 |
0,47147930669664 |
0,282887584017984 |
116 |
GRT:
| Año |
Precio máximo previsto |
Precio medio previsto |
Precio mínimo previsto |
Variación |
| 2025 |
0,0429858 |
0,03674 |
0,0216766 |
0 |
| 2026 |
0,053814915 |
0,0398629 |
0,024714998 |
8 |
| 2027 |
0,069789972175 |
0,0468389075 |
0,041686627675 |
27 |
| 2028 |
0,074642482992 |
0,0583144398375 |
0,04082010788625 |
58 |
| 2029 |
0,09041070752406 |
0,06647846141475 |
0,05850104604498 |
81 |
| 2030 |
0,097271284742062 |
0,078444584469405 |
0,049420088215725 |
113 |
Análisis comparativo de inversión: PUNDIX vs The Graph (GRT)
IV. Comparación de estrategias de inversión: PUNDIX vs GRT
Estrategia de inversión a largo vs corto plazo
PUNDIX:
- Orientado a inversores centrados en adopción de pagos reales y expansión retail de criptomonedas
- La tesis a largo plazo depende del crecimiento de la red XPOS y la adopción cripto en transacciones diarias en mercados emergentes
- El posicionamiento a corto plazo requiere seguimiento de hitos retail y métricas de adopción
The Graph (GRT):
- Orientado a quienes buscan exposición a la infraestructura DeFi y captación de valor en el protocolo
- La tesis a largo plazo depende del desarrollo DeFi, la adopción de subgraphs y la expansión multichain
- El posicionamiento a corto plazo depende del sentimiento DeFi y la actividad en smart contracts
Gestión de riesgos y asignación de activos
Inversores conservadores:
- PUNDIX: 15-20% de la cartera
- GRT: 25-30%
- Razonamiento: La mayor capitalización y liquidez de GRT facilitan el control de riesgo
Inversores agresivos:
- PUNDIX: 30-40%
- GRT: 20-25%
- Razonamiento: La volatilidad y menor capitalización de PUNDIX ofrecen mayor potencial de crecimiento asimétrico
Instrumentos de cobertura:
- Stablecoins: 20-30% para estabilizar la cartera
- Diversificación cross-asset: Combinar con Ethereum (ETH) u otros tokens de capa 1
- Estrategias con opciones: Considerar puts protectores en periodos de miedo extremo (Fear & Greed Index: 17)
V. Análisis comparativo de riesgos
Riesgo de mercado
PUNDIX:
- Alta volatilidad con depreciación anual del 56,98%; muy sensible a anuncios retail y sentimiento cripto
- Liquidez limitada ($15 106,75 diarios) aumenta la vulnerabilidad ante órdenes grandes
- Riesgo de concentración: 18 417 titulares expone a manipulación por ballenas
The Graph (GRT):
- Volatilidad severa con depreciación anual del 85,91%; presión bajista superior pese a la mayor capitalización
- Mejor liquidez ($127 782,37 diarios) reduce riesgos de impacto de precio
- Mayor diversidad de titulares (173 475) disminuye el riesgo de manipulación
Riesgo tecnológico
PUNDIX:
- Dependencia de infraestructura física: fiabilidad de terminales XPOS, mantenimiento y riesgo de obsolescencia
- Integración compleja: coordinación de red POS en 25+ países implica fragmentación técnica y regulatoria
- Competencia: fintechs y CBDCs pueden desplazar soluciones propietarias
The Graph (GRT):
- Escalabilidad de protocolo: la indexación bajo alta demanda y congestión exige optimización
- Seguridad de smart contracts: posibles vulnerabilidades en contratos centrales pueden afectar fondos
- Dependencia de Ethereum: el rendimiento depende de la red y las tarifas de Ethereum
Riesgo regulatorio
PUNDIX:
- Regulación multijurisdiccional: operar en 25+ países implica requisitos AML, KYC y licencias variadas
- Competencia de CBDC: los pagos digitales emitidos por bancos centrales pueden limitar la adopción cripto retail
- Ambigüedad normativa de XPOS: el estatus legal puede variar conforme evoluciona la regulación fintech
The Graph (GRT):
- Clasificación de token: el tratamiento regulatorio como security o utility varía entre países
- Gobernanza del protocolo: la gestión descentralizada puede ser objeto de escrutinio normativo
- Entorno DeFi: restricciones regulatorias pueden limitar la utilidad y captación de valor de GRT
VI. Conclusión: ¿Cuál es la mejor opción?
Resumen de valor de inversión
PUNDIX: Ventajas
- Infraestructura real de pagos para superar barreras prácticas de adopción cripto
- Baja capitalización ($56,20M), potencial de apreciación superior en ciclos alcistas
- Métricas de despliegue XPOS permiten seguimiento tangible del avance
The Graph: Ventajas
- Protocolo consolidado e integrado en plataformas DeFi (Aave, Curve, Uniswap)
- Capitalización 7 veces mayor ($391,04M), mejor liquidez y acceso institucional
- Soporte multichain (Ethereum, Arbitrum), mayor resiliencia y opciones de crecimiento
- Base de titulares 9 veces superior (173 475 frente a 18 417), menor riesgo de manipulación
Recomendaciones de inversión
Principiantes:
- Principal recomendación: The Graph (GRT) aporta liquidez, integración y menor riesgo, ideal para nuevos inversores
- Estrategia: Promediar el coste de entrada durante 12-24 meses para reducir la volatilidad
- Control de riesgo: Limitar la posición combinada PUNDIX/GRT al 5-10% de la cartera cripto
Experimentados:
- Enfoque mixto: Asignar 60-70% a GRT para estabilidad y 30-40% a PUNDIX por su potencial de crecimiento asimétrico
- Estrategia: GRT como cobertura; PUNDIX como exposición a pagos emergentes
- Gestión activa: Revisar métricas trimestrales, datos de adopción y evolución regulatoria; rebalancear según los cambios de riesgo/rentabilidad
Institucionales:
- Posicionamiento principal: GRT aporta liquidez, disponibilidad y gobernanza idóneas para fondos
- Consideración secundaria: PUNDIX necesita análisis operativo sobre despliegue físico y cumplimiento regulatorio
- Construcción de cartera: GRT como parte de la estrategia DeFi; PUNDIX solo para fondos temáticos especializados
Evaluación de mercado actual (18 de diciembre de 2025)
Ambos activos cotizan en situación de miedo extremo (Fear & Greed Index: 17), generando dinámicas de riesgo/recompensa asimétricas. GRT destaca por su estructura de mercado, liquidez y ecosistema, aportando menor riesgo para exposición infraestructural. PUNDIX, por su estructura subdesarrollada y baja liquidez, implica riesgos elevados y mayor potencial de recompensa para inversores especializados en pagos.
Advertencia de riesgos: Los mercados cripto son extremadamente volátiles, con depreciaciones notables en PUNDIX y GRT este año. Este análisis es solo informativo y no constituye asesoramiento de inversión. Investiga y consulta a profesionales antes de invertir. El rendimiento pasado no garantiza resultados futuros. Las previsiones de precios son estimaciones sujetas a cambios regulatorios, tecnológicos y macroeconómicos que pueden modificar su evolución.
Preguntas frecuentes: Comparativa de inversión PUNDIX vs The Graph (GRT)
FAQ
P1: ¿Cuáles son las principales diferencias de posicionamiento entre PUNDIX y GRT?
R: PUNDIX se especializa en soluciones de pago cripto con terminales XPOS físicos en más de 25 países, facilitando compras y pagos cripto en la vida diaria. The Graph (GRT) es infraestructura descentralizada para indexar y consultar datos blockchain en Ethereum y otras redes, soportando plataformas DeFi como Aave, Curve y Uniswap. PUNDIX está enfocado en pagos retail, GRT en desarrollo de infraestructura de protocolo.
P2: ¿Cómo comparan la capitalización y la liquidez de mercado de estos activos?
R: The Graph tiene una capitalización significativamente mayor de $391,04M frente a $56,20M de PUNDIX—unas 7 veces más. GRT muestra mayor liquidez negociadora con $127 782,37 en 24h frente a $15 106,75 de PUNDIX, 8,5 veces más. GRT cotiza en 61 exchanges y PUNDIX en 20, lo que da a GRT mejor acceso institucional y menor riesgo de impacto en precio.
P3: ¿Qué activo ha sufrido la mayor depreciación desde su máximo histórico?
R: PUNDIX ha caído un 99,78% desde su máximo de $10,07 (31/03/2021) hasta $0,2175, mientras The Graph ha caído un 87,05% desde $2,84 (12/02/2021) hasta $0,0367. Sin embargo, GRT ha tenido peor desempeño anual, con una caída del 85,91% frente al 56,98% de PUNDIX.
P4: ¿Qué diferencias existen en la distribución de titulares y el riesgo de concentración?
R: The Graph tiene una base de titulares mucho mayor (173 475 frente a 18 417), aproximadamente 9 veces más. La concentración en PUNDIX implica mayor riesgo de manipulación y menor resiliencia de mercado, mientras GRT presenta una estructura más descentralizada y menor influencia de grandes actores.
P5: ¿Cuál es más adecuado para inversores principiantes?
R: Se recomienda The Graph (GRT) para principiantes por su infraestructura consolidada, integración en DeFi, mayor liquidez, disponibilidad en exchanges y menor riesgo de manipulación por la amplia base de titulares. La baja liquidez y concentración de PUNDIX aumentan el riesgo de ejecución para principiantes. Lo ideal es promediar coste de entrada en 12-24 meses y limitar la posición combinada al 5-10% de la cartera cripto.
P6: ¿Cómo comparan los pronósticos de precios a largo plazo hasta 2030?
R: Para 2030, PUNDIX se prevé entre $0,39-$0,43 (base) y $0,55-$0,68 (optimista), crecimiento del 79-116%. The Graph entre $0,066-$0,078 (base) y $0,090-$0,097 (optimista), crecimiento del 81-113%. Ambos pueden apreciarse, dependiendo de la adopción, regulación y entorno macroeconómico.
P7: ¿Cuáles son los riesgos principales que diferencian a PUNDIX y GRT?
R: PUNDIX enfrenta riesgos operativos en infraestructura física (fiabilidad XPOS, fragmentación regulatoria y competencia fintech/CBDC). The Graph afronta retos de escalabilidad, dependencia de Ethereum y regulación sobre clasificación del token. GRT tiene menor riesgo de concentración; PUNDIX, mayor riesgo de ejecución por infraestructura limitada.
P8: ¿Qué asignación de cartera se recomienda para inversores experimentados?
R: Se recomienda asignar 60-70% a The Graph por su estabilidad y 30-40% a PUNDIX por su potencial de crecimiento asimétrico. Esta estrategia aprovecha la posición de GRT y permite exposición a la adopción de pagos con PUNDIX. Es clave rebalancear trimestralmente en función de métricas de ecosistema, adopción y regulación para optimizar el retorno/riesgo.
Advertencia legal: Este FAQ es solo informativo y no constituye asesoramiento de inversión. El sector cripto es muy volátil y está sujeto a incertidumbres regulatorias, técnicas y macroeconómicas. Investiga, evalúa tu tolerancia al riesgo y consulta profesionales antes de invertir. El rendimiento pasado no garantiza resultados futuros.
* La información no pretende ser ni constituye un consejo financiero ni ninguna otra recomendación de ningún tipo ofrecida o respaldada por Gate.