Date: Sat, Dec 20 2025 | 07:20 AM GMT
The broader cryptocurrency market has been stuck in a choppy and fragile phase over the past several weeks, a trend that started after the sharp sell-off on October 10. That correction dragged Ethereum (ETH) down by nearly 26% over the last 60 days and kept sustained pressure on most major altcoins. Avalanche (AVAX) has been no exception to this move, remaining firmly under bearish control for much of the period.
AVAX has declined by more than 37% over the past two months, reflecting persistent selling pressure and weak sentiment. However, a closer look at the chart suggests that price action may be transitioning into a more constructive phase. While the short-term trend is still negative, the broader structure is beginning to resemble a potential reversal setup that traders often associate with market bottoms.
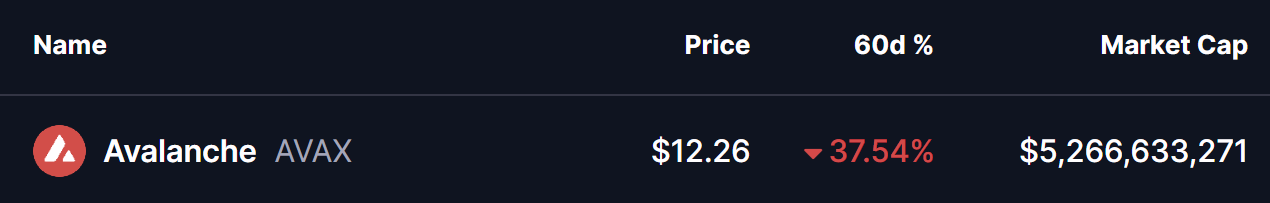
Source: Coinmarketcap
Power of 3 Structure Begins to Take Shape
On the higher-timeframe chart, AVAX appears to be developing a classic Power of 3 formation. This structure typically unfolds in three distinct stages: accumulation, manipulation, and expansion. When it appears near extended downtrends, it can sometimes hint that a larger directional move is approaching.
Earlier in the year, AVAX spent a prolonged period moving sideways within a clearly defined range. Price oscillated between resistance near the $14.82 area and support around $12.74, as highlighted by the gray consolidation zone on the chart. This phase reflected accumulation, where volatility compressed and directional conviction faded. Such conditions often emerge when selling pressure slows and longer-term participants quietly position while retail interest remains subdued.
That calm phase eventually gave way to a sharp breakdown. As broader market weakness intensified, AVAX lost the $12.74 support and slid aggressively lower, reaching a recent low near $11.26. This sudden drop aligns closely with the manipulation phase of the Power of 3 pattern. Moves like this are often marked by heightened fear, stop-loss hunting, and forced liquidations, pushing sentiment to pessimistic extremes.
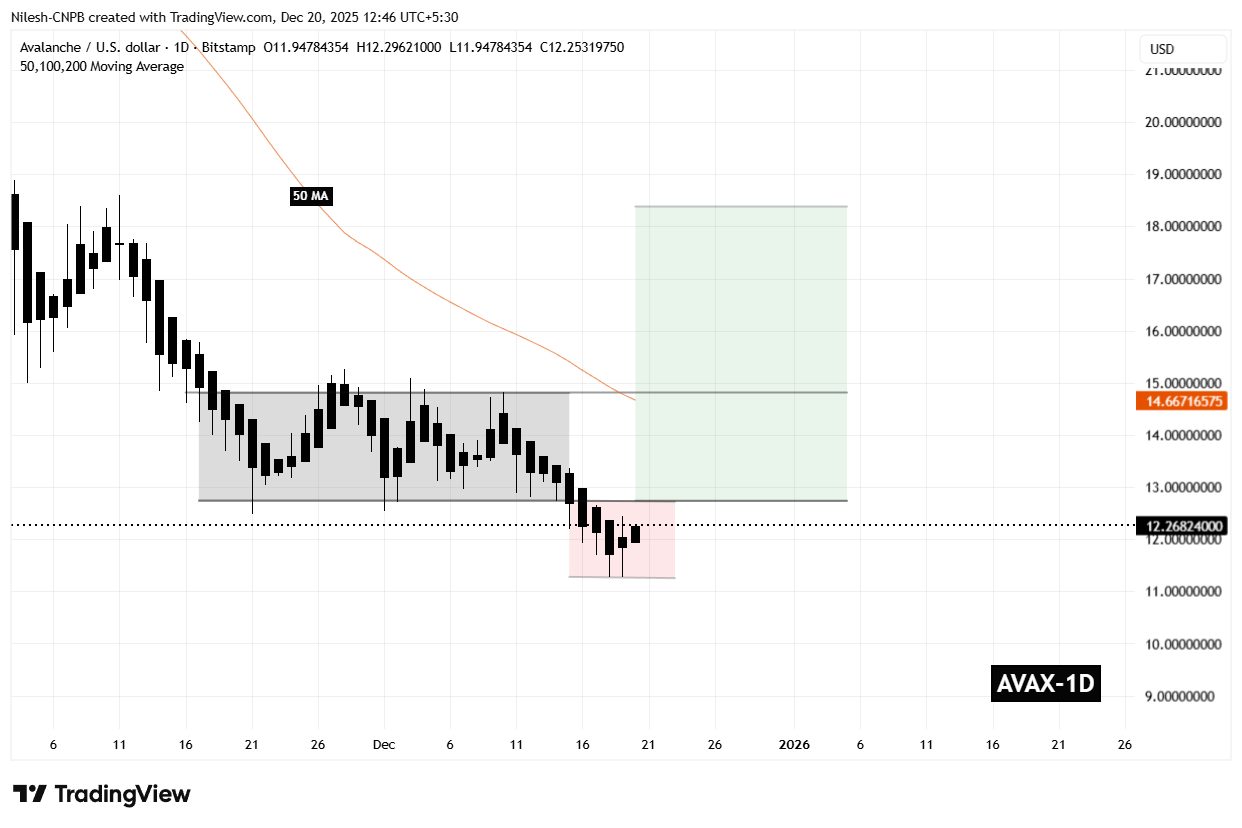
Avalanche (AVAX) Daily Chart/Coinsprobe (Source: Tradingview)
Importantly, downside momentum has started to cool near this lower region. Recent candles show tighter ranges and reduced follow-through, suggesting that selling pressure may be losing strength. This stabilization does not confirm a reversal on its own, but it does indicate that the market may be searching for a base.
What’s Next for AVAX?
At present, AVAX remains trapped near the lower boundary of its recent range, with price hovering around the $12 zone. A period of consolidation at these levels would be consistent with the transition phase that often follows sharp breakdowns. Bulls will need to see clear evidence of strength before confidence can return.
For a bullish reversal narrative to gain credibility, AVAX must reclaim the $12.74 level. A sustained move back above this former support would signal that price has re-entered the prior accumulation range, increasing the probability that the manipulation phase has run its course. From there, a breakout above the $14.82 resistance would mark a shift into the expansion phase of the Power of 3 structure, where upside momentum can accelerate rapidly.
If that breakout occurs, the chart projection points toward the $18.38 region as a potential upside objective. This zone aligns with previous structural resistance and represents a meaningful recovery from current levels.
That said, the setup remains highly conditional. As long as AVAX continues to trade below $12.74, downside risks remain on the table, and further volatility cannot be ruled out. Holding the recent lows and reclaiming key resistance levels will be crucial for bulls looking to confirm that a broader trend reversal is underway.
Disclaimer: The views and analysis presented in this article are for informational purposes only and reflect the author’s perspective, not financial advice. Technical patterns and indicators discussed are subject to market volatility and may or may not yield the anticipated results. Investors are advised to exercise caution, conduct independent research, and make decisions aligned with their individual risk tolerance.
Disclaimer: The information on this page may come from third parties and does not represent the views or opinions of Gate. The content displayed on this page is for reference only and does not constitute any financial, investment, or legal advice. Gate does not guarantee the accuracy or completeness of the information and shall not be liable for any losses arising from the use of this information. Virtual asset investments carry high risks and are subject to significant price volatility. You may lose all of your invested principal. Please fully understand the relevant risks and make prudent decisions based on your own financial situation and risk tolerance. For details, please refer to
Disclaimer.
Related Articles
Bit Digital CEO: Ethereum has stabilized in the $1800–$2100 range, and the recent pullback is more like a "value reset"
Bit Digital CEO Sam Tabar stated that recent Ethereum market conditions resemble a "value reset," with market leverage rapidly re-evaluating after a significant increase, leading to increased volatility. Currently, the price remains stable in the $1800 to $2100 range, with fundamentals unchanged. This event demonstrates how leverage can distort the market, but Ethereum's long-term value remains solid.
GateNews33m ago
Crypto and Finance Experts Draw Attention to Business Cycle, Expect Explosive Crypto Price Action
Crypto and finance experts draw attention to business cycle.
Experts expect explosive crypto price action soon.
The price of BTC could dip further, but long-term looks highly bullish.
The current state of the crypto market seems to be heading towards a bullish setup. Over the last few m
CryptoNewsLand1h ago
BTC short-term decline of 0.76%: key price levels encountering resistance and long leverage liquidations triggering market sell-off
On March 5, 2026, from 14:30 to 14:45 (UTC), Bitcoin (BTC) experienced a short-term decline, with a return of -0.76%. The price ranged between 71,958.3 and 72,830.0 USDT, with an amplitude of 1.20%. Market attention significantly increased, and during the event window, trading volume expanded, volatility intensified, and price anomalies attracted many investors' focus on short-term risks and future trends.
The main driver of this anomaly was BTC encountering resistance in the key price zone of $73,750–$74,400. Historical data shows that this zone has repeatedly acted as a...
GateNews1h ago
Bitcoin: Real-Time Sentiment Gauge for Weekend Warmongering
The article analyzes Bitcoin's real-time sentiment as a gauge during weekend market fluctuations, emphasizing its role in reflecting broader economic trends and investor behavior in the crypto landscape.
CryptoBreaking1h ago
Ripple CTO Emeritus Shares Candid Truth about XRP and Crypto Market - U.Today
David Schwartz, former Ripple CTO, expressed mixed feelings about XRP's performance, reflecting broader crypto market sentiment. Despite recent struggles for altcoins, XRP showed signs of a potential recovery with a newly formed "golden cross" on its price chart, although market conditions remain cautious.
UToday1h ago
When the Asia-Pacific stock markets hit the circuit breaker, why does Bitcoin stand out as the best?
Author: Jae, PANews
On March 4th, as the situation in the Middle East suddenly worsened, global financial markets instantly entered a "wartime state." For global investors, this was a trading day worthy of being recorded in history.
Disruption of shipping through the Strait of Hormuz, a critical energy choke point, triggered a sharp surge in international oil prices. Panic quickly swept through traditional capital markets, and Asia-Pacific stock markets experienced an epic sell-off.
KOSPI in South Korea plummeted 12% in a single day, marking the largest decline in history; the Nikkei 225 dropped 3.7%, its worst performance in five months; Middle Eastern local stock markets once tumbled nearly 5% amid a correction; major European and American stock indices closed lower across the board.
However, an unusual phenomenon quietly emerged amid this sell-off.
The crypto market, often regarded as "high risk, high volatility," which tends to be the first asset class to collapse during any geopolitical crisis, surprisingly held steady this time.
Bitcoin experienced a brief panic
区块客2h ago

