The fractal model predicts Bitcoin will drop to $45,000 by 2026
The world’s largest cryptocurrency has undergone a significant correction, plunging from the all-time high of (ATH) $126,000 down below the important psychological threshold of $100,000 — a level Bitcoin only first conquered about a year ago. Currently, Bitcoin’s price is fluctuating around $87,000, reflecting a cautious market sentiment. Many technical indicators suggest that upward momentum is weakening, while the risk of further deeper corrections on the price chart has not been ruled out.
Fractal pattern suggests deeper decline
Based on Bitcoin’s (Bitcoin Repeating Cycle) indicator — a tool that has repeatedly tracked market ups and downs — Bitcoin is said to have officially entered a weakening phase.
This pattern previously accurately identified the market peak on 10/10 and correctly forecasted the subsequent correction. From current signals, the bearish scenario could extend until around 10/16/2026.
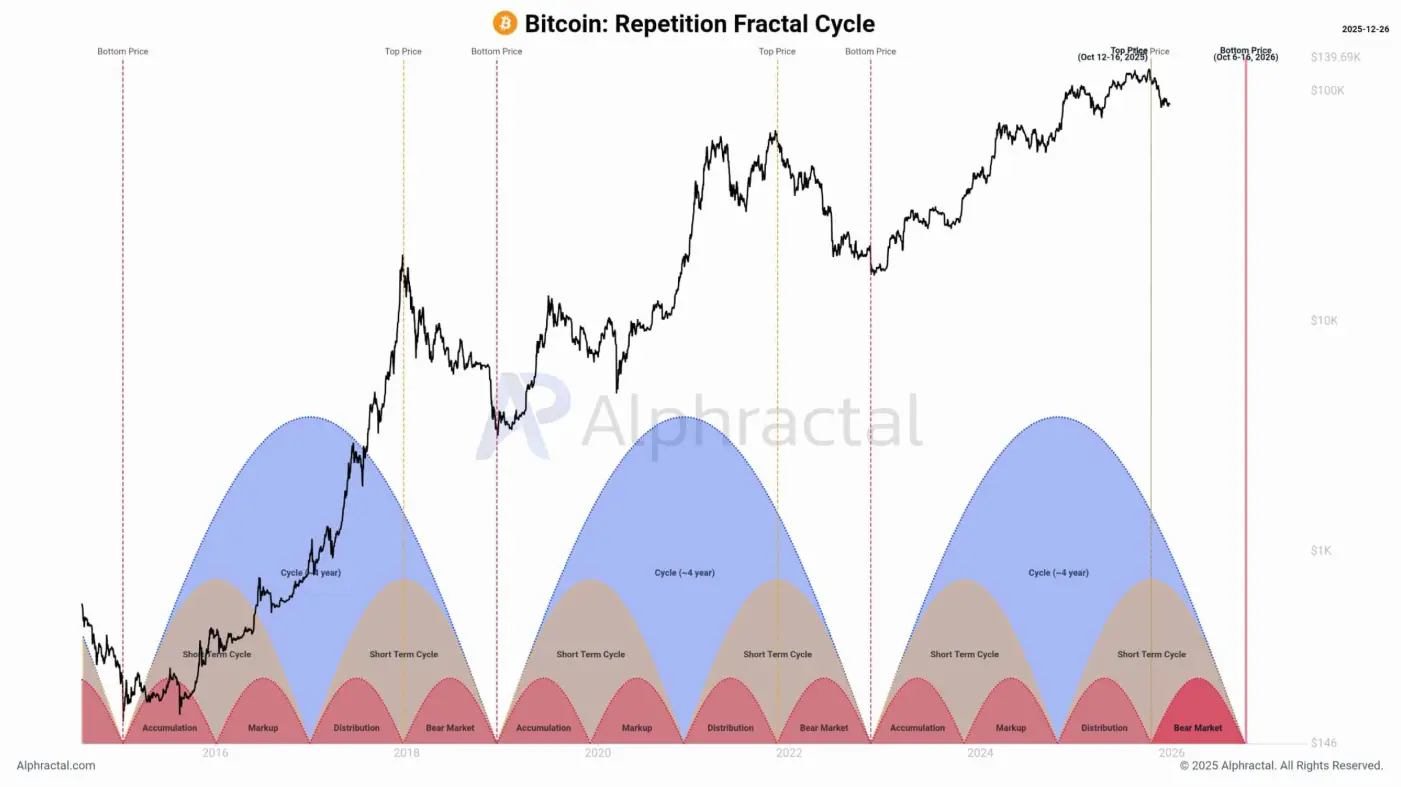 Bitcoin Cycle Fractal | Source: Alphractal According to analyst João Wedson, the fractal pattern indicates Bitcoin’s potential bottom range is between $40,000 and $45,000. However, he emphasizes:
“This is not a rigid formula or a deterministic price forecast. The pattern reflects fractal similarities across market cycles — a characteristic that Bitcoin tends to follow more often than break.”
Nevertheless, this downward scenario remains a topic of debate. Many experts believe that Bitcoin’s four-year cycle — once considered the core driver of major volatility — is weakening significantly, even showing signs of losing its dominant role.
Historical context – Small correction or major cycle?
Bitcoin’s current behavior (BTC) shows many similarities to the 2021 cycle when viewed within the four-year model framework. However, historical data also reveals a crucial difference that investors cannot ignore.
Throughout Bitcoin’s history of formation and development, typical correction levels have usually been around 35%. The 2021 bear market was a notable exception, representing a large cycle correction that caused Bitcoin’s price to drop by 77% from the peak of $69,000.
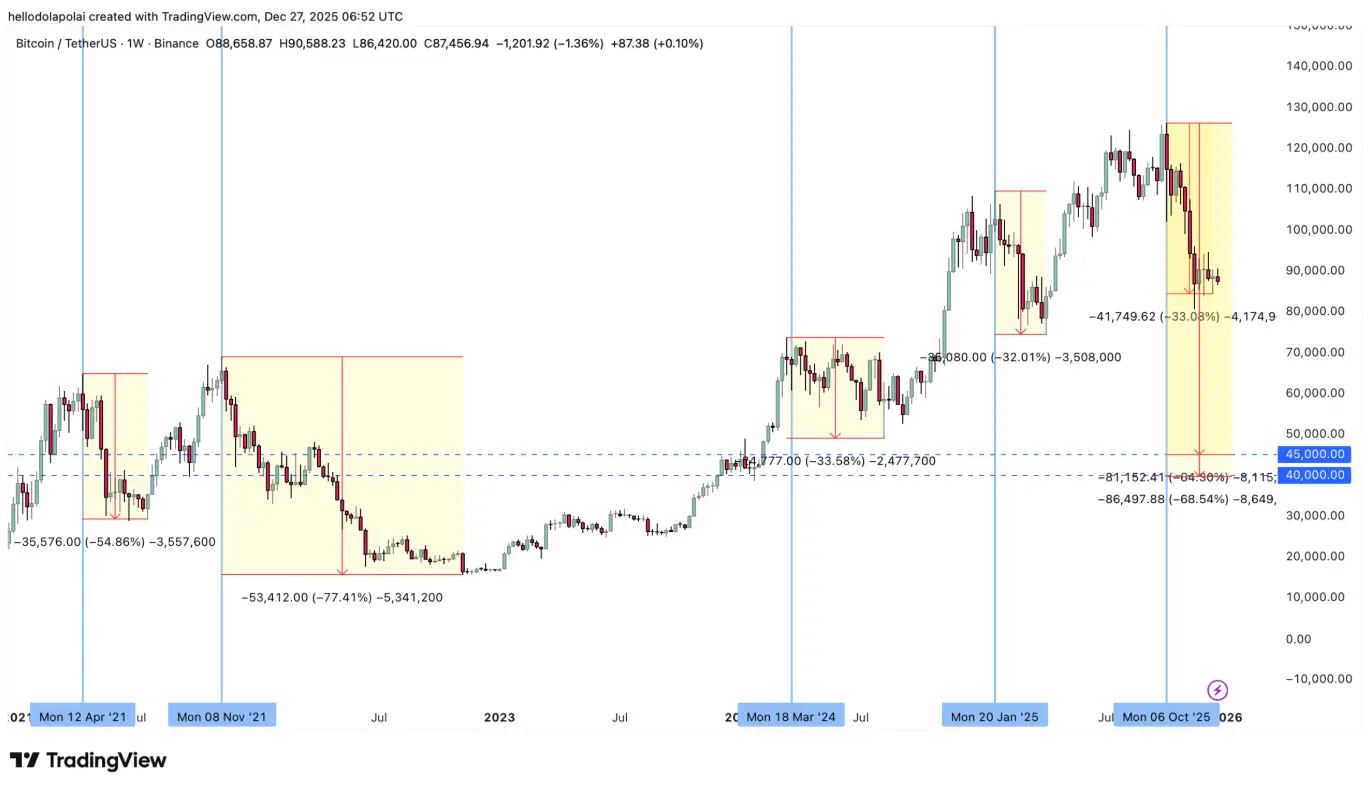 Weekly BTC/USDT chart | Source: TradingView Currently, Bitcoin has decreased by about 32% from the $126,000 zone — a correction still within the typical range of small adjustments. This suggests that the price may be gradually approaching its natural bottom zone.
However, in a worse-case scenario, if the fractal pattern continues to prove accurate and Bitcoin retreats to the $40,000–$45,000 range, the total decline could reach 64–68%. In that case, it would no longer be a short-term correction but a true large cycle correction.
Why this time could be different
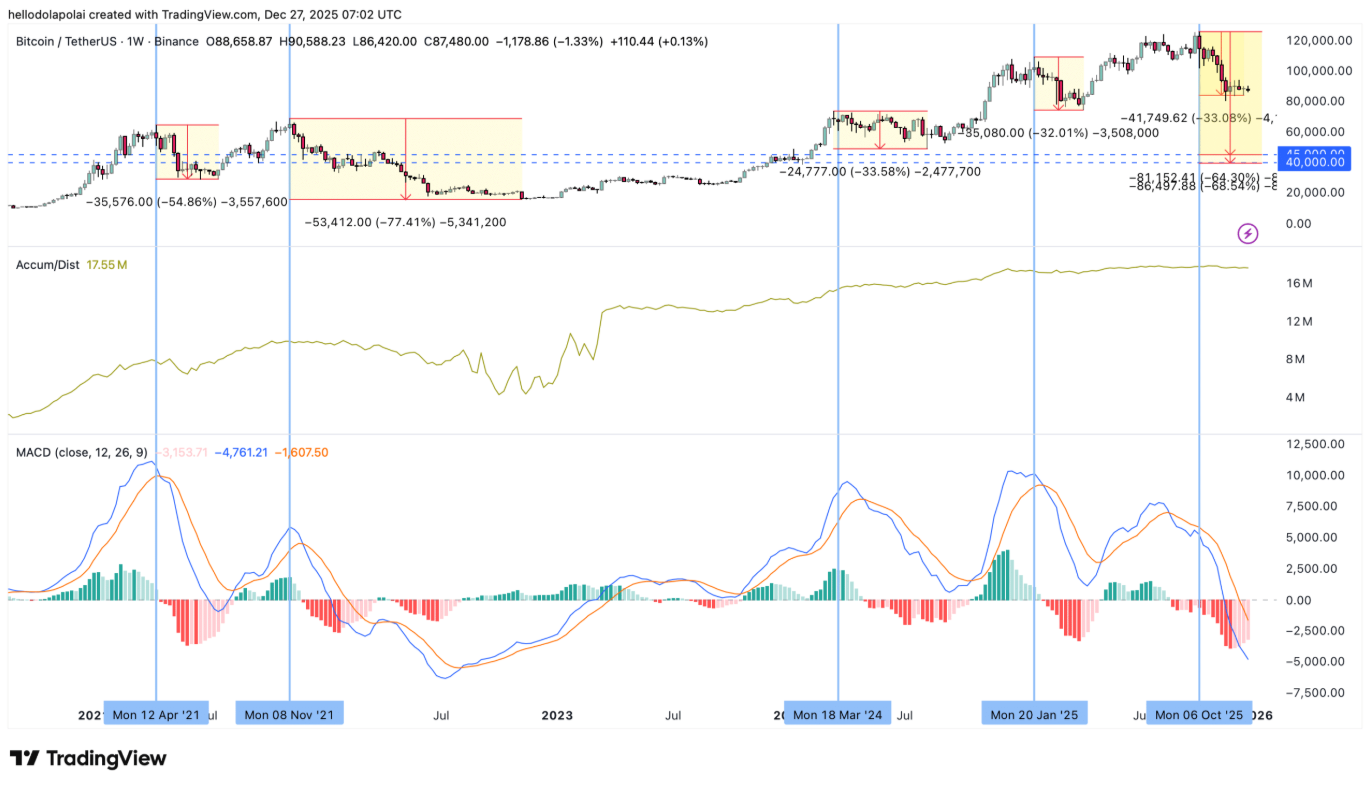
Key off-chain indicators suggest that a severe short-term volatility scenario is unlikely. Specifically, the (Accumulation/Distribution (A/D)) trend currently shows no signs of a major sell-off.
Looking back to 2021, Bitcoin’s sharp correction coincided with clear distribution, as off-chain volume dropped sharply from 9.8 million BTC to about 4 million BTC. Conversely, at present, this volume has remained nearly flat, decreasing slightly from 17.63 million BTC to 17.52 million BTC — a level of fluctuation insufficient to confirm a withdrawal of large capital.
Differences from institutional players
Since 2021, the global economic landscape has experienced profound changes, especially with the increasing role of institutions and governments in the cryptocurrency market. Bitcoin’s popularity has been further reinforced by the launch and approval of spot Bitcoin ETFs in major financial centers like the US and Hong Kong.
Just the capital inflow from US institutions has reached approximately $116.58 billion, while the global M2 money supply has expanded to nearly $147 trillion. History shows that when such abundant capital flows occur, they tend to seek risk assets — which can serve as a strong catalyst, supporting Bitcoin’s recovery and challenging bearish fractal-based predictions.
Related Articles
AI Models Overwhelmingly Choose Bitcoin as Preferred Monetary Instrument
UK reviews cryptocurrency gambling payments to promote legal digital asset betting and consumer protection
AI Study Picks Bitcoin as the “Best Money” as BTC Price Structure Signals Higher Levels
Analyst: The current market's significant deleveraging has reduced the likelihood of a sharp decline, but at the same time, it limits the potential for upward short squeezes.
Bear Market Script: Which Scene Is Your "Faith" Going Through?
Data: 66 BTC transferred from an anonymous address, routed through a relay, and then flowed into Cumberland DRW