
**Date: **Tue, Jan 06, 2026 | 11:20 AM GMT
The broader cryptocurrency market continues to show renewed strength as 2026 gets underway. Bitcoin (BTC) is up around 6% on the week, while Ethereum (ETH) has posted gains of over 8%, helping improve overall sentiment across the market. This positive momentum is now spreading into major altcoins — including** Algorand (ALGO).**
ALGO has already delivered a strong 22% weekly gain, but the more important development is unfolding beneath the surface. Recent price action suggests a clear structural shift is taking place, one that could mark the early stages of a sustained bullish continuation if a critical resistance zone is decisively cleared.
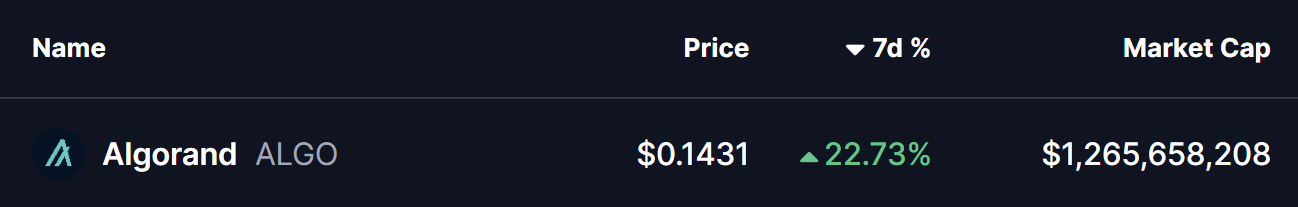
Source: Coinmarketcap
Right-Angled Descending Broadening Pattern in Play
On the 4-hour timeframe, ALGO had been trading inside a right-angled descending broadening formation — a bullish reversal structure defined by a flat overhead resistance and a rising lower boundary. For several weeks, price struggled to overcome the $0.1340–$0.1486 resistance band, with each rejection keeping ALGO locked in consolidation.
The recent rebound from the lower boundary of the structure marked a key turning point. Buyers stepped in aggressively, allowing ALGO to reclaim the 200-period moving average around $0.1225 — a level that had previously acted as dynamic resistance. This reclaim signaled improving momentum and a shift in short-term trend control.
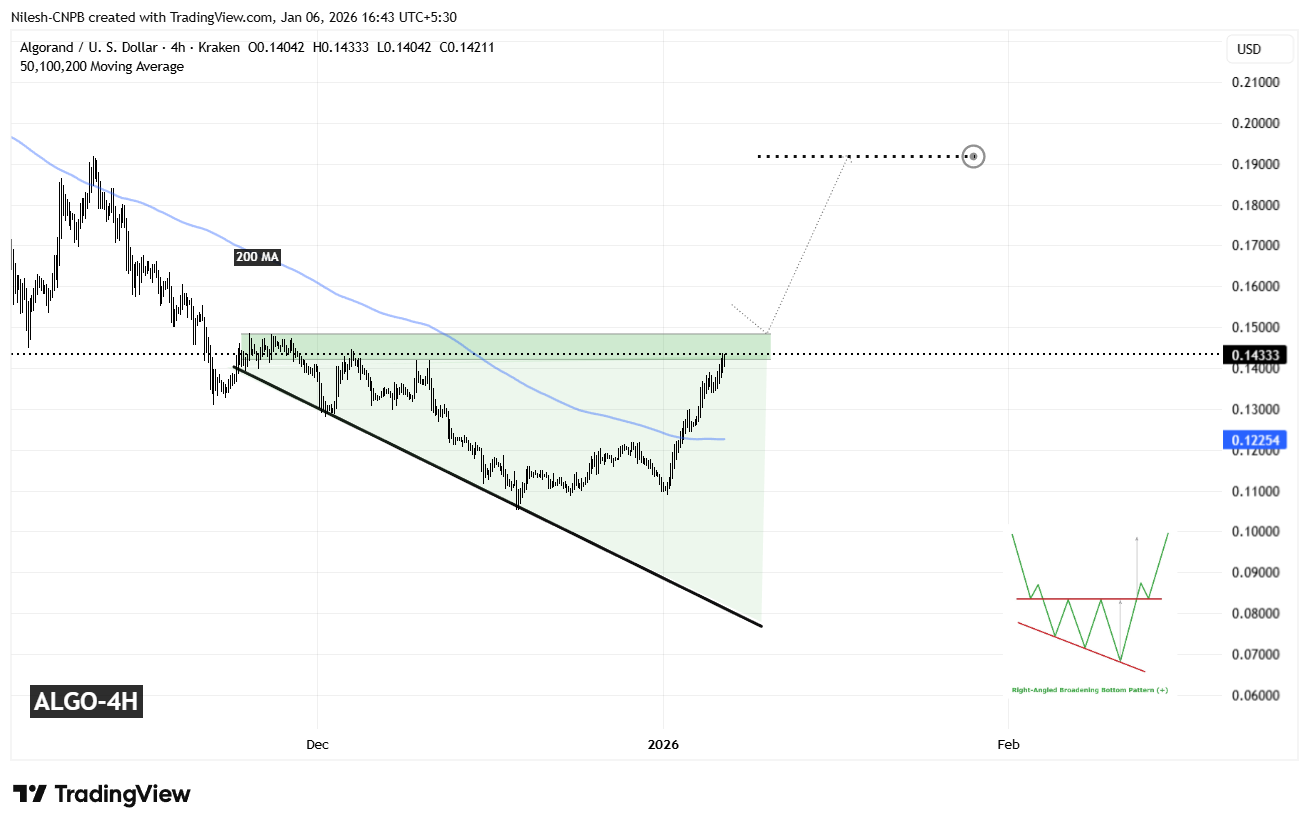
Algorand (ALGO) 4H Chart/Coinsprobe (Source: Tradingview)
Since then, ALGO has continued to push higher and is now pressing back into the same resistance zone that capped upside attempts in the past. This return to resistance places price at a critical inflection point where the broader trend direction could soon be decided.
What’s Next for ALGO?
A decisive close above the $0.1340–$0.1486 resistance zone would confirm a breakout from the descending broadening structure and validate the broader bullish reversal setup. Acceptance above this zone could attract fresh momentum participation and open the door to a stronger expansion phase.
Based on the depth of the formation and the projected measured move, the upside target points toward the $0.1920 region. Reaching that level would imply a potential upside of roughly 33% from current prices, aligning well with the typical behavior seen following successful breakouts from this pattern.
That said, patience remains important. Before any confirmed breakout, ALGO could still see short-term pullbacks — including a retest of the 200-period moving average, which has now turned into dynamic support. Such pullbacks would not invalidate the bullish setup as long as price continues to hold higher-low structures.
Until a clear breakout and follow-through occur, traders may want to remain cautious and avoid chasing price. The $0.1340–$0.1486 zone remains the key decision area that will determine whether Algorand transitions into a sustained bullish phase or continues consolidating as the new year unfolds.
Disclaimer: The views and analysis presented in this article are for informational purposes only and reflect the author’s perspective, not financial advice. Technical patterns and indicators discussed are subject to market volatility and may or may not yield the anticipated results. Investors are advised to exercise caution, conduct independent research, and make decisions aligned with their individual risk tolerance.
About Author: Nilesh Hembade is the Founder and Lead Author of Coinsprobe, with over 5 years of experience in the cryptocurrency and blockchain industry. Since launching Coinsprobe in 2023, he has been providing daily, research-driven insights through in-depth market analysis, on-chain data, and technical research.
Disclaimer: The information on this page may come from third parties and does not represent the views or opinions of Gate. The content displayed on this page is for reference only and does not constitute any financial, investment, or legal advice. Gate does not guarantee the accuracy or completeness of the information and shall not be liable for any losses arising from the use of this information. Virtual asset investments carry high risks and are subject to significant price volatility. You may lose all of your invested principal. Please fully understand the relevant risks and make prudent decisions based on your own financial situation and risk tolerance. For details, please refer to
Disclaimer.
Related Articles
Bitcoin drops to $70,600, Ethereum holds at 2,055. Analysts: Bull market score is only 10; don't put too much faith in this rebound.
Bitcoin has recently continued to hit new lows, currently trading at $70,923, and CryptoQuant has warned that the recent rebound is only a short-term rally in a bear market, with a bull market score of only 10 points. The US stock market has declined across the board, and the crypto market is also under pressure. The future trend depends on whether spot demand turns positive. There are multiple scenarios in the market, including possible sideways consolidation or a drop to the $56,000-$60,000 support zone. Ethereum has shown relative strength in this wave of market movement, but if Bitcoin continues to decline, its support levels will need to be observed.
動區BlockTempo14m ago
Bitcoin Reclaims $70K As ETF Flows Stabilize and Selling Pressure Eases
Glassnode reports that Bitcoin's ETF flows are stabilizing after outflows, coinciding with a price rebound above $70,000. Healthy inflows into ETFs indicate a cautious optimism among institutions, but macro risks persist, necessitating continued monitoring of market trends.
BlockChainReporter25m ago
Culper Research announces short positions on ETH and related securities, claiming that Fusaka's upgraded token economic model has been damaged
Short-selling firm Culper Research announced that it is shorting Ethereum and related securities, believing that the Fusaka upgrade in 2025 will harm the ETH tokenomics model. The upgrade resulted in a larger-than-expected decrease in Gas fees, and on-chain data shows that the growth in active addresses and transaction volume is driven by low-value transactions. Culper believes Vitalik is aware of this and will continue to sell ETH, expecting ETH prices to decline further.
GateNews26m ago
Why did Bitcoin drop today? The US warns of a ground invasion in Iran, and Trump demands to lead the next Supreme Leader.
Bitcoin prices fluctuate due to escalating geopolitical tensions, dropping from $72,000 to $70,000 on March 6. Trump's tough rhetoric on the Iran situation, Iran's refusal to cease fire, and the U.S. military announcing increased strikes have heightened risk aversion. Market sentiment is divided, with some predicting Bitcoin will reach $80,000, but some analysts remain skeptical about a rebound. $72,000 is a key technical level; failure to break above it could lead to a drop toward $64,000.
MarketWhisper37m ago
Today, the Fear and Greed Index dropped to 18, indicating the market is in a "Extreme Fear" state.
Foresight News reports that, according to Alternative.me data, the cryptocurrency Fear and Greed Index dropped to 18 today (yesterday the index was 22, indicating "Extreme Fear"), indicating that the market is in a "Extreme Fear" state.
GateNews59m ago
XRP Price Consolidates Under $1.5 — What Could Drive the Next Move to $2? - BTC Hunts
XRP is struggling to maintain its price above $1.40 amidst selling pressure and a bearish market. Key resistance at $1.48 and support at $1.33 will determine its next movement, with potential for upswing to $1.60 or a drop towards $1.20.
BTCHUNTS1h ago

