Pagar con
USD
Compra y venta
Hot
Compra y vende criptomonedas a travésde Apple Pay, tarjetas, Google Pay, transferencias bancarias y más
P2P
0 Fees
¡Cero tarifas, más de 400 opciones de pago y compra y venta de criptomonedas sin complicaciones!
Gate Card
Tarjeta de pago con criptomonedas que permite efectuar transacciones internacionales fácilmente
Básico
Spot
Opera con criptomonedas libremente
Margen
Multiplica tus beneficios con el apalancamiento
Convertir e Inversión automática
0 Fees
Opera cualquier volumen sin tarifas ni deslizamiento
ETF
Obtén exposición a posiciones apalancadas de forma sencilla
Premercado
Opera con nuevos tokens antes de que selisten oficialmente
Avanzado
DEX
Opera on-chain con Gate Wallet
Alpha
Puntos
Consigue tokens prometedores en operaciones on-chain simplificadas
Bots
Trading con un solo clic y estrategias inteligentes autoejecutables
Copiar
Join for $500
Haz crecer tu riqueza siguiendo a los traders top
Trading CrossEx
Beta
Un solo saldo de margen compartido entre plataformas
Futuros
Cientos de contratos liquidados en USDT o BTC
TradFi
Oro
Opera con activos tradicionales globales con USDT en un solo lugar
Opciones
Hot
Opera con opciones estándar al estilo europeo
Cuenta unificada
Maximiza la eficacia de tu capital
Trading de prueba
Comienzo del trading de futuros
Prepárate para operar con futuros
Eventos futuros
Participa en eventos para ganar generosas recompensas
Trading de prueba
Usa fondos virtuales para probar el trading sin asumir riesgos
Lanzamiento
CandyDrop
Acumula golosinas para ganar airdrops
Launchpool
Staking rápido, ¡gana nuevos tokens con potencial!
HODLer Airdrop
Holdea GT y consigue airdrops enormes gratis
Launchpad
Anticípate a los demás en el próximo gran proyecto de tokens
Puntos Alpha
¡Opera con activos on-chain y recibe recompensas por airdrop!
Puntos de futuros
Gana puntos de futuros y reclama recompensas de airdrop
Inversión
Simple Earn
Genera intereses con los tokens inactivos
Inversión automática
Invierte automáticamente de forma regular
Inversión dual
Compra a la baja y vende al alza para aprovechar las fluctuaciones de los precios
Staking flexible
Gana recompensas con el staking flexible
Préstamo de criptomonedas
0 Fees
Usa tu cripto como garantía y pide otra en préstamo
Centro de préstamos
Centro de préstamos integral
Centro de patrimonio VIP
La gestión patrimonial personalizada potencia el crecimiento de tus activos
Gestión patrimonial privada
Gestión de activos personalizada para hacer crecer sus activos digitales
Quant Fund
El mejor equipo de gestión de activos te ayuda a obtener beneficios sin complicaciones
Staking
Haz staking de criptomonedas para ganar en productos PoS
Apalancamiento inteligente
New
Sin liquidación forzosa antes del vencimiento, ganancias apalancadas sin preocupaciones
Acuñación de GUSD
Usa USDT/USDC para acuñar GUSD y obtener rendimientos a nivel tesorería
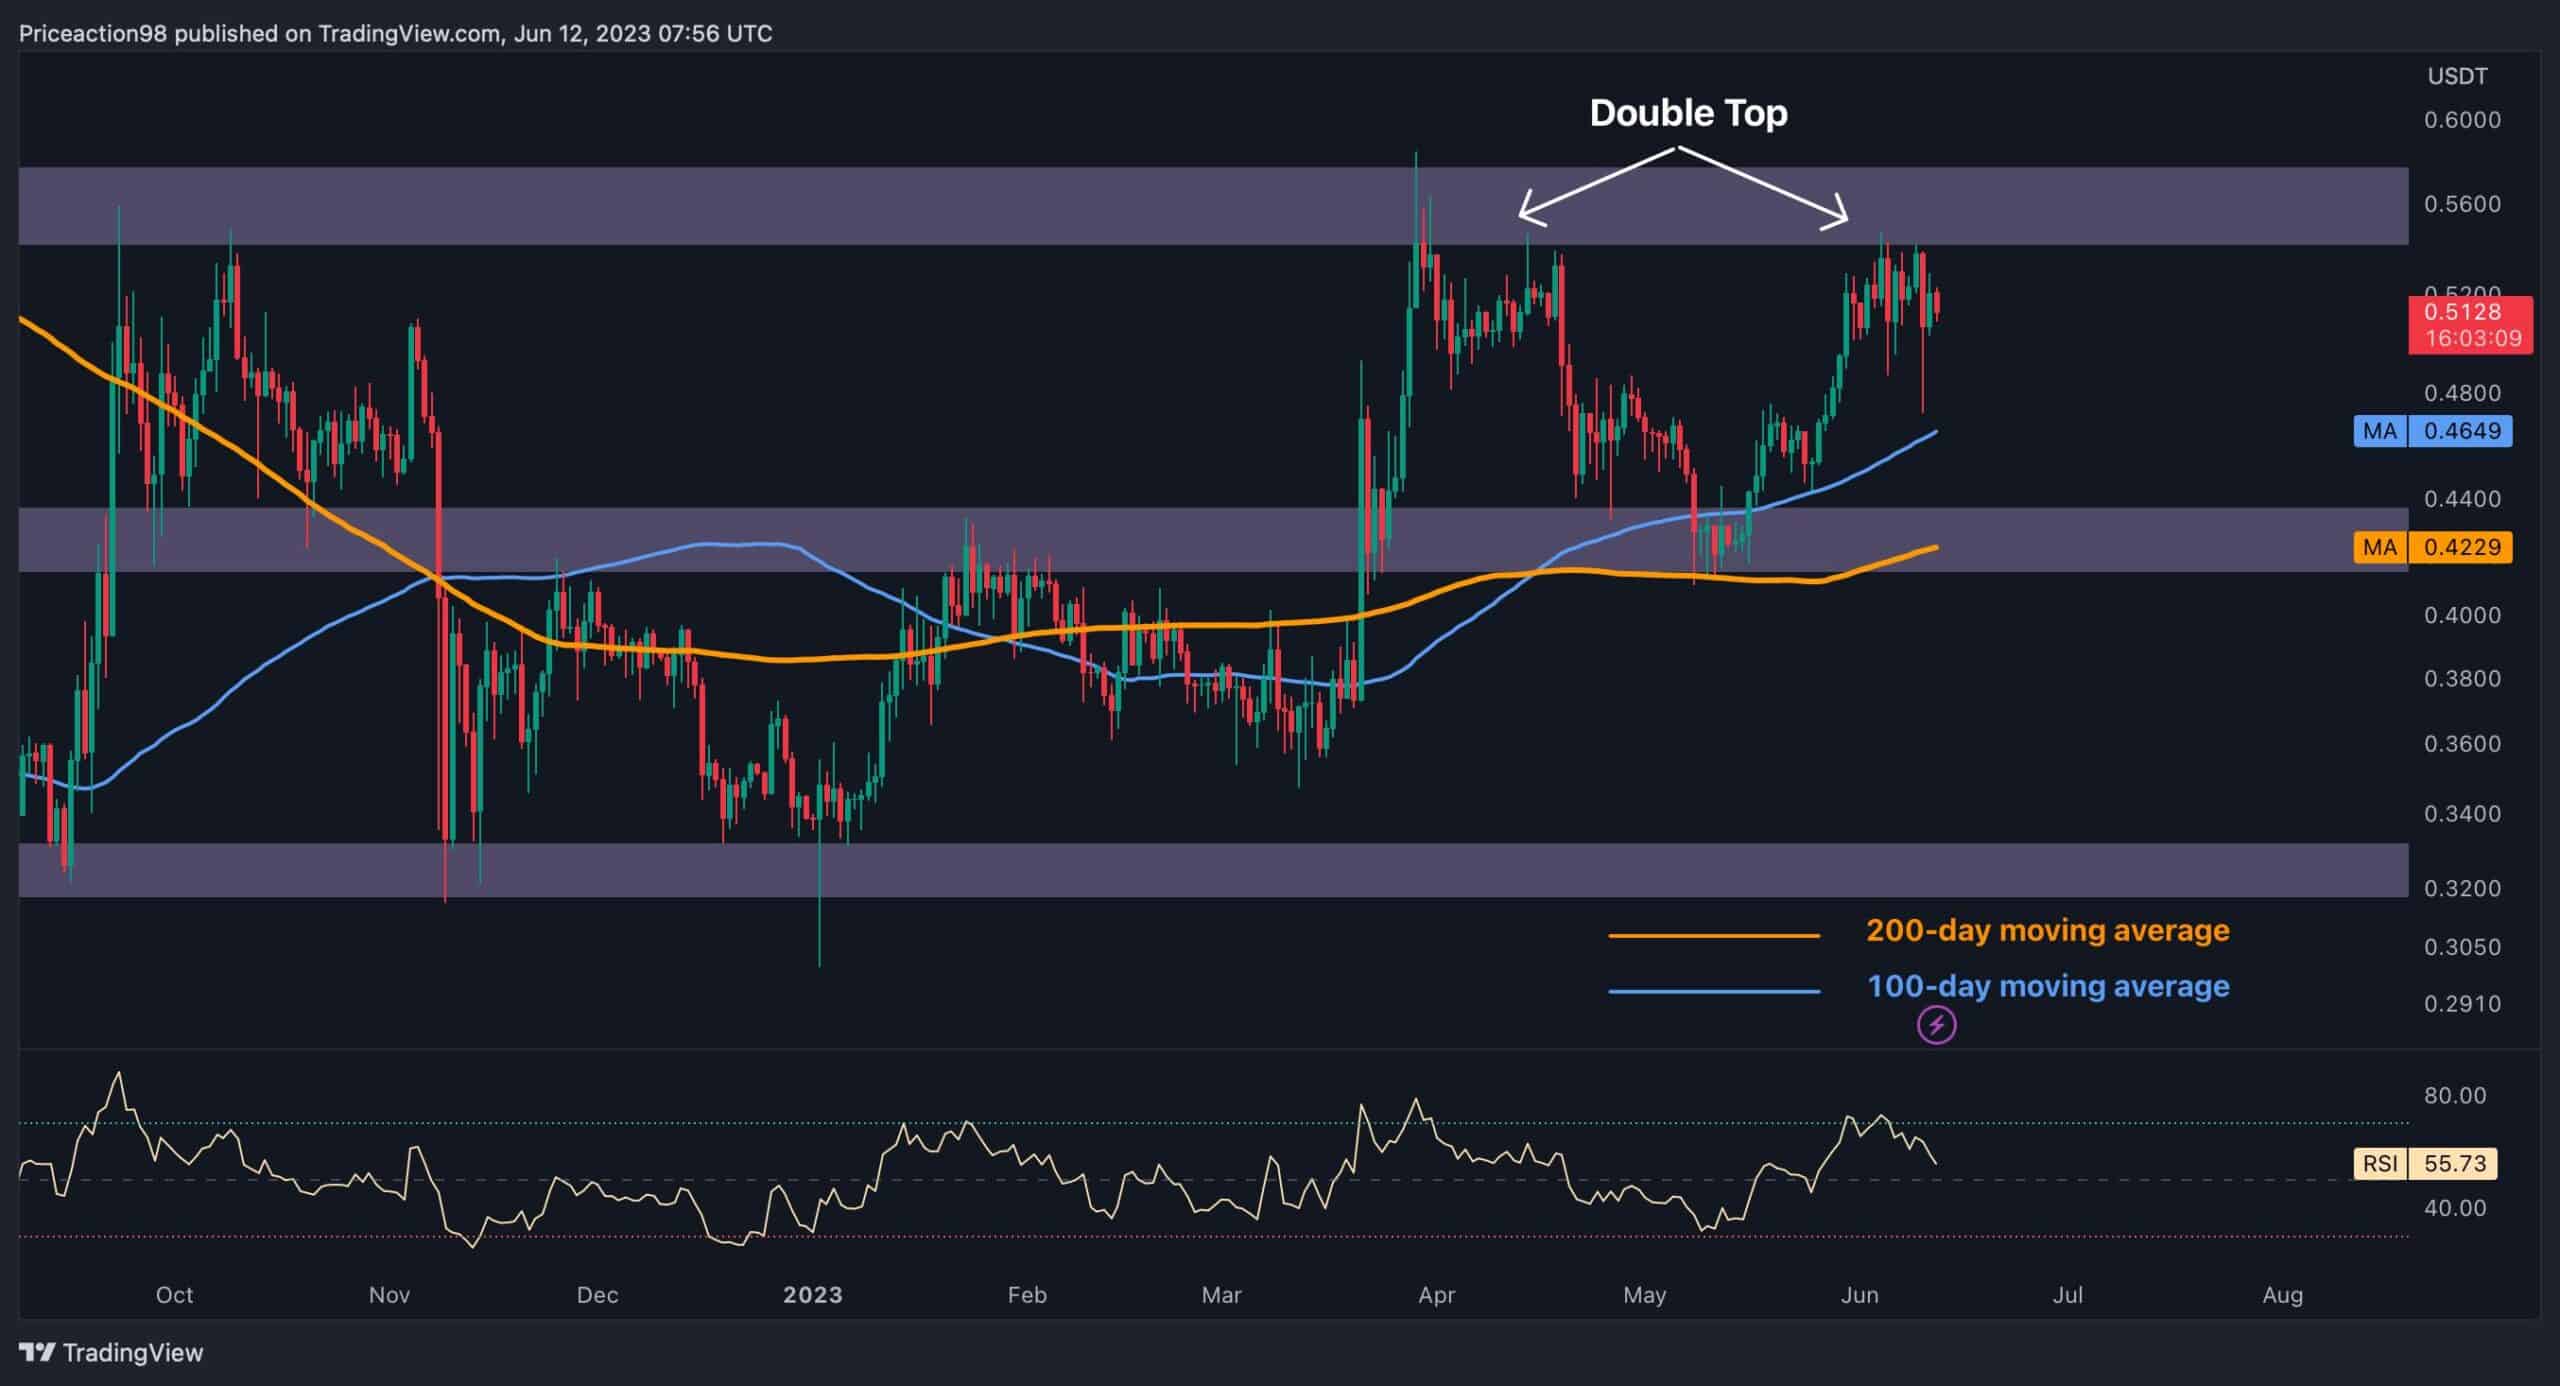 Source: TradingVIew### The 4-Hour Chart
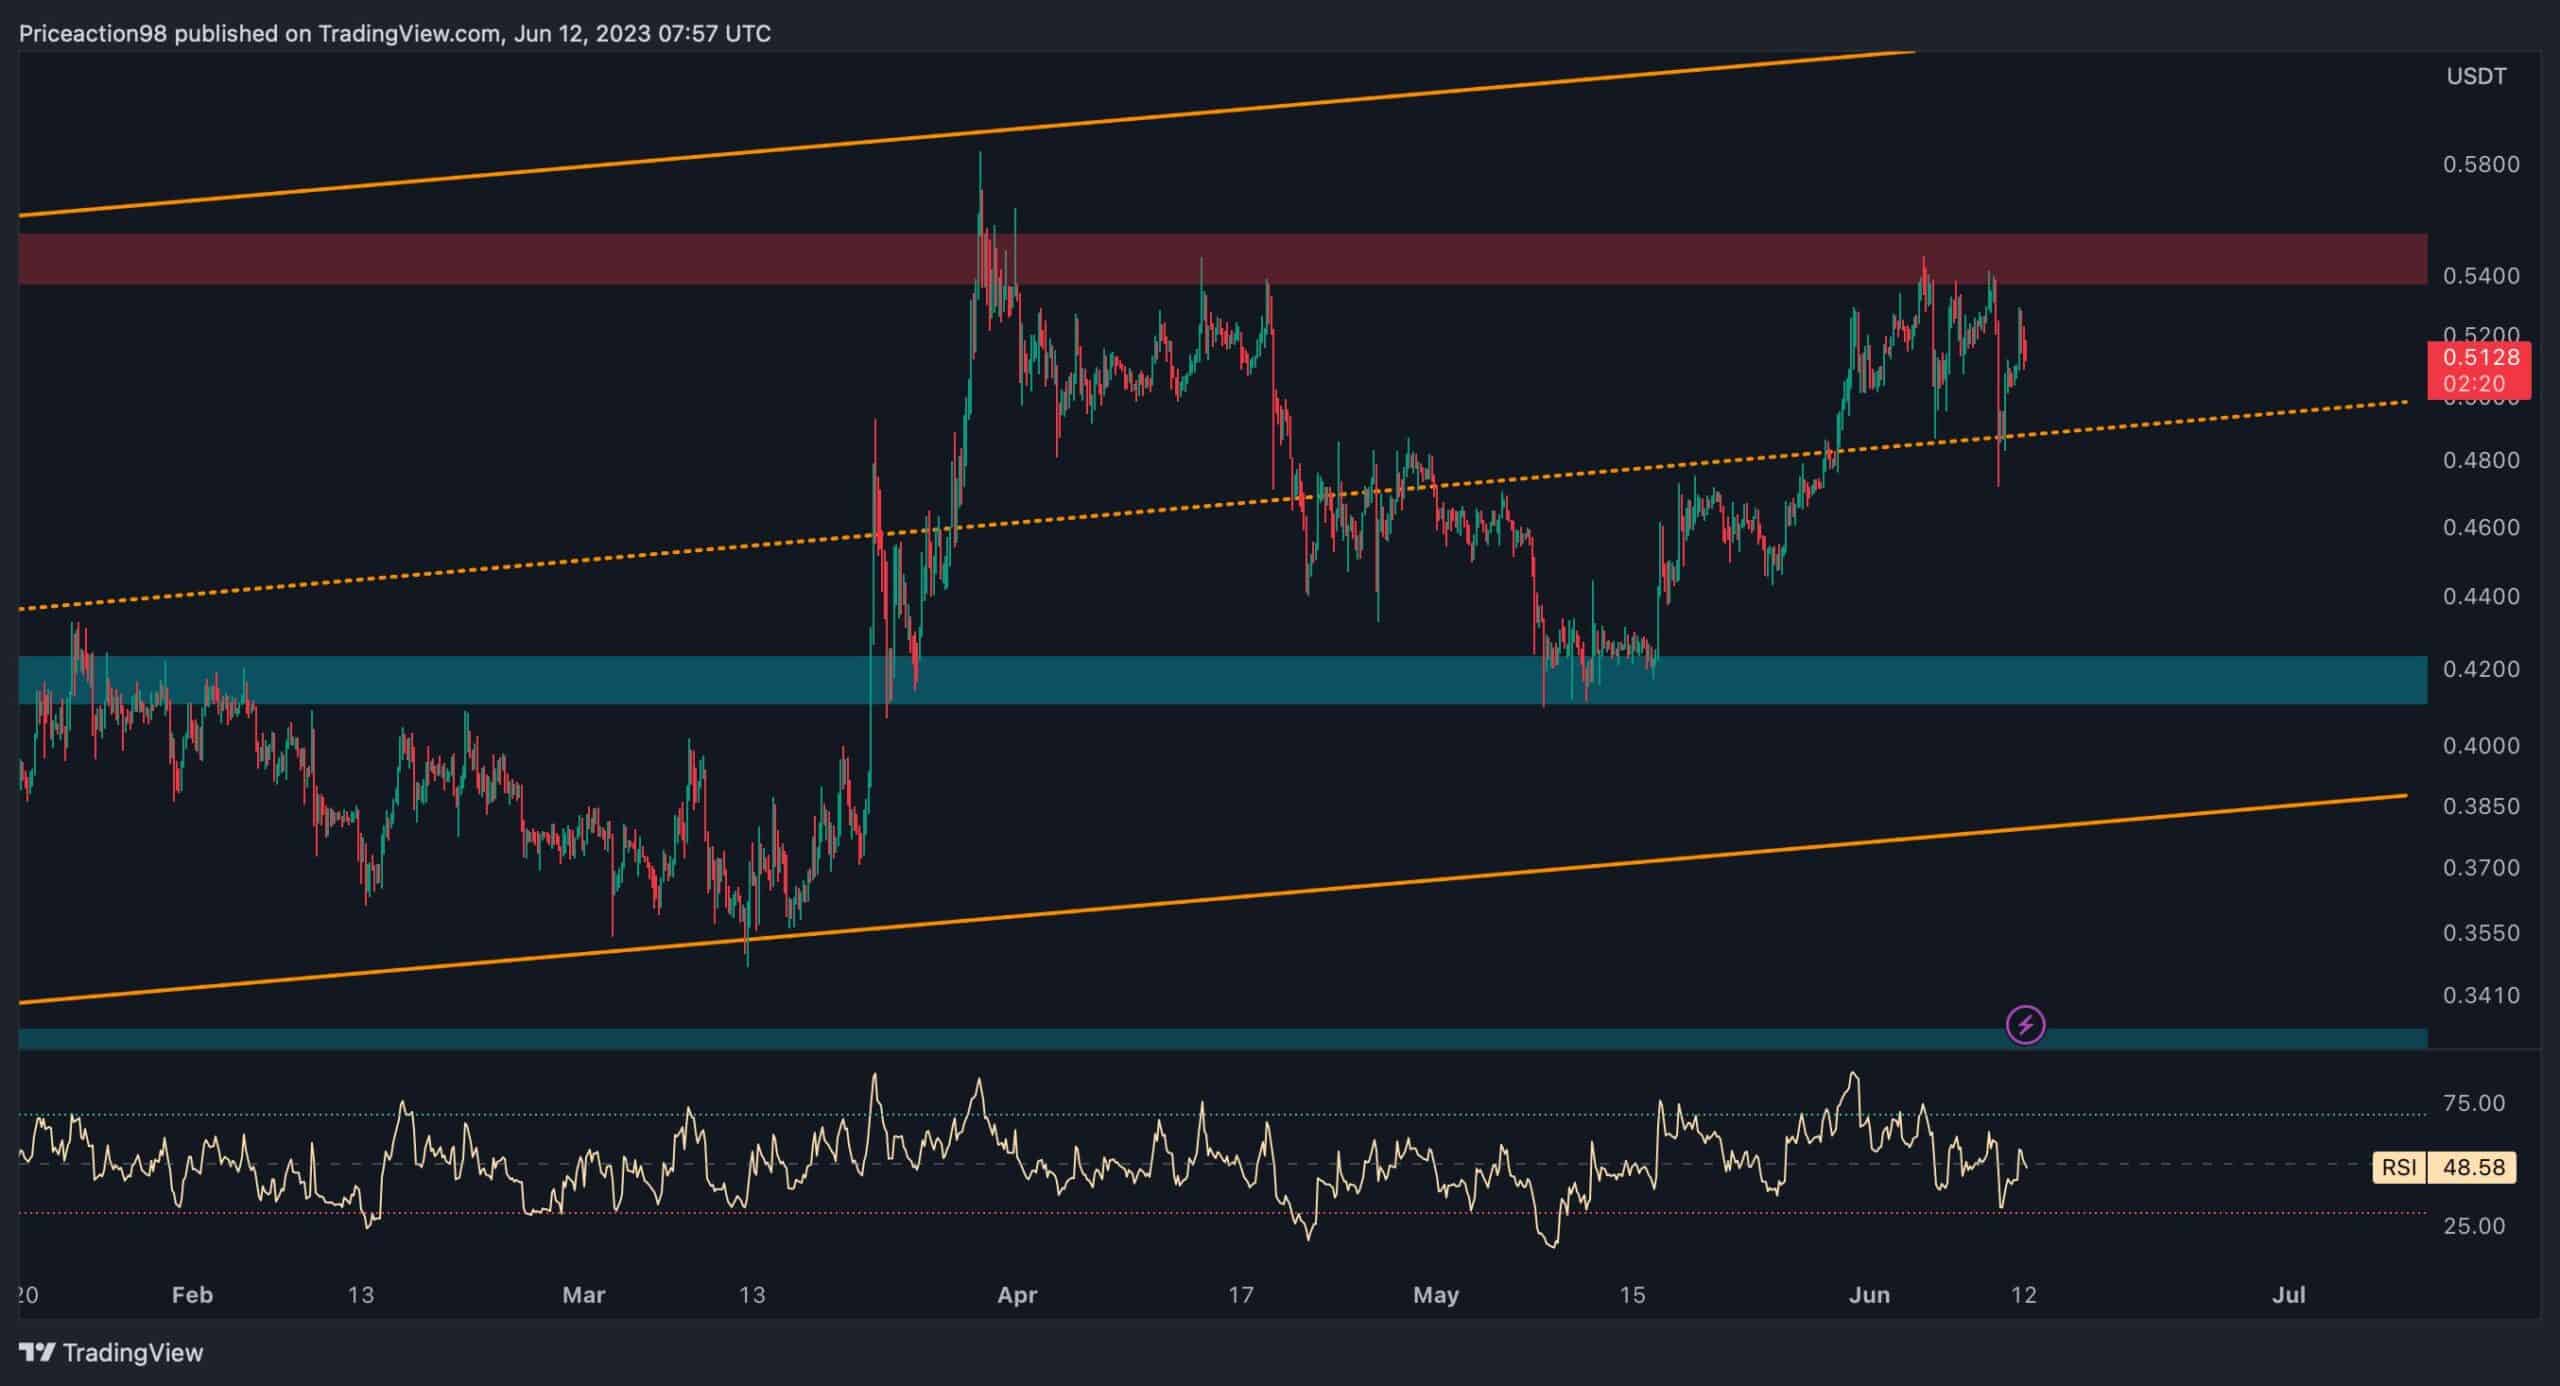 Source: TradingView