Trade
Basic
Futures
Futures
Hundreds of contracts settled in USDT or BTC
Options
HOT
Trade European-style vanilla options
Unified Account
Maximize your capital efficiency
Demo Trading
Futures Kickoff
Get prepared for your futures trading
Futures Events
Futures Mall
Participate in events to win generous rewards
Demo Trading
Use virtual funds to experience risk-free trading
Earn
Launch
CandyDrop
Collect candies to earn airdrops
Launchpool
Quick staking, earn potential new tokens
HODLer Airdrop
Hold GT and get massive airdrops for free
Launchpad
Be early to the next big token project
Alpha Points
NEW
Trade on-chain assets and enjoy airdrop rewards!
Futures Points
NEW
Earn futures points and claim airdrop rewards
Investment
Simple Earn
Earn interests with idle tokens
Auto-Invest
Auto-invest on a regular basis
Dual Investment
Buy low and sell high to take profits from price fluctuations
Soft Staking
Earn rewards with flexible staking
Crypto Loan
0 Fees
Pledge one crypto to borrow another
Lending Center
One-stop lending hub
VIP Wealth Hub
Customized wealth management empowers your assets growth
Private Wealth Management
Customized asset management to grow your digital assets
Quant Fund
Top asset management team helps you profit without hassle
Staking
Stake cryptos to earn in PoS products
Smart Leverage
NEW
No forced liquidation before maturity, worry-free leveraged gains
GUSD Minting
Use USDT/USDC to mint GUSD for treasury-level yields
More
Rmj_Trades
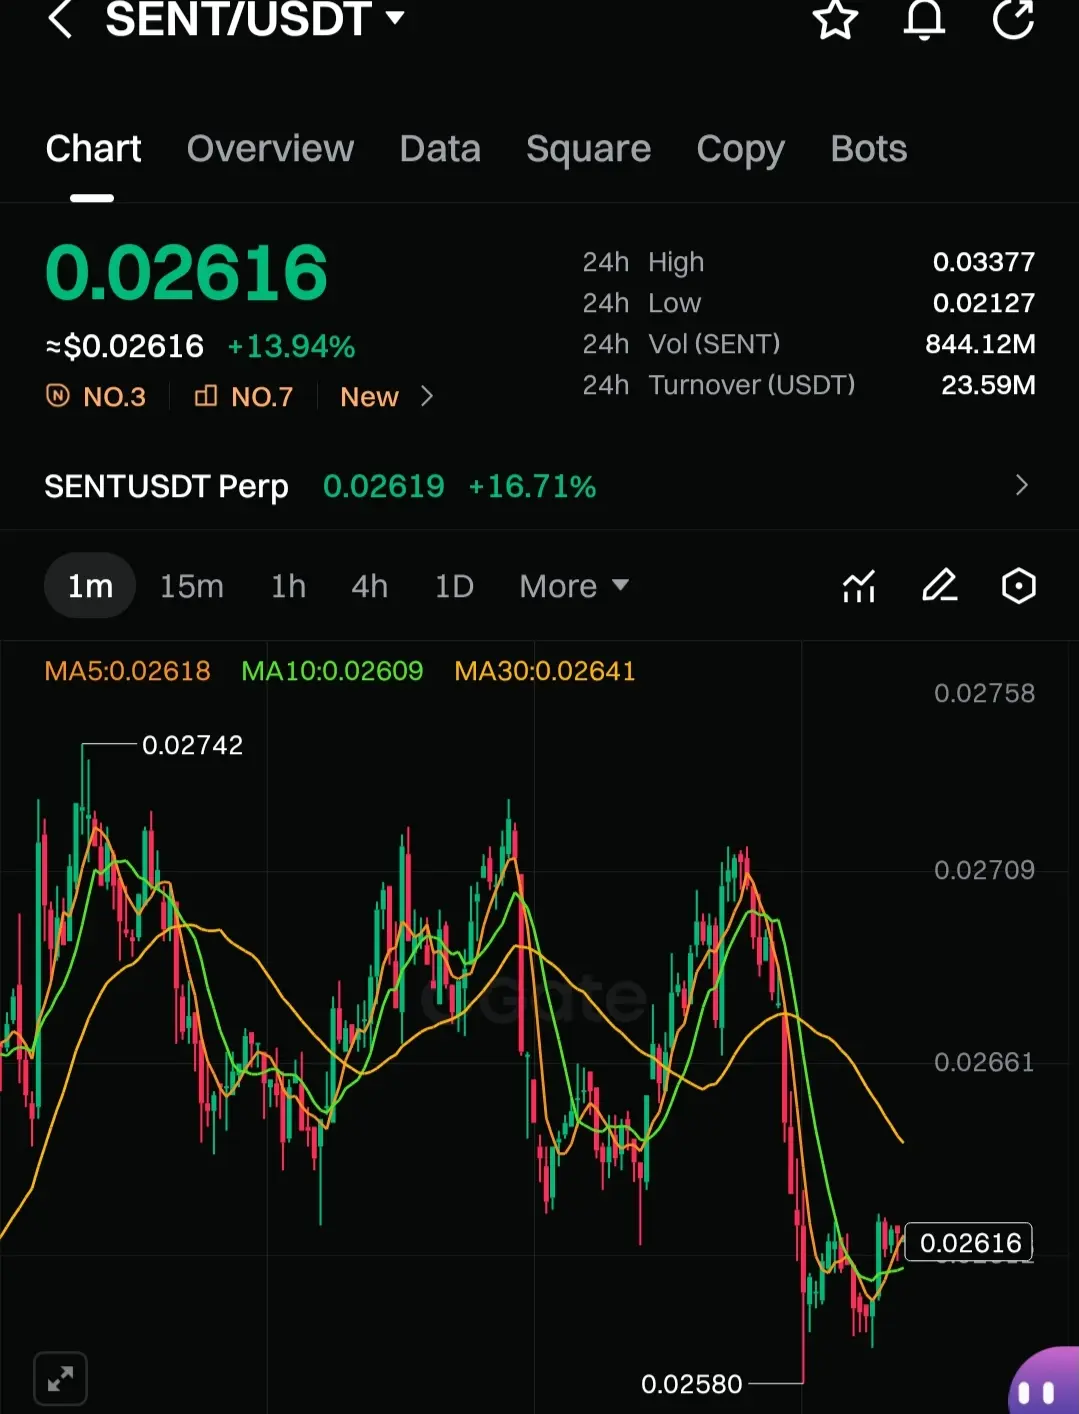
$SENT is buildin' up steam around 0.02758, lookin' good for a potential push higher.
Entry Zone: 0.02680 – 0.02758
TP 1: 0.02800
TP 2: 0.02850
TP 3: 0.02920
Stop Loss: 0.02580
Watch how it reacts 'round the entry.
#SENT #Rmj-Trades
Entry Zone: 0.02680 – 0.02758
TP 1: 0.02800
TP 2: 0.02850
TP 3: 0.02920
Stop Loss: 0.02580
Watch how it reacts 'round the entry.
#SENT #Rmj-Trades
SENT7,08%
- Reward
- like
- Comment
- Repost
- Share
The 25 years ended like this💲
View Original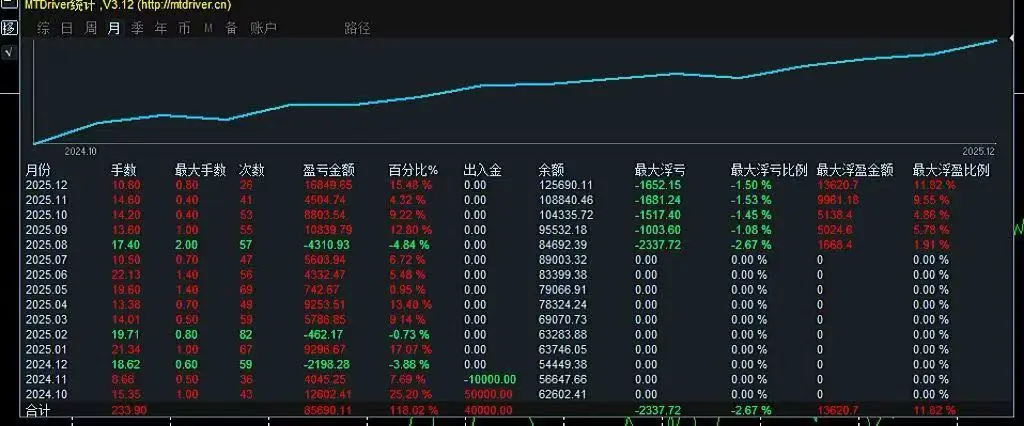
- Reward
- like
- Comment
- Repost
- Share
maybeaidonoevakh agievaji ahwisbshshah uayagayisushsuaiia hwuahwveuyhhuwjwjhwhww hwuwgavvsjajsusuwggwwha whshwsgshhshshhs


- Reward
- like
- Comment
- Repost
- Share
pop
pG0
Created By@BloodyScythe
Listing Progress
0.00%
MC:
$0.1
Create My Token
$RIVER It seems that the number of multi-branch and air force is quite similar. Once the disparity between the two becomes significant, the market maker will harvest one side.
View Original

- Reward
- like
- Comment
- Repost
- Share

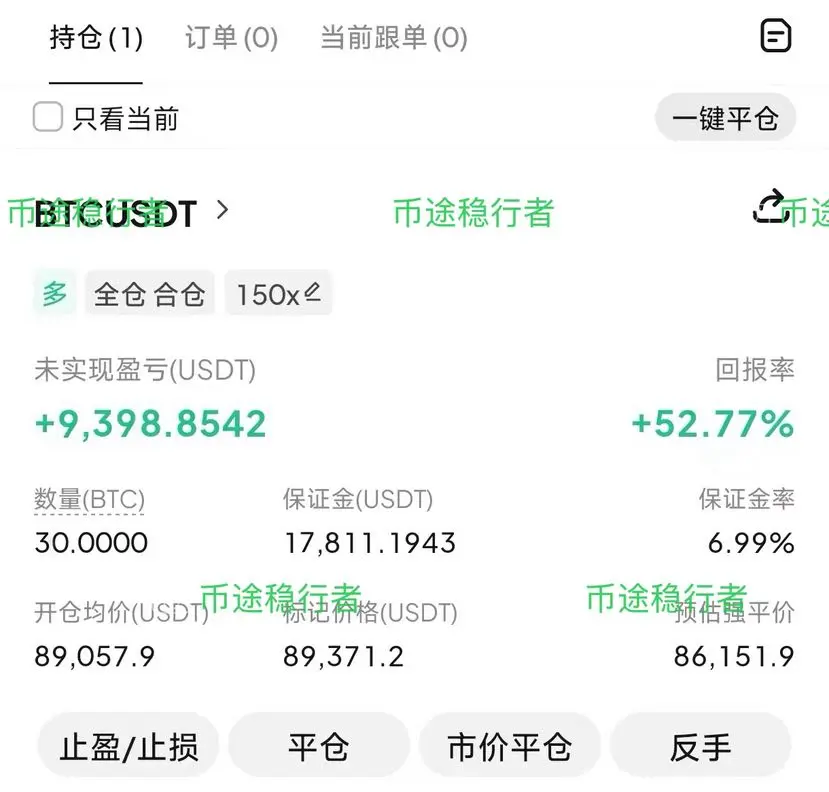
Catch a rebound wave, close to 10,000 oil in the bag, with perfect timing and space control.
While there are opportunities to participate in the rebound trend, it's more important to stay clear-headed: you can do it, but don't be greedy.
Take profits when the time is right and lock in gains promptly—that's the most stable approach in a volatile market.
$BTC $GT $ETH
#黄金白银再创新高 #特朗普取消对欧关税威胁 #ETH走势分析
View OriginalWhile there are opportunities to participate in the rebound trend, it's more important to stay clear-headed: you can do it, but don't be greedy.
Take profits when the time is right and lock in gains promptly—that's the most stable approach in a volatile market.
$BTC $GT $ETH
#黄金白银再创新高 #特朗普取消对欧关税威胁 #ETH走势分析

- Reward
- like
- Comment
- Repost
- Share
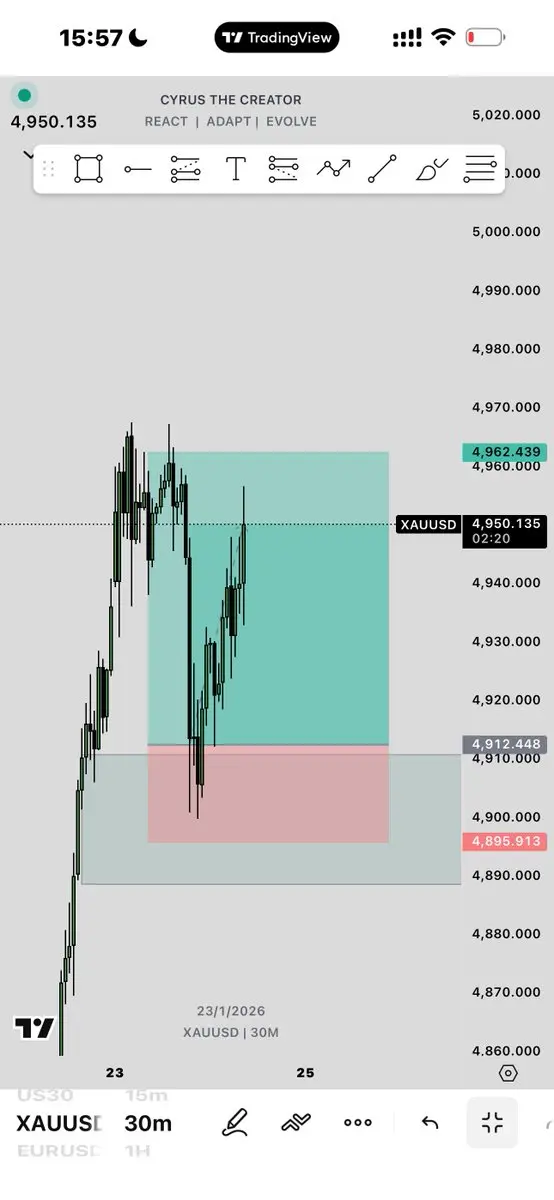
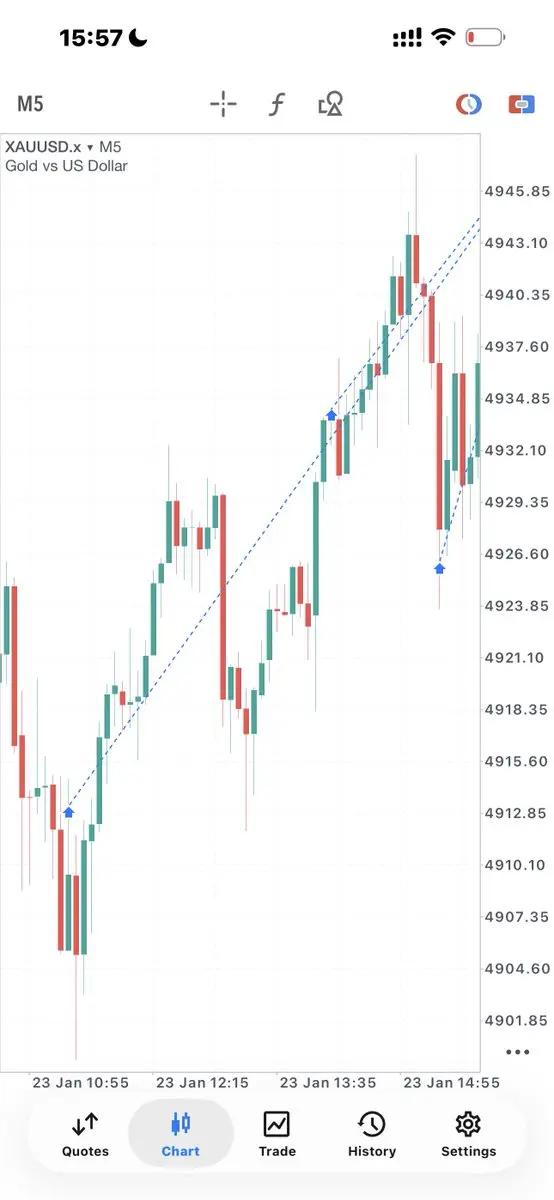
Still good at it.🙂↔️🐐$XAUUSD

- Reward
- like
- Comment
- Repost
- Share
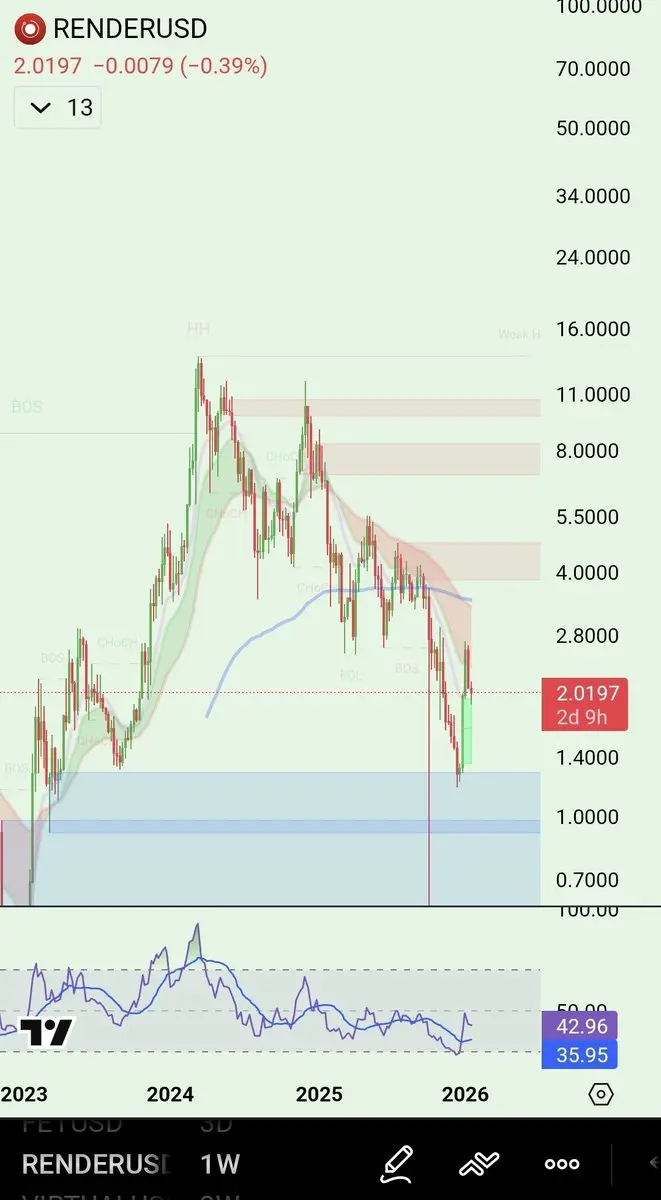
$RENDER bounced on the OB from 2023.Rejected by the weekly cloud on first try so far.Will update when it reclaims the cloud.
- Reward
- like
- Comment
- Repost
- Share
- Reward
- like
- Comment
- Repost
- Share
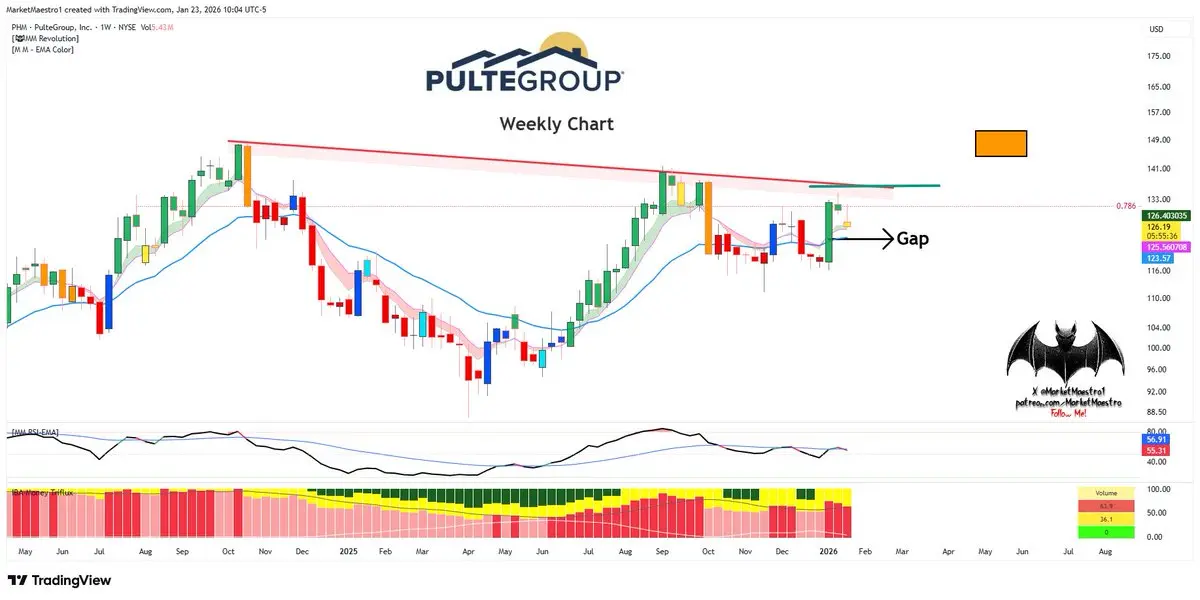
$PHMIt got rejected at fibo78, and there’s a gap below at $123. It may want to fill it
- Reward
- 1
- Comment
- Repost
- Share
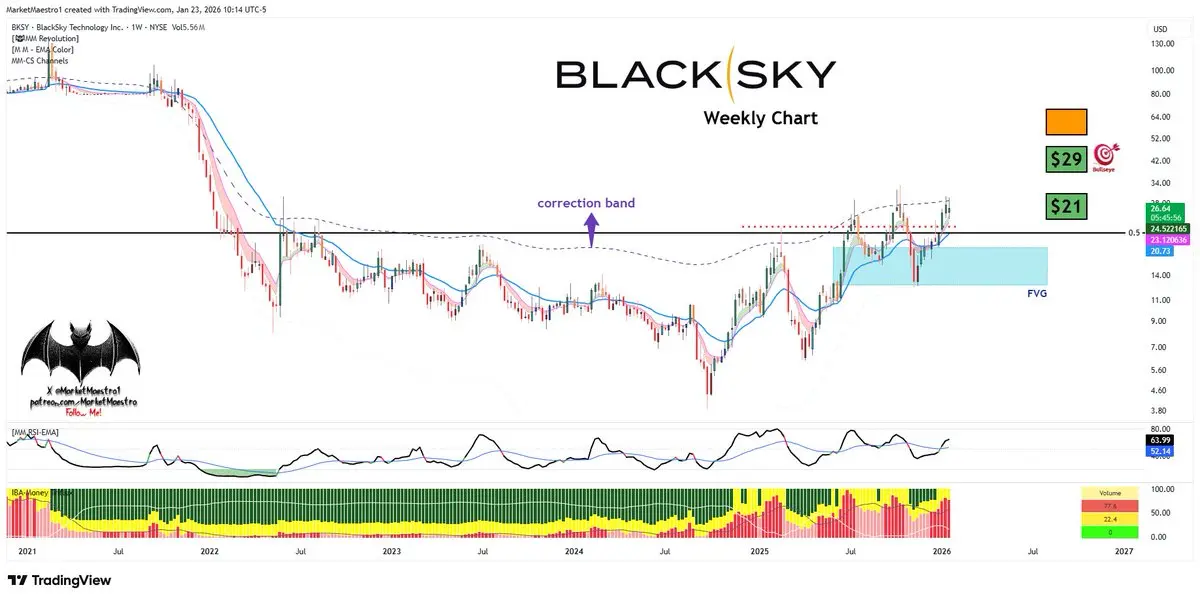
$BKSYIt hit the correction band again. But it’s also possible it keeps moving higher
- Reward
- like
- Comment
- Repost
- Share
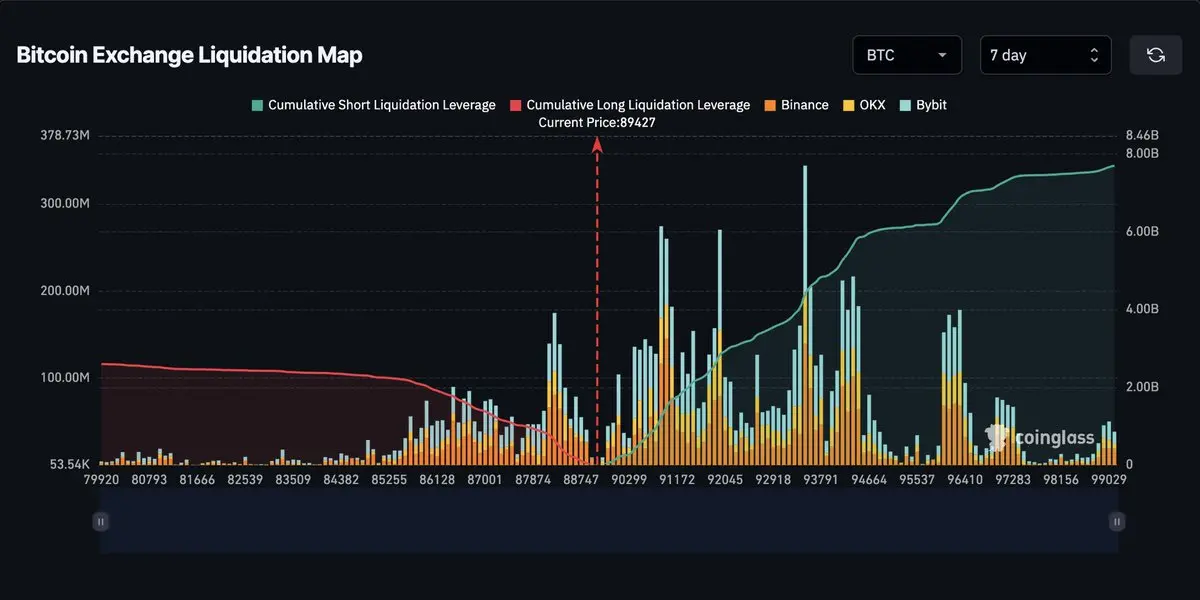
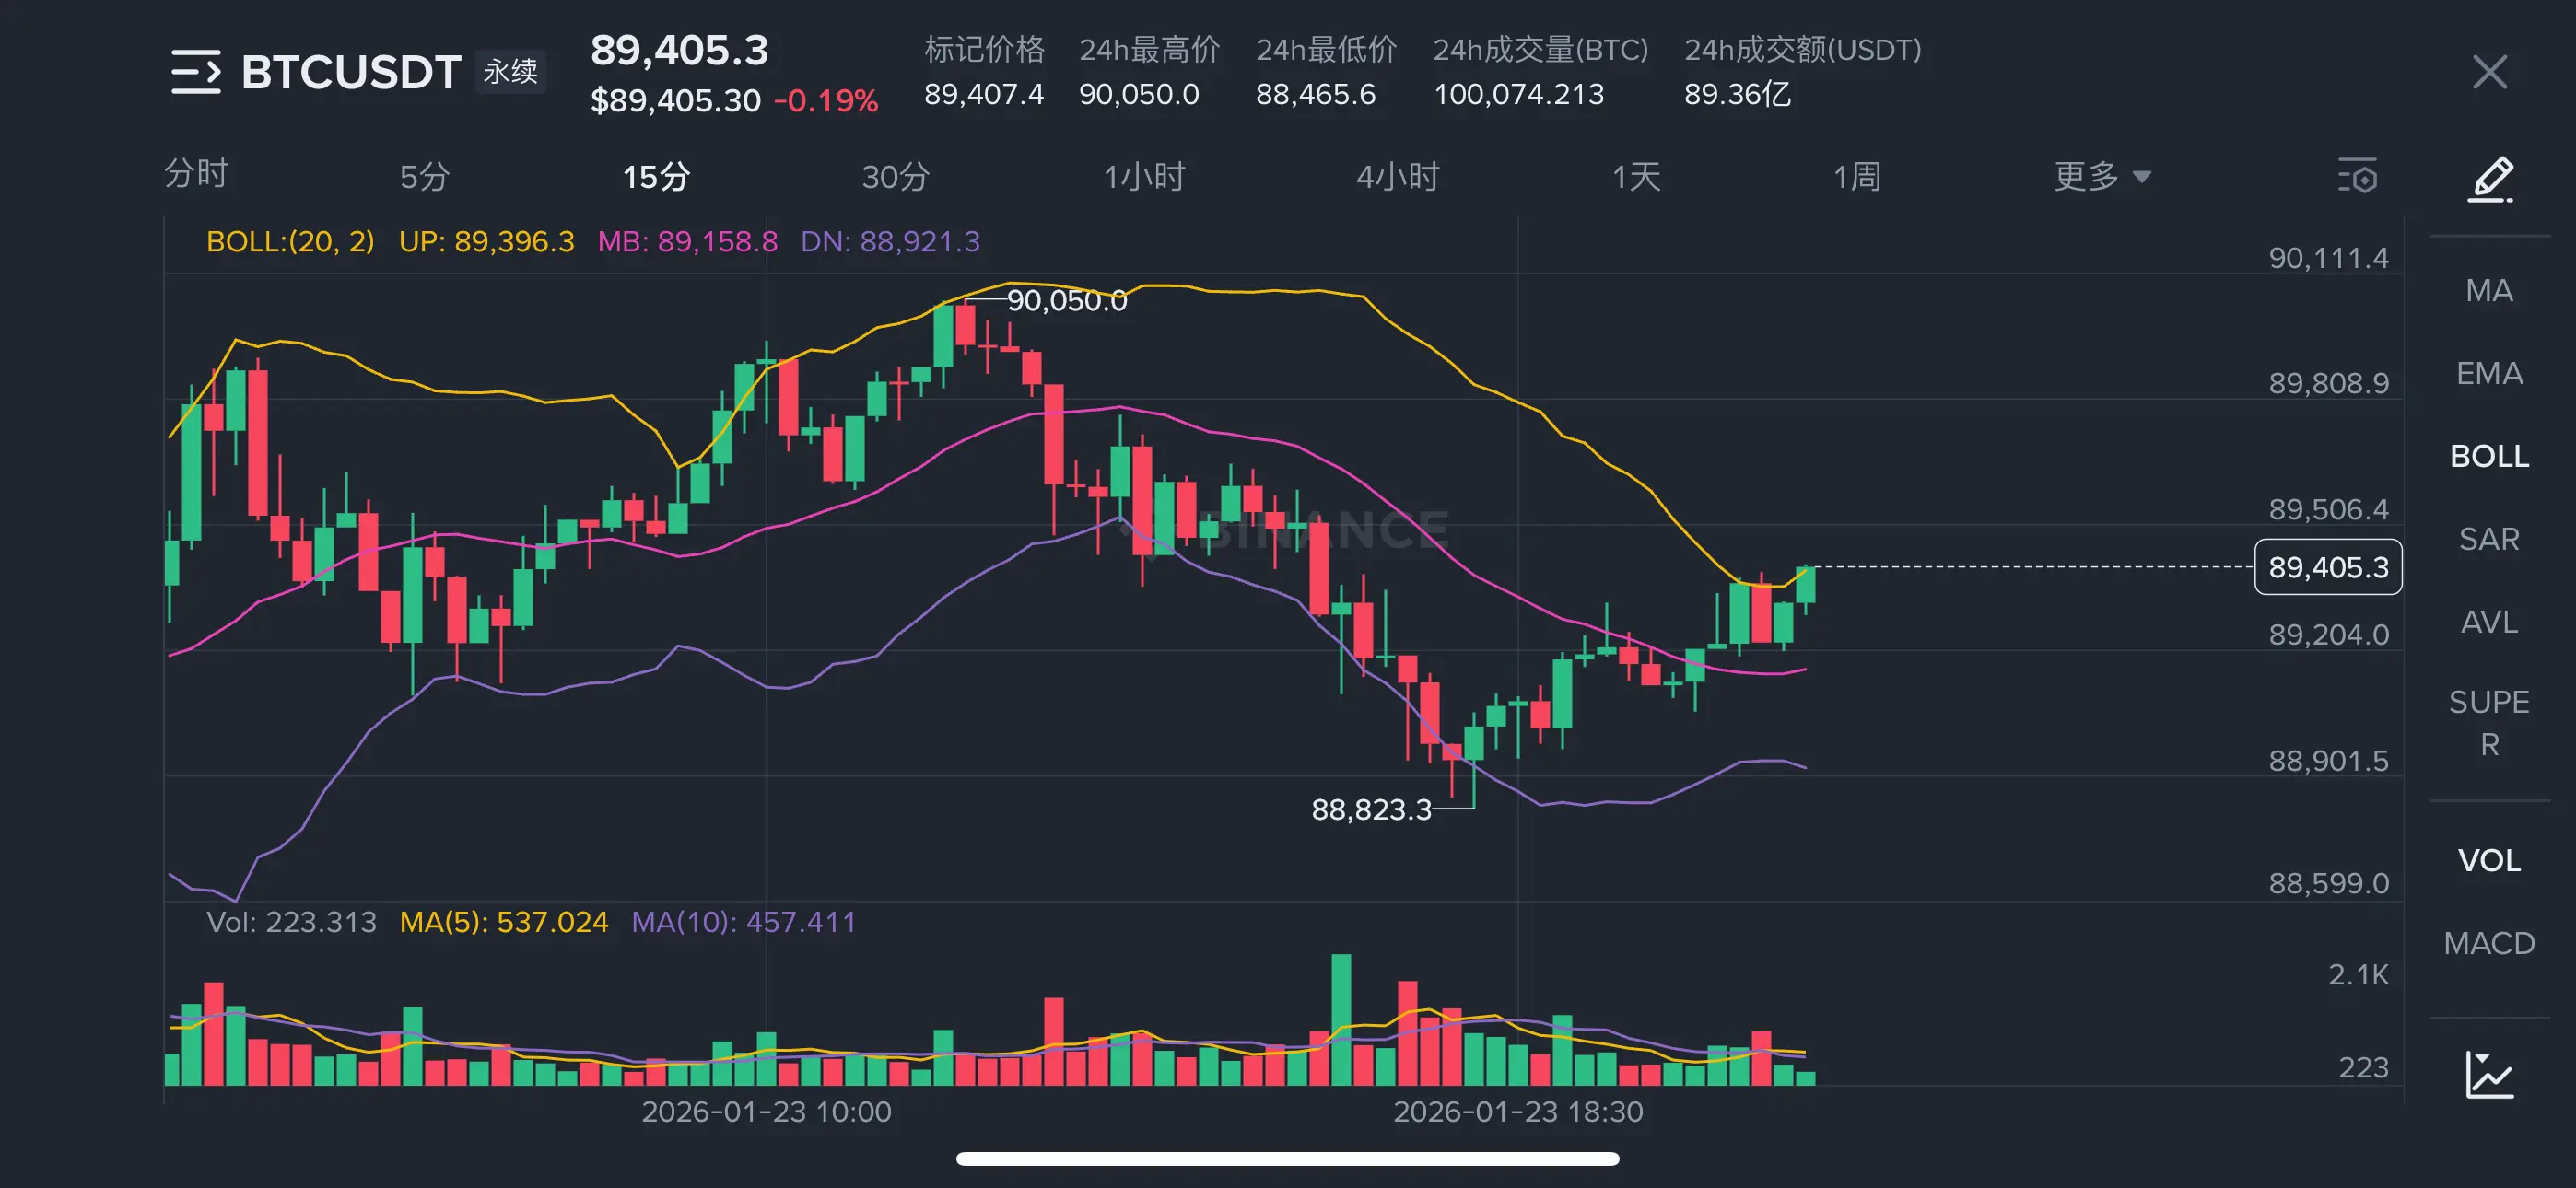
- Today’s Chart: Bitcoin Trading Under Pressure:
Bitcoin’s price continues to decline toward the $89,000 level, with indicators still showing bearish signals. The Relative Strength Index (RSI) at 42 on the daily chart indicates a downward trend, suggesting that Bitcoin’s technical structure may continue to weaken.
The Moving Average Convergence Divergence (MACD) remains below the signal line on the same chart, prompting investors to reduce their market exposure. The bearish momentum may intensify, with the MACD histogram expanding below the zero line.
However, the support level at $89,000 rema
BTC0,18%
- Reward
- 1
- 1
- Repost
- Share
Before00zero:
Bitcoin price is still below $90,000, affected by weak technical structure as both the MACD and RSI indicators have declined.CRNS
Cairns
Created By@xrp589
Listing Progress
0.06%
MC:
$3.43K
Create My Token
The current resistance zone for Bitcoin is between 90500 and 91500. If it cannot break through this range before the US market opens, then consider shorting at the 89800 to 90300 level. For a short-term pullback, first look at the support levels at 88500 to 87200. If it's just a minor correction and these two support levels are not broken, then either quickly exit your short positions or set proper stop-loss protections. $BTC #ETH走势分析
If the price actually breaks below the key support at 87500 to 87200, then continue to watch the lower support at 86300 to 86800. These two levels can be seen a
If the price actually breaks below the key support at 87500 to 87200, then continue to watch the lower support at 86300 to 86800. These two levels can be seen a
BTC0,18%
- Reward
- 1
- Comment
- Repost
- Share
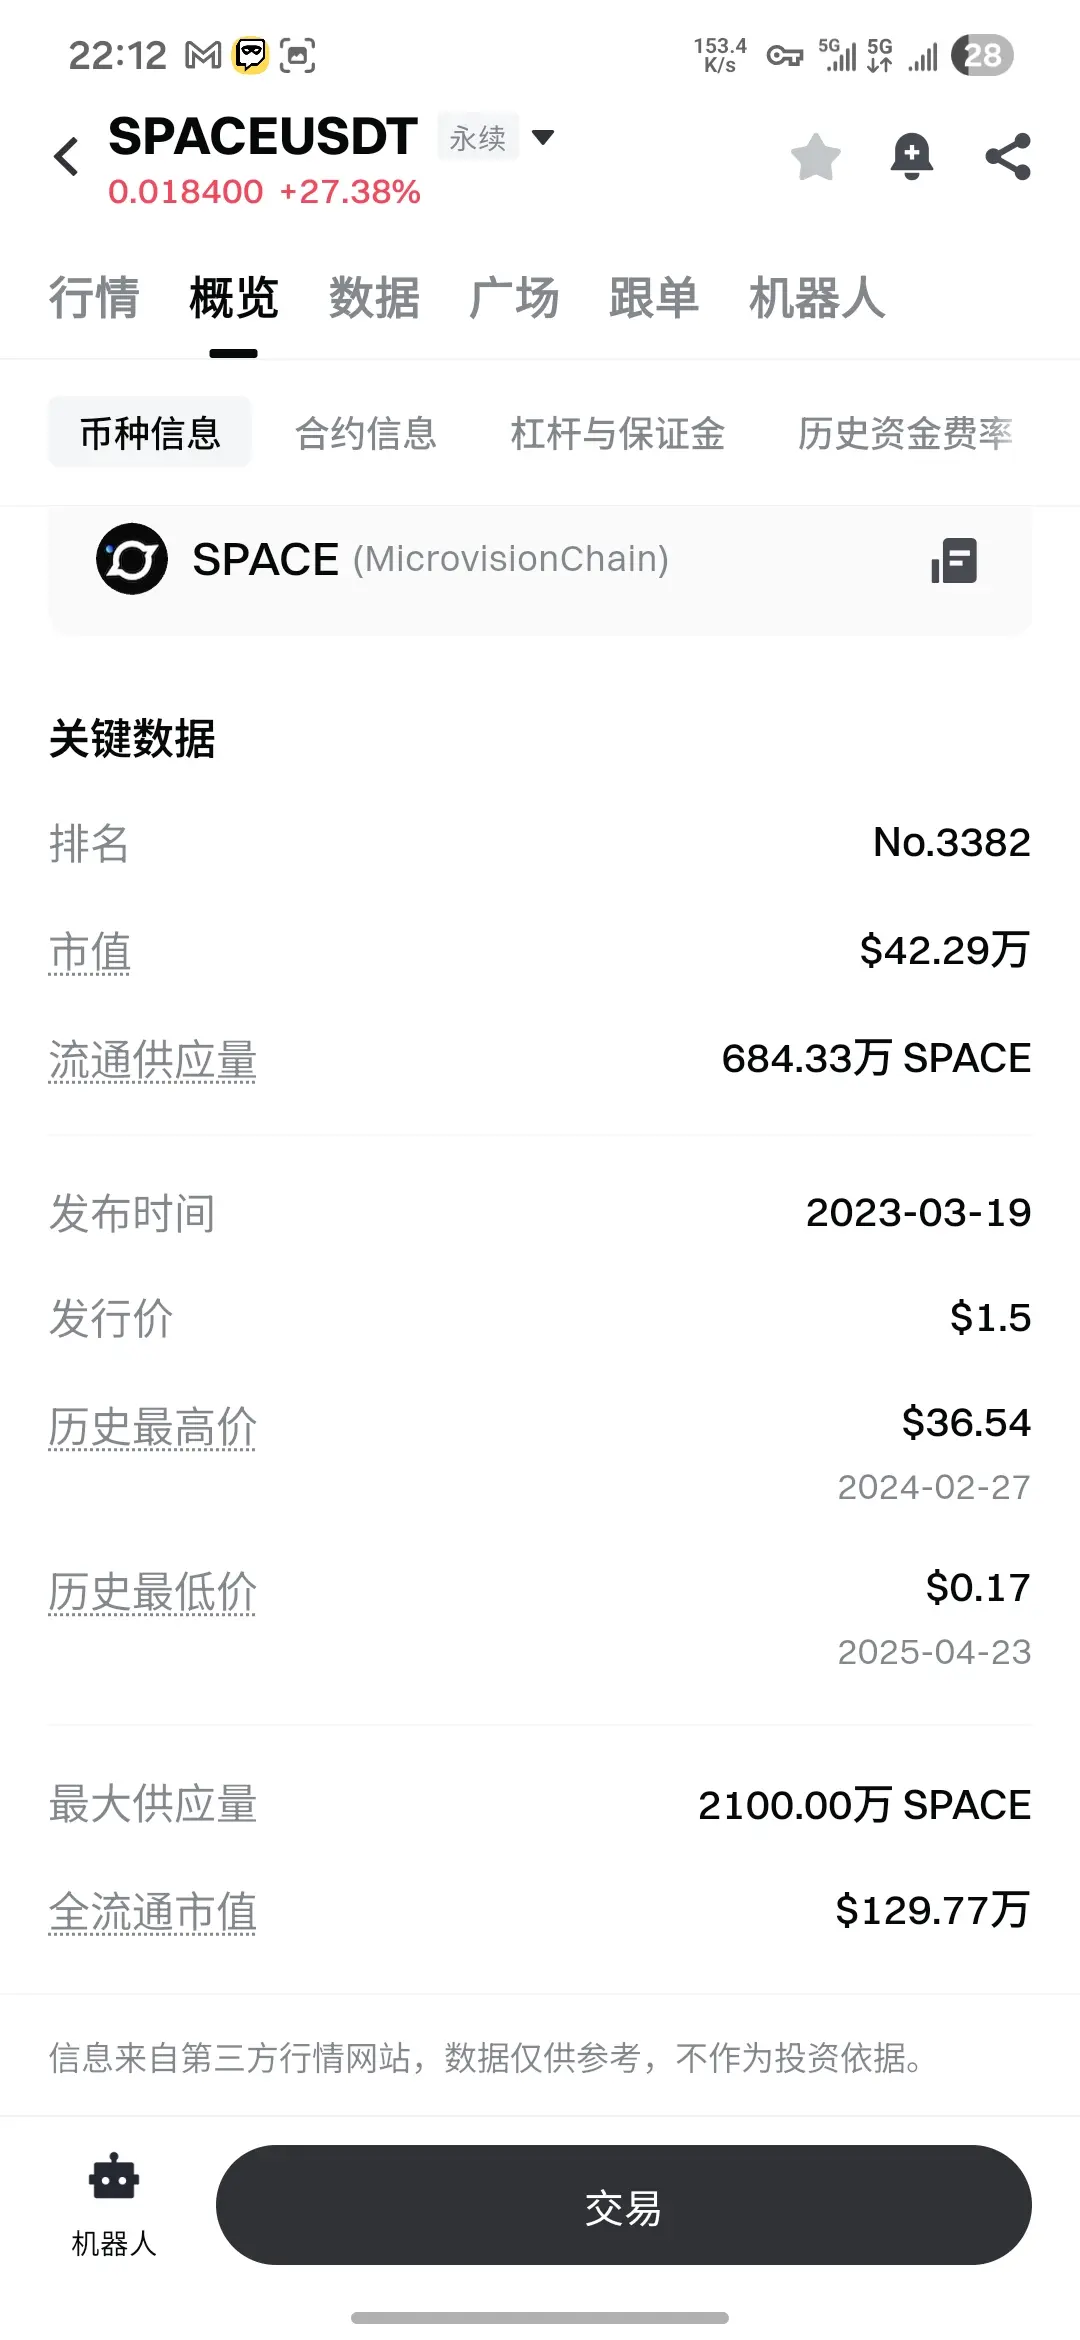
#SPACE The current space is the name of the bought space. Space (MVC) was initially listed on Sesame Exchange and was later delisted.
View Original
- Reward
- 1
- Comment
- Repost
- Share
New and old users can leave your footprints to save platform fees, share commissions together, brothers, let's save money. 13644030706
View Original
- Reward
- like
- Comment
- Repost
- Share
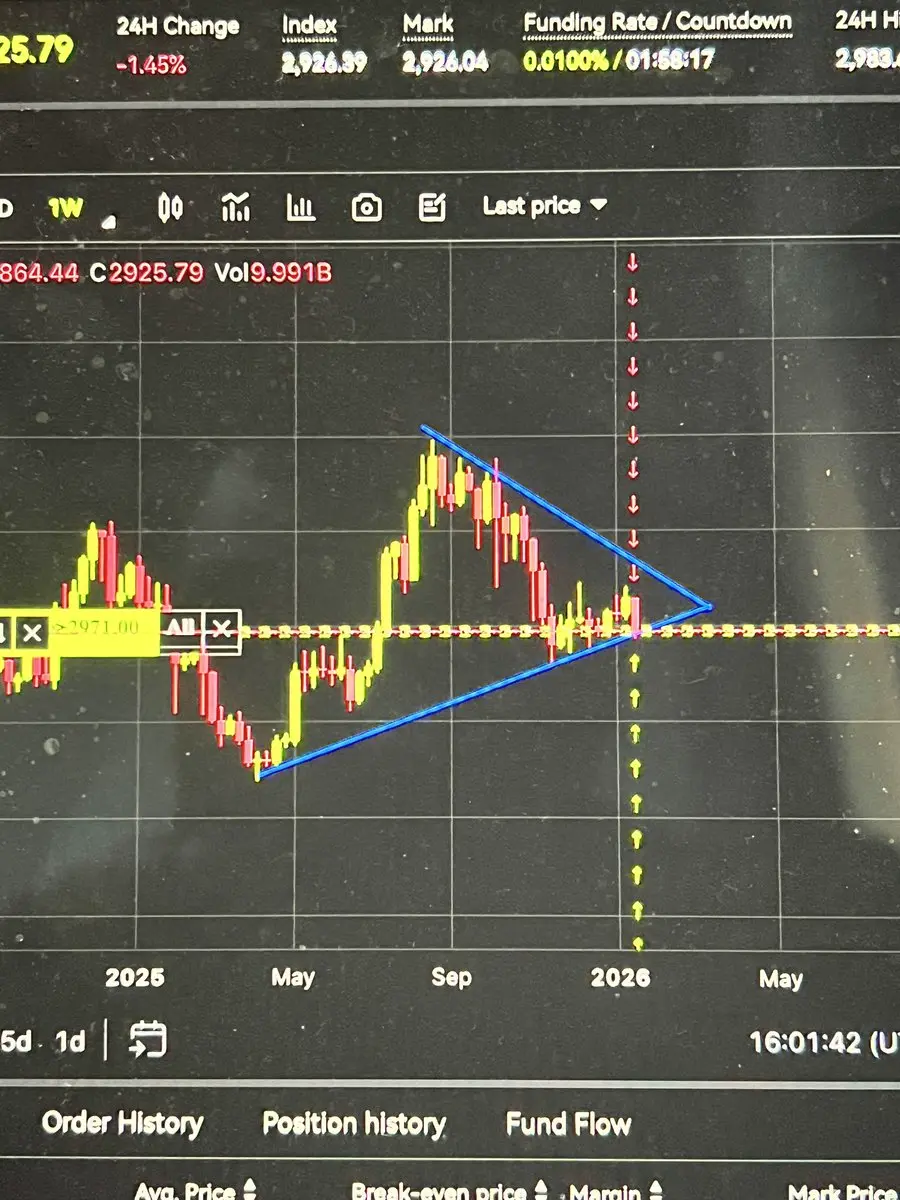
Waiting to see if this weekly trendline support breaks on $ETHThe Diamond ♦️ Pattern that formed at the close of market yesterday in the 8H TF was signHopefully this prints something over this weekend 🤨I’m doing this on @XTexchange Join here:
- Reward
- like
- Comment
- Repost
- Share
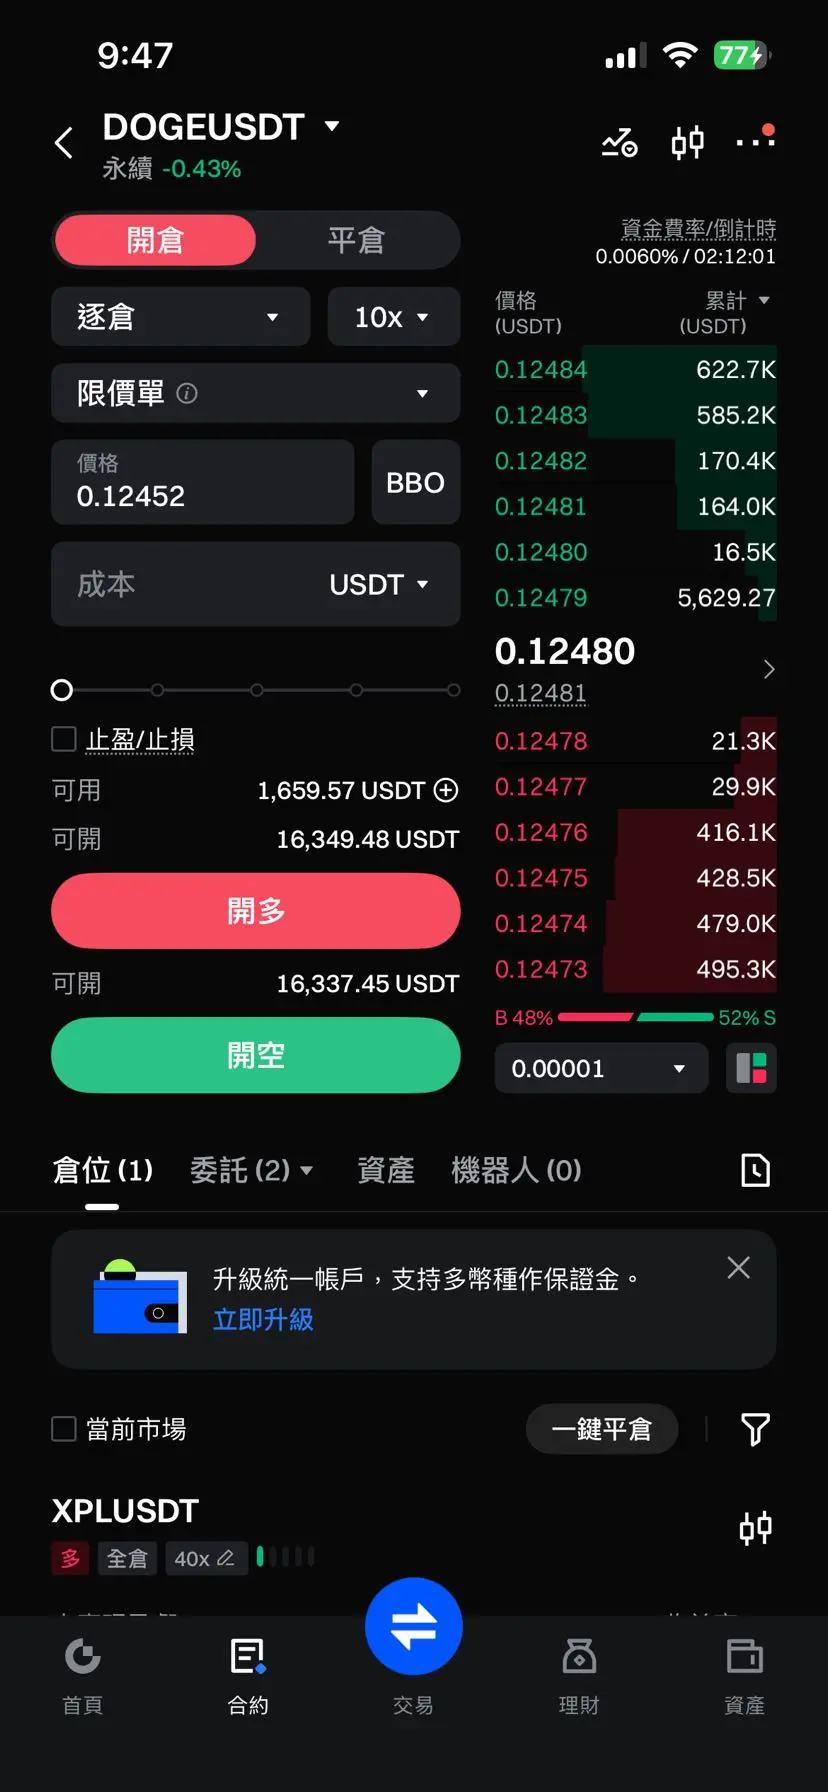
#DOGEETF上市纳斯达克 Dogecoin is stuck in the critical demand zone: ETF positive news has arrived, why is the price still unable to break out?
The price forecast for Dogecoin faces certain pressure because it is currently fluctuating around an important demand zone within an overall downtrend structure. Recent price movements reflect not just short-term volatility but structural issues. This situation has arisen in the context of 21Shares announcing the launch of a Dogecoin ETF on NASDAQ, which means Dogecoin has gained regulatory exposure. The question is whether this catalyst can change the existi
The price forecast for Dogecoin faces certain pressure because it is currently fluctuating around an important demand zone within an overall downtrend structure. Recent price movements reflect not just short-term volatility but structural issues. This situation has arisen in the context of 21Shares announcing the launch of a Dogecoin ETF on NASDAQ, which means Dogecoin has gained regulatory exposure. The question is whether this catalyst can change the existi
DOGE-0,28%

- Reward
- like
- Comment
- Repost
- Share
[Market Predicition]🔹 A mysterious whale keeps accumulating, pushing Ethereum holdings past 80,000 ETH — confidence still intact?
1.220
- Reward
- 3
- Comment
- Repost
- Share
BREAKING: Silver reaches $100 for the first time in history. #crypto

- Reward
- like
- Comment
- Repost
- Share
Load More
Join 40M users in our growing community
⚡️ Join 40M users in the crypto craze discussion
💬 Engage with your favorite top creators
👍 See what interests you
Trending Topics
View More27.2K Popularity
10.51K Popularity
6.64K Popularity
2.36K Popularity
4.19K Popularity
Hot Gate Fun
View More- MC:$3.44KHolders:20.10%
- MC:$0.1Holders:10.00%
- MC:$3.45KHolders:20.30%
- MC:$3.37KHolders:10.00%
- MC:$3.42KHolders:20.05%
News
View MoreAnalysis: Trump's renewed attack on the Federal Reserve prompted the market to seek safe-haven assets, pushing silver prices above $100 per ounce.
8 m
In the past 24 hours, the total contract liquidation across the entire network reached $151 million, with both longs and shorts being liquidated.
9 m
Data: 30 WBTC transferred out from Wincent, valued at approximately $2,655,800.
15 m
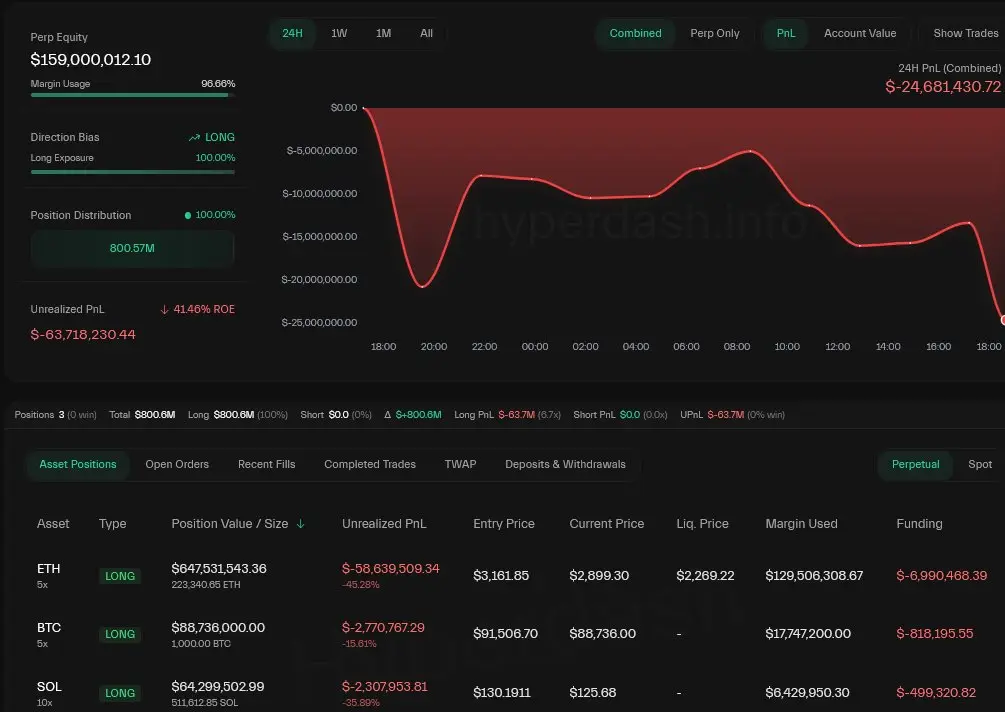
Gambler Deploys $1.82M in Maximum Leverage Trades Across BTC, ETH, and HYPE
19 m
U.S. leading economic indicator release delayed due to a temporary network outage at the World Federation of Large Enterprises
27 m
Pin