DreamsTakeFlight,Old
vip
Age 1.3 Yıl
Peak Tier 0
No content yet
Today did not hold above the high position, retracing to test the bottom, reaching around 1945, and is currently still around this range.
In the short term, it is still clearly a wide-range consolidation where time is converted into space. The short-term trend is testing the support at 2.90, and the next step is to layout based on whether the support is effective.
Next, you can buy in the range of 2.9-2.94, looking towards 3.000-3.450. #PI
PI-2.09%
BTC-2.58%
ETH-3.74%
View Original
post-image
  • Reward
  • Comment
  • Repost
  • Share
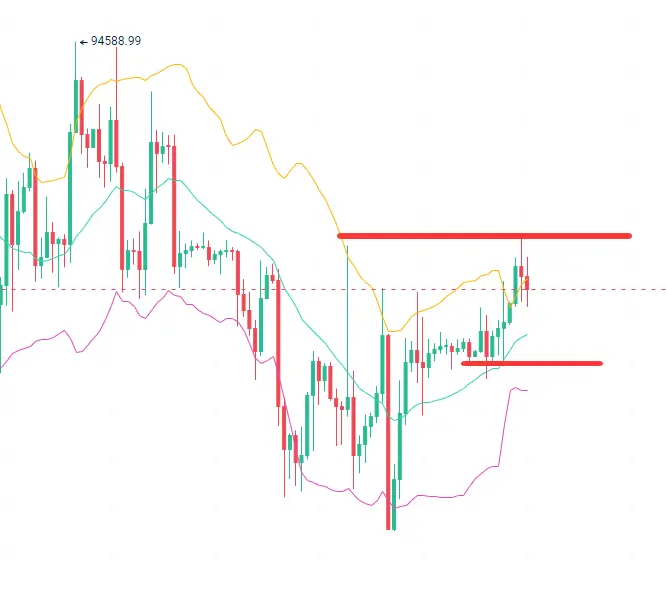
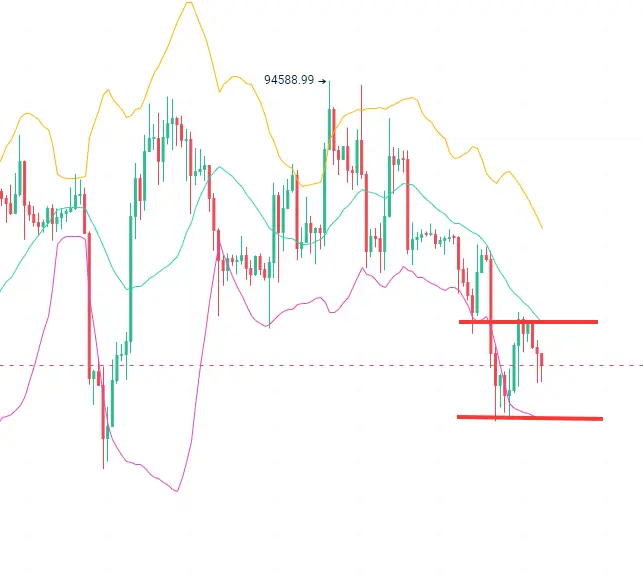
At midday, a pullback occurred, reaching the recent four-hour lower band around 8.7.
This point is also an ideal position after yesterday's surge and subsequent pullback, and the real trading high control has also been perfectly validated.
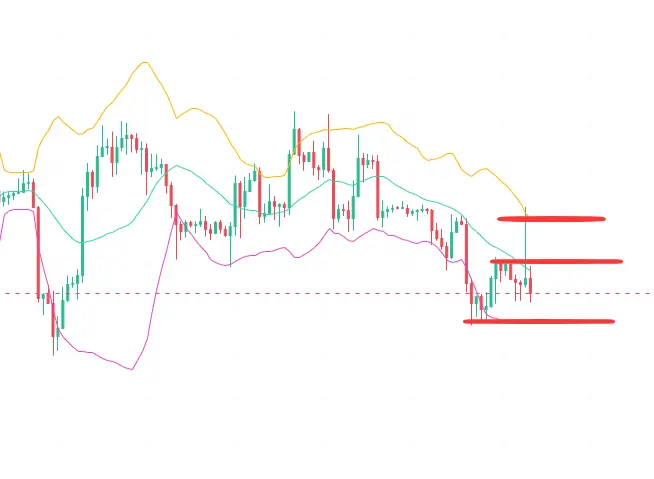
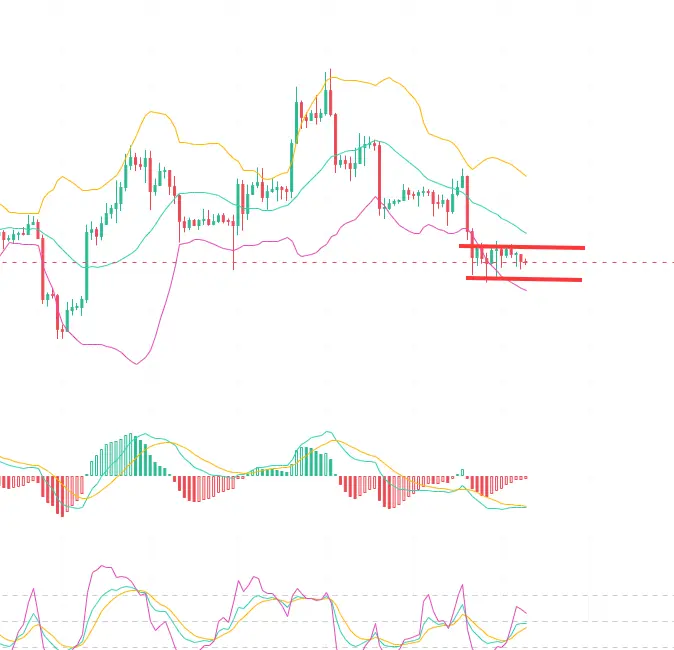
In the short term, it is still showing a clear wide-ranging oscillation pattern. Next, we will continue to observe whether the lower band support is effective.
The entry direction can be observed in the 8.7-8.75 range, looking towards the 8.9-8.95 range.
View Original
  • Reward
  • Comment
  • Repost
  • Share
Looking back at the intraday direction, there has been a constant probing of the upper resistance, and it has broken through multiple times, but it has not stabilized at the high point.
In the short term, the Bollinger Bands show a tendency to open, leaving a significant space for a pullback below. The market is expected to continue with a steady retracement before moving upwards.
Enter the market by pulling back to the 8.8-8.85 range and then look towards the afternoon target of 9.05. #BTC #ETH
BTC-2.58%
ETH-3.74%
View Original
post-image
  • Reward
  • Comment
  • Repost
  • Share
This morning it rose above 3060, breaking the recent oscillation upper band, and currently it is still at a high level, but there are signs of a pullback.
From a short-term perspective, the Ethereum Bollinger Bands show a clear contraction, with four consecutive bullish candles on the four-hour chart indicating a possible pullback to test the support of the middle band.
The support below is moving near 2.95. If there is a pullback, this point will be tested, and then layouts can be made based on this point.
The entry direction is to pull back near 2.95, looking towards the morning high of 3.06
ETH-3.74%
View Original
post-image
  • Reward
  • Comment
  • 1
  • Share
The morning once again tested the resistance above, followed by a pullback to the 8.79 line, and the wide oscillation pattern remains evident.
The short cycle shows a clear step-like upward trend, and the next step is to continuously test the four-hour upper resistance at 9.2. During the day, it is sufficient to maintain a pullback towards the direction of the doji.
The entry timing is to pull back to the 8.8-8.85 range, looking at the resistance at 9.0. If broken, look for 9.03-9.05.#BTC #ETH
View Original
post-image
  • Reward
  • Comment
  • Repost
  • Share
Looking back at the weekend performance, it remains within the oscillation range, constantly oscillating around the 8.7-8.9 range.
From the perspective of a short cycle, it is currently positioned above the middle track on the four-hour chart. The upper track resistance is still around 9.0, the middle track is around 8.7, and the lower track remains unchanged at 8.5. In the new week, just focus on these points and use them to enter the market.
The entry direction on Monday is to look towards the range of 8.9-8.95 after a pullback to the range of 8.7-8.75. #BTC #ETH
BTC-2.58%
ETH-3.74%
View Original
post-image
  • Reward
  • Comment
  • Repost
  • Share
It's the weekend again. Usually, Saturdays tend to be relatively stable. Today, continue to monitor whether the four-hour oscillation range is broken for entry.
From a short-term perspective, the upper resistance is below 9.0, the midline around 8.7, and the lower boundary remains at 8.5. This week, multiple trading opportunities have been presented within this range. Moving forward, in case of a breakout, continue to buy low and sell high.
Currently, the price is at the midline, so a conservative approach is to wait for a pullback to the 8.55-8.6 range, with a bullish target of 8.85-8.9.
View Original
post-image
  • Reward
  • Comment
  • Repost
  • Share
This week has been characterized by wide fluctuations within the 8.5-9.0 range. The continuous entry signals from DuoKong have consistently provided entry opportunities, and the resistance levels suggested by Lao Mu have likely perfectly reached the target.
Currently, the price is above the four-hour midline, around 8.8. The Bollinger Bands show signs of turning upward, but DuoKong has yet to break through the range. It is also at a high oscillation level, so a cautious approach would be to look for a pullback, primarily based on resistance levels, with support as a secondary consideration.
Fo
View Original
post-image
  • Reward
  • Comment
  • Repost
  • Share
The morning airdrop has not continued for now, and it remains in a oscillating low range.
It can maintain the old MOU midnight direction, around 8.50-8.55, looking towards the 8.75-8.8 range.
On the other side, it can range between 2.73-2.78, looking towards the 2.92-2.96 range.
View Original
post-image
post-image
  • Reward
  • Comment
  • Repost
  • Share
The evening session once again tests the four-hour midline resistance, piercing at 3.03, but has not stabilized above the deep lower band, currently still around 2.8.
From a short-term perspective, the four-hour Bollinger Bands remain open downward, showing signs of breaking below 2.8.
For future entry points, consider the previous low range of 2.7-2.74, and look at around 2.9.
View Original
post-image
  • Reward
  • Comment
  • Repost
  • Share
Reviewing the fluctuations near the close, a wide-range oscillation zone reappears, reaching the four-hour upper band resistance, and a long upper shadow is left by the spike.
Subsequently, it did not stabilize at the high point, and again deeply retreated below the middle band, with the Doko indicator showing good space.
From a cyclical perspective, the upper high of 9.0 is effectively solidified, and the support at 8.5 remains unchanged. The oscillation range is quite large; if not completely broken, it can continue to fluctuate within this zone.
Based on this view, a dip to 8.55-8.60 is exp
View Original
  • Reward
  • Comment
  • Repost
  • Share
Reviewing the intraday volatility, the key resistance level 3.0 shows a significant suppression effect, while the support at 2.8 remains firm. Currently, the price is oscillating in the middle range around 2.94, with bulls and bears in a low-level battle.
From the cyclical trend perspective, although the overall channel was downward earlier, characterized by prominent oscillation and consolidation, the focus is on the breakthrough and stabilization signals in the core range of 2.85-3.0, adjusting steps according to the trend rhythm.
Based on the current analysis, identify the core range nodes,
View Original
post-image
  • Reward
  • Comment
  • Repost
  • Share
Currently, the 4-hour Bollinger Bands are continuously diverging downward, and the price has tested the 88,500 level multiple times without breaking through. The resistance above remains strong.
The short-term support level below is maintained at 85,000, and it is likely to continue testing the validity of this support.
For evening trading, it is recommended to focus on shorting high and buying low as a supplement. The current price is at the lower end of the range, so you can watch for a rebound first. If the rebound reaches 87,500, you can consider short positions, targeting the 85,500-85,00
View Original
post-image
  • Reward
  • Comment
  • Repost
  • Share
Afternoon short-term long positions are reversing, and the 2000-point fluctuation range has already appeared.
Early morning rebound upward was suppressed by the four-hour midline at 88,500, now around 88,700.
The short-term cycle remains below the midline resistance, with 88,500 still acting as resistance and 85,000 as support, maintaining a stable oscillation at low levels. The bullish trend remains valid.
Entry direction: Wait for a pullback near 86,500, and look around 85,000.
View Original
post-image
  • Reward
  • Comment
  • Repost
  • Share
After touching the low point of 85,000, the market has been consolidating around 86,000, with a short-term slight rebound. The next focus is on whether this low point will form an effective bottoming structure.
The four-hour Bollinger Bands are showing a diverging downward trend, with the middle band acting as resistance near the 89,500 range, which was the recent sideways trading zone. If bullish momentum recovers, it is necessary to observe the test of this resistance zone.
Operational strategy can refer to: consider entering long positions around 85,700, targeting the 88,000-88,500 range, w
View Original
post-image
  • Reward
  • Comment
  • Repost
  • Share
BTC is currently consolidating near the 90,000 level, approaching a decision point for direction, with increased battles between bulls and bears.
In the 4H timeframe, the middle band at 91,500 is under pressure, the lower support at 89,000 remains solid, and the Bollinger Bands are diverging downward, with continued testing of support on Sunday.
Next, focus on the validity of support levels, consider participating on a pullback around 89,500, with targets around 91,500. Take a稳健 approach and implement proper risk management.
BTC-2.58%
View Original
  • Reward
  • Comment
  • Repost
  • Share
The intraday pattern is positive, with a rally to the high point followed by a correction at the four-hour midline of 3250, and the Bollinger Bands are slightly narrowing with continuous oscillation.
The early morning surge faced resistance and then retraced, which did not impact the bullish trend, indicating strong trend continuity.
The three Bollinger Bands are turning upward, located at the middle band and not above it. Observing support levels below is recommended.
Based on recent range analysis, watch for a consolidation between 3145-3175, with potential upward targets at 3275-3300.
View Original
post-image
  • Reward
  • Comment
  • Repost
  • Share
Short-term cycle technical patterns are positive, with consecutive gains helping the price stabilize at the middle band of the Bollinger Bands at 91,500. The slight expansion of the Bollinger Bands confirms increased activity.
The early morning rally faced resistance and pulled back, but this did not impact the bullish trend, which remains strong.
The three Bollinger Bands are moving upward in sync, with the middle band support proving effective, while the upper band creates phase resistance.
Considering recent wide-range fluctuations, the support zone is around 91,000-91,500. The next target
View Original
post-image
  • Reward
  • Comment
  • Repost
  • Share
  • Trending TopicsView More
  • Pin
Trade Crypto Anywhere Anytime
qrCode
Scan to download Gate App
Community
  • 简体中文
  • English
  • Tiếng Việt
  • 繁體中文
  • Español
  • Русский
  • Français (Afrique)
  • Português (Portugal)
  • Bahasa Indonesia
  • 日本語
  • بالعربية
  • Українська
  • Português (Brasil)