The article "2025 ACE Price Prediction: Expert Analysis and Market Outlook for the Next Bull Run" offers an in-depth analysis of ACE's market position and future price trajectory, focusing on its role within the Web3 gaming ecosystem. Key sections include historical price trends, current market dynamics, and the impact of technological advancements on ACE's valuation. It addresses the needs of investors by providing professional price forecasts, risk management strategies, and market sentiment insights. Designed for both novice and experienced investors, the article emphasizes strategic investment approaches using Gate for trading ACE tokens.
Introduction: ACE's Market Position and Investment Value
Fusionist (ACE) is an independent Web3 game that delivers AAA quality gaming experiences through Unity and HDRP technologies, offering three interconnected game modes for diverse players. Since its launch in 2023, ACE has established itself in the gaming and blockchain ecosystem. As of December 2025, ACE maintains a market capitalization of approximately $20.46 million, with a circulating supply of around 84.11 million tokens, currently trading at $0.2433 per token. This innovative gaming asset continues to play an increasingly important role in the Web3 gaming sector.
This article provides a comprehensive analysis of ACE's price performance and market trajectory, combining historical price patterns, market supply and demand dynamics, ecosystem development, and macroeconomic factors to deliver professional price forecasts and practical investment strategies for investors seeking exposure to this Web3 gaming token.
Fusionist (ACE) Market Analysis Report
I. ACE Price History Review and Current Market Status
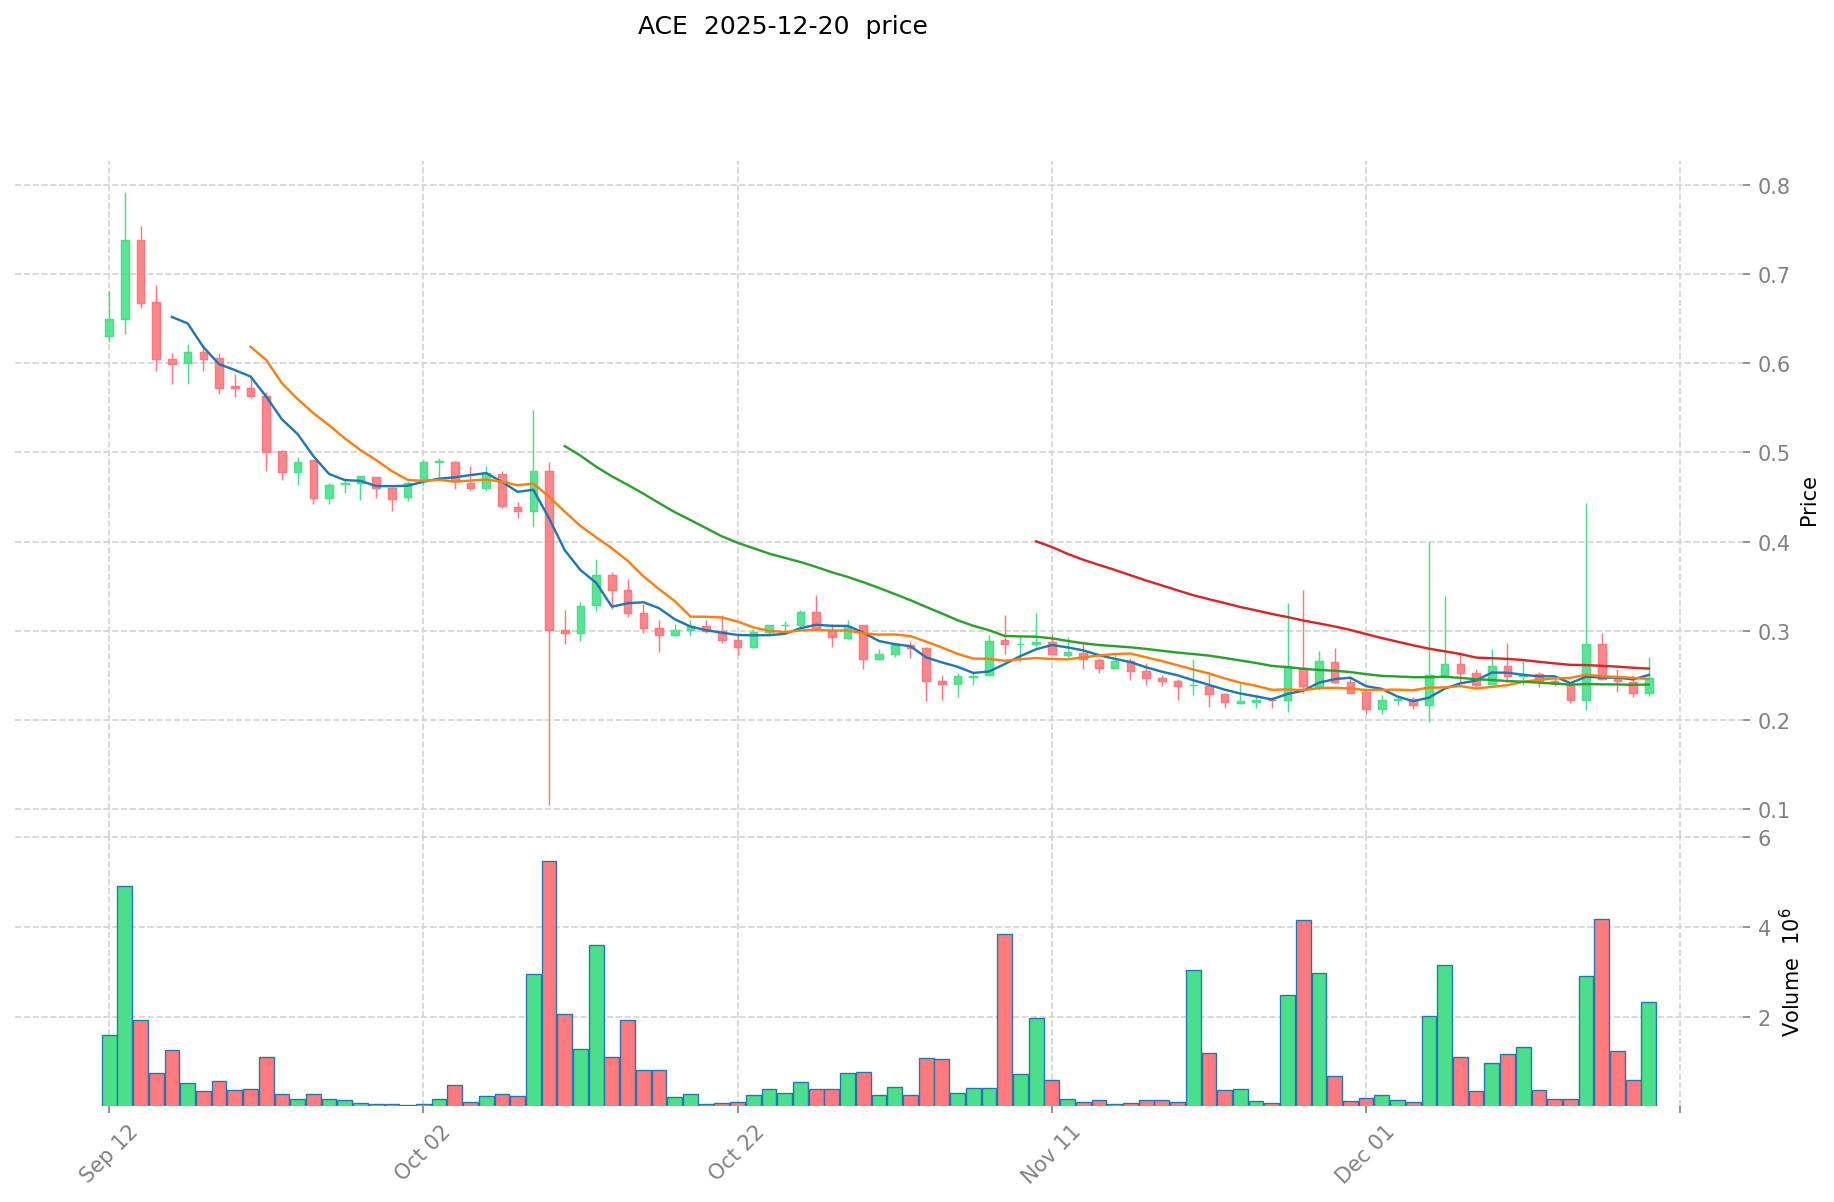
ACE Historical Price Movement Trajectory
- December 2023: ACE reached its all-time high (ATH) of $15.659, marking a significant peak in the token's trading history.
- 2024-2025: Following the peak, ACE experienced a prolonged downtrend, declining substantially over the subsequent months.
- October 2025: ACE hit its all-time low (ATL) of $0.1045, representing the lowest price point in the token's history.
ACE Current Market Position
As of December 20, 2025, ACE is trading at $0.2433, reflecting substantial losses from its historical highs. The token exhibits the following market characteristics:
Price Performance Metrics:
- 24-hour change: +0.62% ($0.2433)
- 1-hour change: -0.25%
- 7-day change: -0.12%
- 30-day change: +2.13%
- 1-year change: -87.94%
Market Valuation Data:
- Market capitalization: $20,463,201.71
- Fully diluted valuation (FDV): $35,596,704.77
- 24-hour trading volume: $469,752.01
- Current market cap to FDV ratio: 57.22%
Supply Metrics:
- Circulating supply: 84,106,871 ACE (57.22% of total supply)
- Total supply: 146,307,870 ACE
- Maximum supply: 147,000,000 ACE
- Number of holders: 17,156
Market Position:
- Global market ranking: #860
- Market dominance: 0.0011%
- Listed on 29 exchanges
- Current market sentiment: Extreme Fear (VIX score: 20)
The token has recovered modestly from its October 2025 lows but remains significantly below its December 2023 peak, representing a decline of approximately 84.5% from all-time highs.
Visit Gate.com to check the current ACE market price
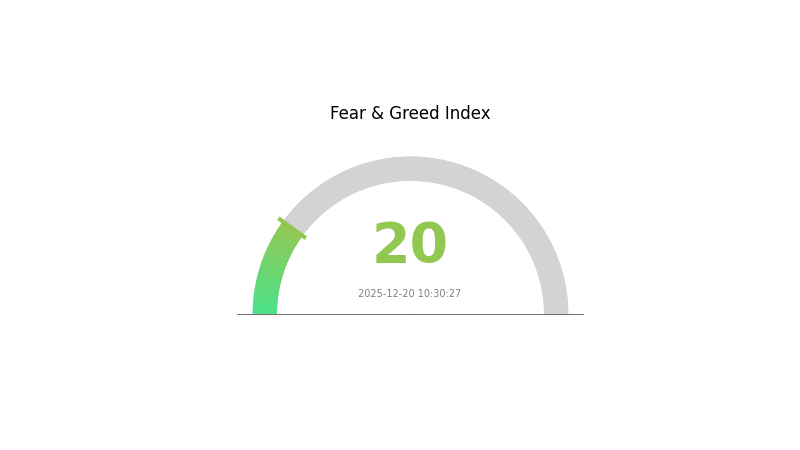
ACE Market Sentiment Index
2025-12-20 Fear & Greed Index: 20 (Extreme Fear)
Click to view current Fear & Greed Index
The crypto market is experiencing extreme fear, with the index hitting 20. This indicates significant market pessimism and heightened investor anxiety. When fear reaches such extreme levels, it often signals potential buying opportunities for contrarian investors. Market volatility is elevated, and sentiment remains deeply bearish. Traders should exercise caution and conduct thorough risk assessment. Consider monitoring key support levels and accumulating positions gradually during such extreme fear periods, as historical patterns suggest markets tend to recover from these lows.
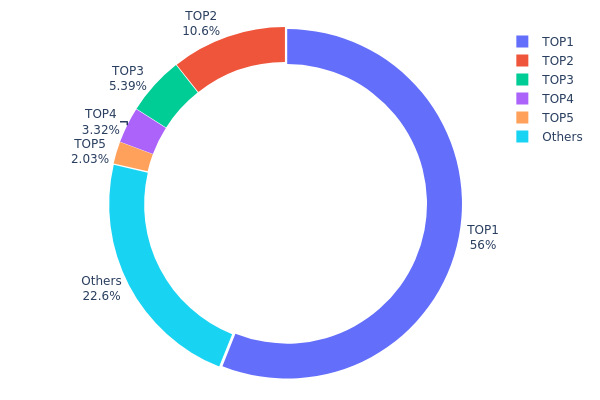
ACE Holdings Distribution
The address holdings distribution chart illustrates the concentration of ACE tokens across different wallet addresses, revealing the decentralization level and market structure of the token. By analyzing the proportion of tokens held by top addresses compared to the overall circulating supply, this metric provides critical insights into potential market risks, price manipulation susceptibility, and the stability of the token's on-chain ecosystem.
ACE exhibits significant concentration risk in its current holdings distribution. The top address alone commands 56.04% of all tokens, while the combined top five addresses control 77.38% of the total supply. This extreme concentration in the hands of a limited number of holders represents a substantial departure from ideal decentralization standards. The dominance of the largest holder—accounting for more than half of all tokens—poses considerable concerns regarding market control and liquidity dynamics. Such concentrated distribution typically indicates either early-stage project characteristics or the presence of major institutional stakeholders and project reserves.
The current address distribution pattern suggests elevated vulnerability to coordinated selling pressure and price volatility. With over three-quarters of the token supply controlled by merely five addresses, the market structure lacks the distributed participant base necessary for healthy price discovery mechanisms. This concentration creates asymmetric information advantages for major holders and increases the potential for significant price fluctuations should these addresses execute large transactions. The remaining 22.62% distributed among other addresses provides limited counterbalance to offset the influence of top holders. Overall, ACE's on-chain structure reflects a centralized distribution profile that prioritizes concentration among key stakeholders over broad market participation and decentralization.
Click to view current ACE Holdings Distribution
| Top |
Address |
Holding Qty |
Holding (%) |
| 1 |
0xa399...14b71c |
13844.52K |
56.04% |
| 2 |
0x8894...e2d4e3 |
2625.40K |
10.62% |
| 3 |
0xe4cb...a43abb |
1331.78K |
5.39% |
| 4 |
0x97b9...b68689 |
819.38K |
3.31% |
| 5 |
0xab78...3ee1bc |
501.10K |
2.02% |
| - |
Others |
5581.10K |
22.62% |
II. Core Factors Influencing ACE's Future Price
Technology Development and Ecosystem Building
-
Endurance 2.0 Mainnet Upgrade: The successful launch of Endurance 2.0 mainnet represents a key catalyst for ACE token appreciation. Technical innovation and ecosystem expansion are expected to unlock positive upside momentum. If the mainnet upgrade proceeds smoothly, ACE price could rise to the $0.80 to $1.20 range, representing potential growth of approximately 56% to 134% from current levels.
-
Blockchain Gaming Ecosystem: ACE is positioned in the blockchain gaming sector through Fusionist's platform. Successful ecosystem applications and increased adoption within the gaming vertical can drive price growth.
Note: This analysis is for informational purposes only and should not be construed as investment advice. Cryptocurrency investment carries high risk. Please conduct thorough research and carefully assess your risk tolerance before making investment decisions. Trade safely on Gate.com.
Three、2025-2030 ACE Price Forecast
2025 Outlook
- Conservative Forecast: $0.1482 - $0.1800
- Neutral Forecast: $0.2100 - $0.2430
- Optimistic Forecast: $0.2800 - $0.2965 (requires sustained market momentum and positive ecosystem developments)
2026-2028 Medium-term Outlook
- Market Stage Expectations: Consolidation with gradual appreciation, characterized by price stabilization and recovery phases with improved market sentiment
- Price Range Predictions:
- 2026: $0.2401 - $0.2805
- 2027: $0.2366 - $0.3852
- 2028: $0.2476 - $0.3533
- Key Catalysts: Enhanced tokenomics adoption, expanded ecosystem partnerships, increased institutional participation, and favorable regulatory developments in major markets
2029-2030 Long-term Outlook
- Base Case Scenario: $0.2836 - $0.3554 (assuming steady ecosystem growth and moderate market expansion)
- Optimistic Scenario: $0.3417 - $0.3714 (with successful platform scaling and mainstream adoption acceleration)
- Transformational Scenario: $0.3800 - $0.4217 (under conditions of breakthrough technological innovations, major institutional adoption, and significant market capitalization expansion)
- 2030-12-31: ACE projected at $0.4217 (upper range realization with transformational market conditions met)
| 年份 |
预测最高价 |
预测平均价格 |
预测最低价 |
涨跌幅 |
| 2025 |
0.29646 |
0.243 |
0.14823 |
0 |
| 2026 |
0.28052 |
0.26973 |
0.24006 |
10 |
| 2027 |
0.38517 |
0.27512 |
0.23661 |
13 |
| 2028 |
0.35326 |
0.33015 |
0.24761 |
35 |
| 2029 |
0.35537 |
0.3417 |
0.28361 |
40 |
| 2030 |
0.42173 |
0.34854 |
0.3346 |
43 |
Fusionist (ACE) Professional Investment Strategy and Risk Management Report
IV. ACE Professional Investment Strategy and Risk Management
ACE Investment Methodology
(1) Long-Term Holding Strategy
(2) Active Trading Strategy
ACE Risk Management Framework
(1) Asset Allocation Principles
- Conservative Investors: 1-2% of total portfolio allocation, focusing on core long-term positions with minimal trading activity.
- Active Investors: 3-5% of total portfolio allocation, permitting tactical additions during support bounces and strategic scaling into weakness.
- Professional Investors: 5-8% of total portfolio allocation, incorporating sophisticated hedging strategies and derivatives positions aligned with gaming sector exposure.
(2) Risk Hedging Solutions
- Stablecoin Reserves: Maintain 30-40% of gaming token allocation in USDT or USDC on Gate.com to enable rapid rebalancing during extreme volatility events or market capitulation phases.
- Sector Diversification: Balance ACE holdings with exposure to established gaming or infrastructure tokens, reducing single-project concentration risk.
(3) Secure Storage Solutions
- Hardware Wallet Integration: Connect Gate.com Web3 Wallet to hardware devices for elevated security of substantial holdings, enabling secure transaction signing without exposure of private keys.
- Exchange Reserve Minimization: Store only active trading quantities on exchange platforms, with the majority held in self-custody solutions to eliminate counterparty risk.
- Security Considerations: Implement withdrawal address whitelisting, enable two-factor authentication on all accounts, rotate API keys quarterly, and maintain encrypted backup copies of seed phrases in geographically distributed secure locations.
V. ACE Potential Risks and Challenges
ACE Market Risk
- Extreme Price Volatility: ACE has experienced 87.94% annual depreciation and currently trades 98.45% below its all-time high, indicating severe market sentiment deterioration and potential for additional drawdowns if gaming adoption fails to materialize.
- Liquidity Risk: With 24-hour trading volume of $469,752 and market capitalization of $20.46 million (57.22% of fully diluted valuation), ACE exhibits limited liquidity that could constrain position exit timing during adverse market conditions.
- Market Capitalization Fragmentation: The token's modest market cap ranking (#860) and 0.0011% market dominance reflect minimal institutional adoption and weak macroeconomic integration within broader crypto markets.
ACE Regulatory Risk
- Web3 Gaming Classification Uncertainty: Regulatory frameworks governing blockchain-based gaming tokens remain ambiguous across major jurisdictions, creating potential for regulatory reclassification that could trigger forced delisting or trading restrictions.
- Geographic Compliance Challenges: Gaming tokens face heightened regulatory scrutiny in multiple regions regarding gambling mechanics, token economics, and secondary market trading structures.
- Policy Evolution Risk: Future regulatory decisions regarding play-to-earn mechanics, token distribution, or gaming incentive structures could materially impact ACE's utility and market viability.
ACE Technical Risk
- Smart Contract Vulnerabilities: As a BSC-based token, ACE faces potential smart contract exploits, bridge vulnerabilities, or protocol-level security compromises that could result in token loss or functionality disruption.
- Game Development Delays: Fusionist's AAA gaming quality aspirations require substantial ongoing development resources; project delays or resource constraints could devalue the ACE token if game adoption lags expectations.
- Blockchain Network Risk: Dependency on BSC infrastructure exposes ACE to network congestion, validator attacks, or consensus mechanism failures that could disrupt trading and gameplay functionality.
VI. Conclusion and Action Recommendations
ACE Investment Value Assessment
Fusionist (ACE) represents a speculative position within the Web3 gaming sector, offering potential upside exposure to emerging blockchain entertainment infrastructure but carrying substantial downside risk. The token's 87.94% annual decline and current valuation 98.45% below ATH suggest either profound market disappointment in the project's execution or significant overselling creating asymmetric risk-reward opportunities for contrarian investors. The project's technical foundation (AAA quality through Unity and HDRP, anti-cheat mechanisms) demonstrates credible development effort, but commercialization success remains unproven. Investors should position ACE as a high-risk, speculative holding requiring rigorous position sizing and risk management discipline.
ACE Investment Recommendations
✅ Beginners: Initiate exposure through micro-position entry (0.5-1% of trading capital) on Gate.com, utilizing DCA accumulation during 10-15% price declines, with strict stop-loss discipline at 25-30% below entry points to manage learning-phase losses.
✅ Experienced Investors: Deploy 3-5% tactical allocations with active management, combining long-term core holdings with wave-trading strategies around identified support ($0.1045) and resistance ($0.2704) levels, employing technical analysis signals for entry/exit optimization.
✅ Institutional Investors: Consider thematic gaming sector exposure through 5-8% portfolio weighting, incorporating hedging strategies via stablecoin reserves and cross-sector diversification, with quarterly rebalancing protocols aligned with gaming adoption metrics and regulatory development.
ACE Trading Participation Methods
-
Gate.com Spot Trading: Execute direct ACE/USDT pairs with market, limit, and stop-loss order types for flexible entry and exit strategies across diverse market conditions and timeframes.
-
DCA Accumulation Programs: Establish automated recurring purchases through Gate.com to systematically build positions regardless of short-term price fluctuations, benefiting from long-term dollar-cost averaging without emotional decision-making.
-
Liquidity Mining and Staking: Monitor Gate.com for potential ACE liquidity incentive programs or blockchain-based staking opportunities that generate additional yield beyond price appreciation, enhancing risk-adjusted returns.
Cryptocurrency investments carry extreme risk. This report does not constitute investment advice. Investors must make independent decisions based on personal risk tolerance and should consult professional financial advisors. Never invest more capital than you can afford to lose completely. Past performance does not guarantee future results. The ACE token market remains highly speculative and illiquid.
FAQ
What is the ace price prediction for Binance?
ACE price prediction for next week ranges between $0.022041 and $0.024192, based on current market trends and technical analysis.
What is the share price target for Ace in 2030?
Based on current market analysis, the share price target for Ace in 2030 is projected to range between ₹3,478 and ₹3,860, reflecting anticipated growth and market conditions over the next five years.
What is ACE token and what is its current price?
ACE token is a cryptocurrency asset. As of December 20, 2025, ACE is trading below $0.000001, with a 24-hour price increase of 4.2%. ACE represents a digital token within the blockchain ecosystem.
What are the key factors that could influence ACE price in 2024-2025?
ACE price will be influenced by supply and demand dynamics, block reward changes, protocol updates, market sentiment, and real-world adoption rates. Trading volume and investor confidence also significantly impact price movements.
What are the risks associated with investing in ACE based on price predictions?
ACE investment risks include market volatility, company-specific factors, and economic downturns. Price predictions involve uncertainty from industry changes and broader market conditions. Diversify your portfolio accordingly.
* The information is not intended to be and does not constitute financial advice or any other recommendation of any sort offered or endorsed by Gate.