This comprehensive article analyzes Band Protocol (BAND) token price trends and investment opportunities from 2026 to 2031. BAND, currently trading at $0.3544 with a $60.34M market cap, serves as a decentralized data layer for DeFi, GameFi, and AI applications. The analysis combines historical price patterns, market dynamics, and ecosystem development to forecast price movements: conservative estimates range $0.23-$0.51 in 2026, with potential growth to $0.52-$0.90 by 2031. The article examines core influencing factors including blockchain adoption, macroeconomic conditions, and protocol upgrades, then provides tailored investment strategies for different investor profiles on Gate.com. Risk management frameworks, security solutions, and regulatory considerations are detailed to guide informed decision-making in this volatile yet emerging oracle infrastructure sector.
Introduction: BAND's Market Position and Investment Value
Band Protocol (BAND), positioned as a data layer that trains AI engines and powers blockchain applications, has been serving the crypto ecosystem since its launch in 2019. As of January 19, 2026, BAND maintains a market capitalization of approximately $60.34 million, with a circulating supply of around 170.26 million tokens, and a current price hovering near $0.35. This asset, recognized as a bridge between real-world data and blockchain infrastructure, is playing an increasingly vital role in empowering DeFi, GameFi, and AI agents with zero counterparty risk data access.
This article will comprehensively analyze BAND's price trends from 2026 to 2031, combining historical patterns, market supply-demand dynamics, ecosystem development, and macroeconomic conditions to provide investors with professional price forecasts and practical investment strategies.
I. BAND Price History Review and Market Status
BAND Historical Price Evolution Trajectory
- 2019: BAND launched on the market in September with an initial offering price of $0.473, experiencing early-stage price discovery and reaching a low point of $0.203625 in November
- 2021: During the broader cryptocurrency bull market, BAND reached its peak price of $22.83 in April, marking a significant milestone in the project's price history
- Recent Period: From the 2021 peak to the current price level, BAND has experienced substantial correction, with the price declining to $0.3544
BAND Current Market Situation
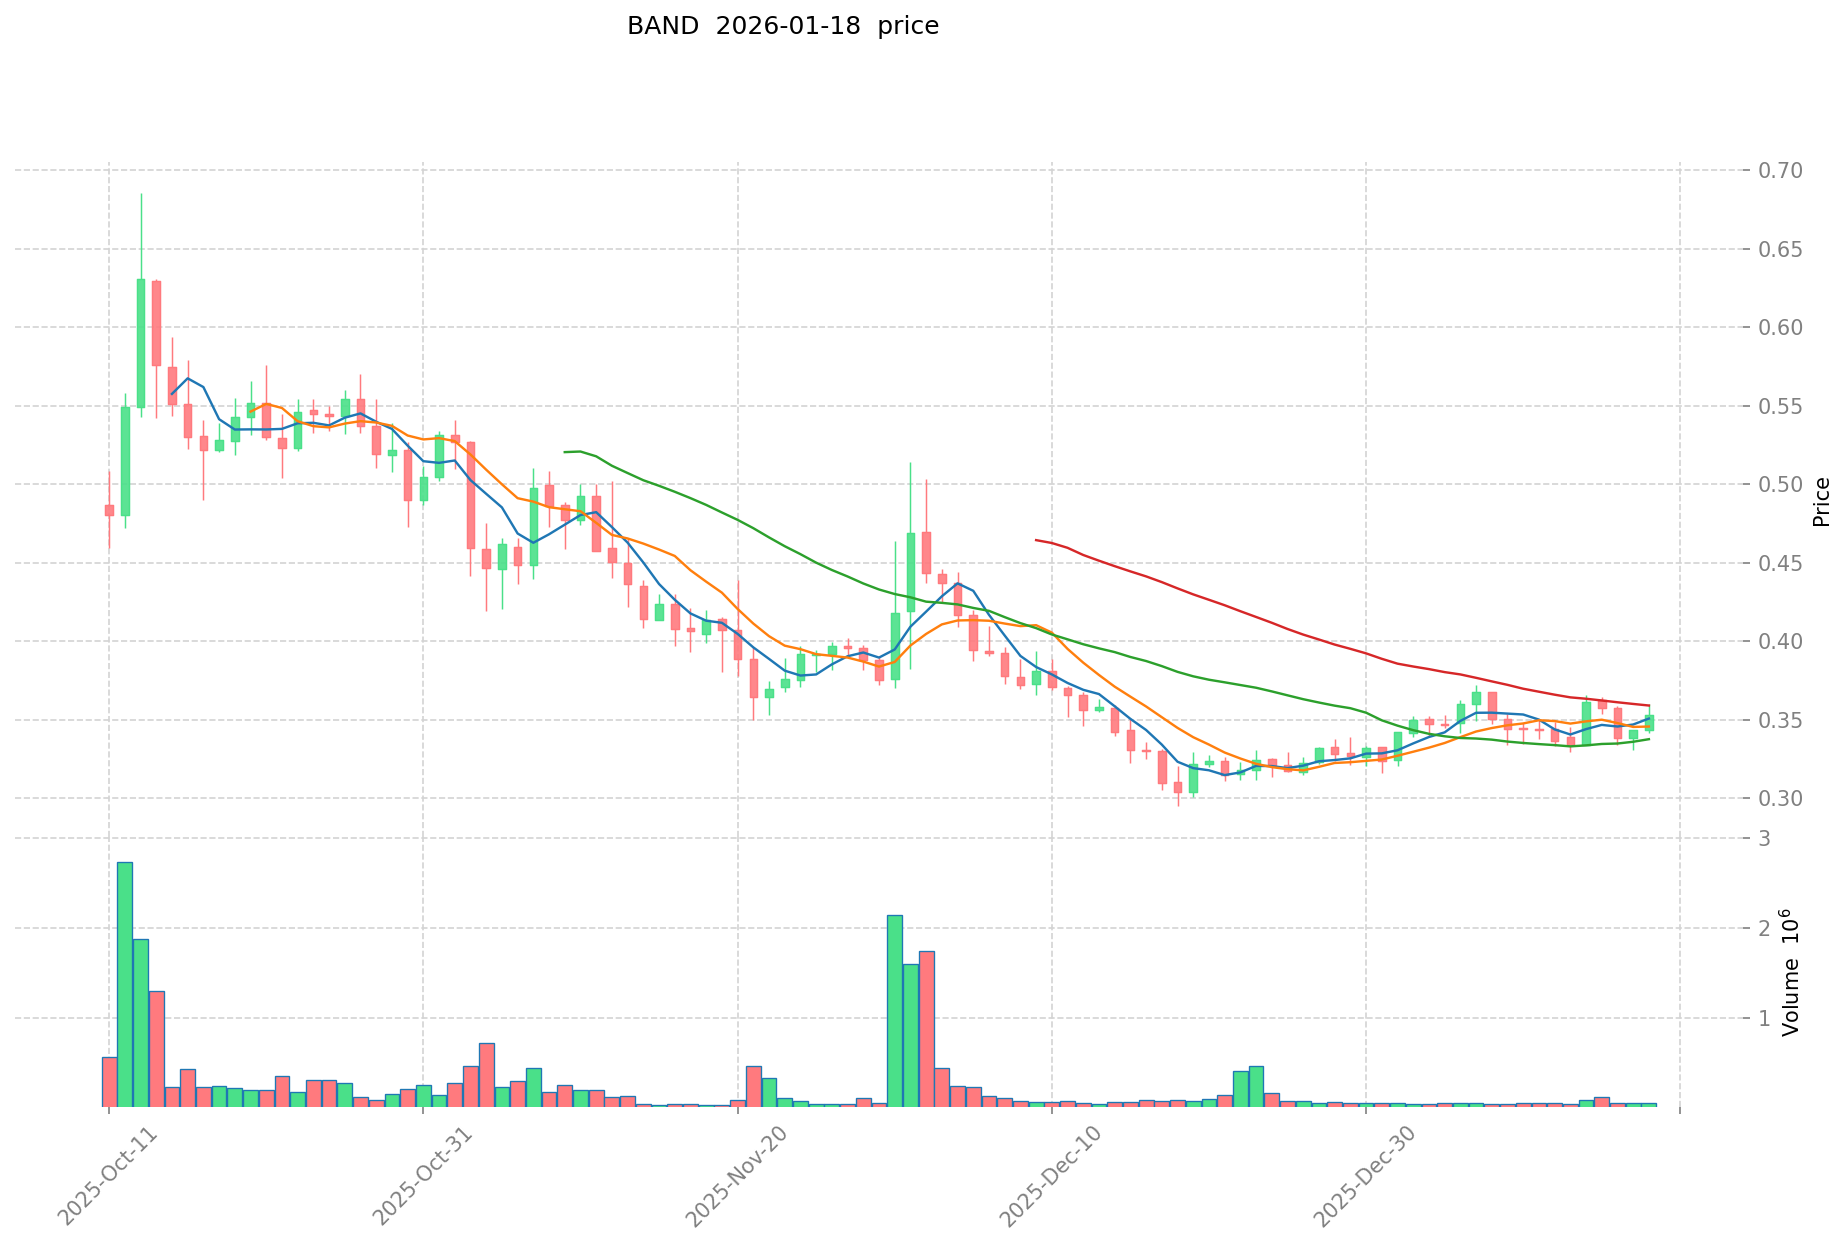
As of January 19, 2026, BAND is trading at $0.3544, showing a mixed performance across different timeframes. Over the past hour, the token has gained 0.37%, while the 24-hour period reflects a slight decline of 0.69%. The intraday trading range spans from $0.3445 to $0.3602.
Looking at broader timeframes, BAND demonstrates positive momentum with a 7-day gain of 4.25% and a 30-day increase of 9.15%. However, the annual performance shows a decline of 76.42%, indicating the token remains significantly below previous price levels.
The project currently holds a market capitalization of approximately $60.34 million, ranking 486th in the cryptocurrency market with a dominance of 0.0017%. The circulating supply stands at 170.26 million BAND tokens, representing 99.67% of the total supply of 170.83 million. The 24-hour trading volume amounts to $15,447.99, suggesting moderate market activity. BAND is available for trading on 30 exchanges and has a holder base of approximately 34,450 addresses.
The market sentiment indicator currently registers at 49 on the VIX scale, indicating a neutral market condition. The fully diluted market capitalization closely aligns with the current market cap at approximately $60.54 million, reflecting the high circulation ratio of tokens.
Click to view current BAND market price
BAND Market Sentiment Indicator
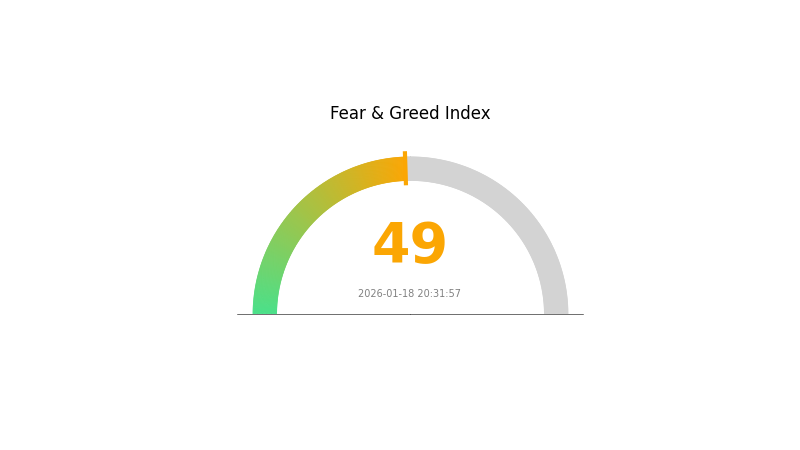
2026-01-18 Fear and Greed Index: 49 (Neutral)
Click to view the current Fear & Greed Index
The BAND market currently sits at a neutral sentiment level with a Fear and Greed Index reading of 49. This balanced position suggests market participants are maintaining a measured approach, neither driven by excessive fear nor unbridled greed. At this midpoint level, investors should exercise caution while remaining alert to potential opportunities. A neutral sentiment often precedes significant market movements, making it an important period for portfolio review and risk assessment on Gate.com.
BAND Holdings Distribution
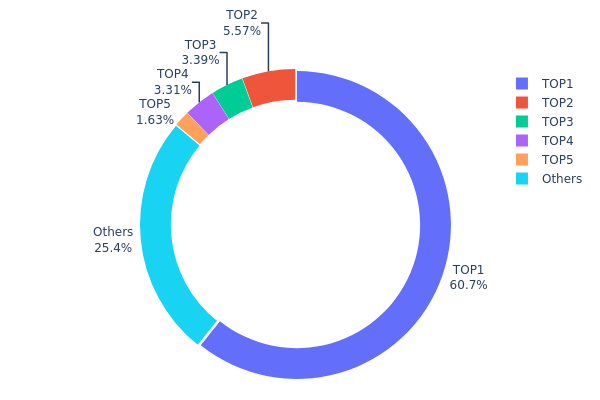
The holdings distribution chart reveals the allocation of BAND tokens across different wallet addresses, serving as a crucial indicator of decentralization and market structure. This metric helps assess concentration risk and potential market manipulation vulnerabilities by examining how tokens are distributed among top holders versus the broader community.
Based on current data, BAND exhibits significant concentration characteristics. The top address holds 60.74M tokens, accounting for 60.74% of total supply - a highly concentrated position that represents a dominant stake. The top five addresses collectively control approximately 74.62% of circulating supply, with the second through fifth largest holders ranging from 1.63M to 5.57M tokens. The remaining 25.38% is distributed among other addresses, indicating limited token dispersion beyond major holders.
This extreme concentration level presents notable implications for market dynamics. The dominant position of the largest holder creates potential single-point vulnerability, where significant price volatility could result from any substantial selling activity. Such centralization elevates manipulation risks and may deter institutional participation due to concerns about price stability and fair market conditions. The current distribution pattern suggests BAND operates in a relatively centralized structure, which could impact liquidity depth and increase susceptibility to coordinated market movements by major stakeholders.
Click to view current BAND Holdings Distribution
| Top |
Address |
Holding Qty |
Holding (%) |
| 1 |
0x7a62...595062 |
60747.28K |
60.74% |
| 2 |
0x4e91...7bae0e |
5568.37K |
5.56% |
| 3 |
0x7a59...c78e65 |
3389.09K |
3.38% |
| 4 |
0xf977...41acec |
3311.78K |
3.31% |
| 5 |
0x8cd2...d135b8 |
1631.84K |
1.63% |
| - |
Others |
25351.64K |
25.38% |
II. Core Factors Influencing BAND's Future Price
Market Trends and Adoption
- Blockchain Technology Adoption: The widespread adoption of blockchain technology serves as a fundamental driver for BAND's market performance. As more industries and applications integrate blockchain solutions, demand for oracle services and related infrastructure continues to expand.
- Market Demand Dynamics: BAND's price trajectory is closely tied to overall cryptocurrency market sentiment and trading volume. Increased market participation and growing interest in decentralized data solutions can create upward pressure on valuation.
- Technological Advancements: Continuous innovation in blockchain technology and oracle networks influences BAND's competitive position and utility value in the broader ecosystem.
Macroeconomic Environment
- Inflation and Monetary Policy: Macroeconomic factors such as inflation rates and central bank monetary policies can significantly impact cryptocurrency valuations. In environments where traditional currencies face inflationary pressures, digital assets may attract increased attention as alternative stores of value.
- Government Policies and Regulations: Regulatory frameworks and government attitudes toward cryptocurrencies play a substantial role in shaping market conditions. Policy clarity or uncertainty can drive significant price volatility across the digital asset sector.
- Economic Growth Patterns: Broader economic conditions, including growth momentum and recession risks, influence investor risk appetite and capital allocation to higher-risk assets like cryptocurrencies.
Ecosystem Development
- Network Upgrades: Protocol improvements and technical enhancements can strengthen BAND's functionality and network efficiency, potentially driving increased adoption and usage.
- Ecosystem Expansion: The growth of decentralized applications and projects utilizing BAND's oracle services contributes to the token's utility and demand dynamics.
- Integration Partnerships: Collaborations with other blockchain projects and traditional enterprises can expand BAND's use cases and market reach.
III. 2026-2031 BAND Price Prediction
2026 Outlook
- Conservative forecast: $0.23166 - $0.3564
- Neutral forecast: $0.3564 (average price level)
- Optimistic forecast: $0.50609 (requires favorable market conditions and increased adoption)
2027-2029 Outlook
- Market stage expectation: Gradual recovery and expansion phase with steadily increasing adoption of Band Protocol's oracle services
- Price range forecast:
- 2027: $0.23287 - $0.62962
- 2028: $0.31826 - $0.60999
- 2029: $0.33643 - $0.61013
- Key catalysts: Growing demand for decentralized oracle solutions, potential partnerships with DeFi protocols, and broader blockchain ecosystem development
2030-2031 Long-term Outlook
- Baseline scenario: $0.3423 - $0.59017 (assuming steady market growth and maintained protocol relevance)
- Optimistic scenario: $0.59017 - $0.7023 (assuming accelerated DeFi adoption and expanded use cases)
- Transformative scenario: $0.52991 - $0.89827 (assuming widespread oracle infrastructure adoption and significant technological breakthroughs)
- 2026-01-19: BAND trading analysis indicates potential for 66% growth by 2030 and 82% appreciation by 2031 compared to 2026 baseline levels
| Year |
Predicted High Price |
Predicted Average Price |
Predicted Low Price |
Price Change |
| 2026 |
0.50609 |
0.3564 |
0.23166 |
0 |
| 2027 |
0.62962 |
0.43124 |
0.23287 |
21 |
| 2028 |
0.60999 |
0.53043 |
0.31826 |
49 |
| 2029 |
0.61013 |
0.57021 |
0.33643 |
60 |
| 2030 |
0.7023 |
0.59017 |
0.3423 |
66 |
| 2031 |
0.89827 |
0.64624 |
0.52991 |
82 |
IV. BAND Professional Investment Strategy and Risk Management
BAND Investment Methodology
(1) Long-term Holding Strategy
- Target Investors: Investors seeking exposure to decentralized oracle infrastructure and data-layer solutions for blockchain applications, particularly those interested in DeFi, GameFi, and AI integration
- Operational Recommendations:
- Consider accumulating BAND during market corrections when the token trades below key support levels
- Monitor the project's developments in AI engine training and real-time data provision for autonomous AI systems
- Storage Solution: Gate Web3 Wallet provides secure storage options for BAND tokens with user-friendly interface and multi-chain support
(2) Active Trading Strategy
- Technical Analysis Tools:
- Volume Analysis: Monitor 24-hour trading volume (currently $15,447.99) to identify liquidity trends and potential breakout opportunities
- Support and Resistance Levels: Track the 24-hour range ($0.3445 - $0.3602) to establish entry and exit points
- Swing Trading Key Points:
- Capitalize on short-term price movements, noting the 7-day gain of 4.25% and 30-day gain of 9.15%
- Set stop-loss orders to manage downside risk, particularly given the 1-year decline of 76.42%
BAND Risk Management Framework
(1) Asset Allocation Principles
- Conservative Investors: 1-3% of crypto portfolio allocation
- Aggressive Investors: 3-7% of crypto portfolio allocation
- Professional Investors: 5-10% of crypto portfolio allocation with active management
(2) Risk Hedging Solutions
- Diversification Strategy: Balance BAND holdings with other oracle and data infrastructure tokens to reduce concentration risk
- Position Sizing: Given the relatively low market capitalization of $60.34 million, limit exposure to manage liquidity risks
(3) Security Storage Solutions
- Software Wallet Recommendation: Gate Web3 Wallet offers secure, non-custodial storage with easy access for trading on Gate.com
- Hardware Wallet Option: For large holdings, consider transferring to hardware wallets for enhanced security
- Security Precautions: Never share private keys or seed phrases; enable two-factor authentication; verify contract addresses before transactions (ETH: 0xBA11D00c5f74255f56a5E366F4F77f5A186d7f55)
V. BAND Potential Risks and Challenges
BAND Market Risks
- High Volatility: The token has experienced an annual decline of 76.42%, indicating substantial price volatility and market risk
- Low Market Cap: With a market capitalization of approximately $60.34 million and ranking at #486, BAND has relatively low liquidity compared to major cryptocurrencies
- Limited Exchange Listings: Trading on 30 exchanges may result in price discrepancies and reduced market depth
BAND Regulatory Risks
- Data Oracle Regulations: Evolving regulatory frameworks for blockchain data providers may impact Band Protocol's operational model
- Cross-chain Compliance: As Band Protocol serves multiple blockchains, it may face complex regulatory requirements across different jurisdictions
- AI Integration Scrutiny: Growing regulatory attention on AI systems and data usage could affect Band's AI-related services
BAND Technical Risks
- Oracle Attack Vectors: Data oracles face potential manipulation risks, particularly if data sources are compromised or validators collude
- Smart Contract Vulnerabilities: Like all blockchain projects, Band Protocol's smart contracts may contain undiscovered security flaws
- Competition: The oracle space includes numerous competitors, and technological advances by rivals could reduce Band Protocol's market share
VI. Conclusion and Action Recommendations
BAND Investment Value Assessment
Band Protocol represents a specialized infrastructure play in the blockchain data layer space, particularly focused on serving DeFi, GameFi, and AI applications. While the project offers unique value propositions in connecting real-time data to blockchain applications and AI engines with zero counterparty risk, investors should carefully weigh the substantial year-over-year price decline of 76.42% against recent positive momentum (30-day gain of 9.15%). The relatively low market capitalization and moderate liquidity present both opportunity and risk, requiring careful position management and risk assessment.
BAND Investment Recommendations
✅ Beginners: Start with minimal allocation (under 2% of crypto portfolio); use Gate.com for trading and Gate Web3 Wallet for secure storage; focus on understanding the oracle sector before increasing exposure
✅ Experienced Investors: Consider a 3-5% allocation as part of a diversified infrastructure portfolio; actively monitor developments in Band Protocol's AI and data services; employ technical analysis to optimize entry points
✅ Institutional Investors: Conduct thorough due diligence on Band Protocol's technology stack and competitive positioning; consider strategic allocation of 5-7% with active risk management protocols; evaluate long-term potential in the growing oracle and AI data market
BAND Trading Participation Methods
- Spot Trading: Purchase BAND directly on Gate.com with competitive fees and deep liquidity
- Dollar-Cost Averaging: Implement systematic buying strategies to reduce timing risk and average entry prices over time
- Strategic Accumulation: Monitor market conditions and accumulate positions during periods of market weakness or positive development announcements
Cryptocurrency investments carry extremely high risks. This article does not constitute investment advice. Investors should make prudent decisions based on their own risk tolerance and are advised to consult professional financial advisors. Never invest more than you can afford to lose.
FAQ
What is Band Protocol (BAND) and what are its main use cases?
Band Protocol is a decentralized oracle network providing real-world data to blockchains. Main use cases include enabling smart contracts to access external data, enhancing blockchain interoperability, and supporting DApp development. BAND token powers the network through governance, staking, and validator collateral.
What are the key factors that could influence BAND token price in the future?
Whale activity, market demand, adoption growth, overall cryptocurrency market sentiment, and trading volume are primary factors influencing BAND token price movements.
BAND has experienced price fluctuations historically. Experts predict BAND could reach $0.39006992 by end of 2026 and $0.39690838 by 2027, representing optimistic growth from current levels.
* The information is not intended to be and does not constitute financial advice or any other recommendation of any sort offered or endorsed by Gate.