This article delves into GraphAI (GAI), focusing on its role as a transformative AI-native data layer within Web3. It analyzes GAI's price movements and market dynamics through 2030, offering detailed insights into its investment potential. Readers will find expert forecasts, historical price reviews, and a strategic investment framework tailored for diverse investor profiles. The content is structured for easy scanning, addressing the needs of those seeking a comprehensive understanding of GAI, its market influence, and future prospects.
Introduction: GAI's Market Position and Investment Value
GraphAI (GAI) is building the AI-native data layer for Web3, transforming raw blockchain events into structured, queryable knowledge graphs. Since its launch, GAI has established itself as a connective bridge between blockchain infrastructure and artificial intelligence. As of December 2025, GAI's market capitalization has reached $2,636,900, with a circulating supply of 70 million tokens and a price maintained around $0.03767.
This innovative asset, positioned as Web3's intelligence network fuel, is playing an increasingly critical role in enabling applications, agents, and enterprises to access contextual insights through natural language processing. GraphAI's flagship product, GraphEngine, supports large-scale subgraph creation, querying, and analysis across leading ecosystems including Base, Ethereum, and the Artificial Superintelligence Alliance.
This article will provide a comprehensive analysis of GAI's price movements and market dynamics, combining historical patterns, market supply and demand factors, and ecosystem developments to deliver professional price forecasts and practical investment guidance for the period through 2030.
GraphAI (GAI) Market Analysis Report
I. GAI Price History Review and Current Market Status
GAI Historical Price Evolution
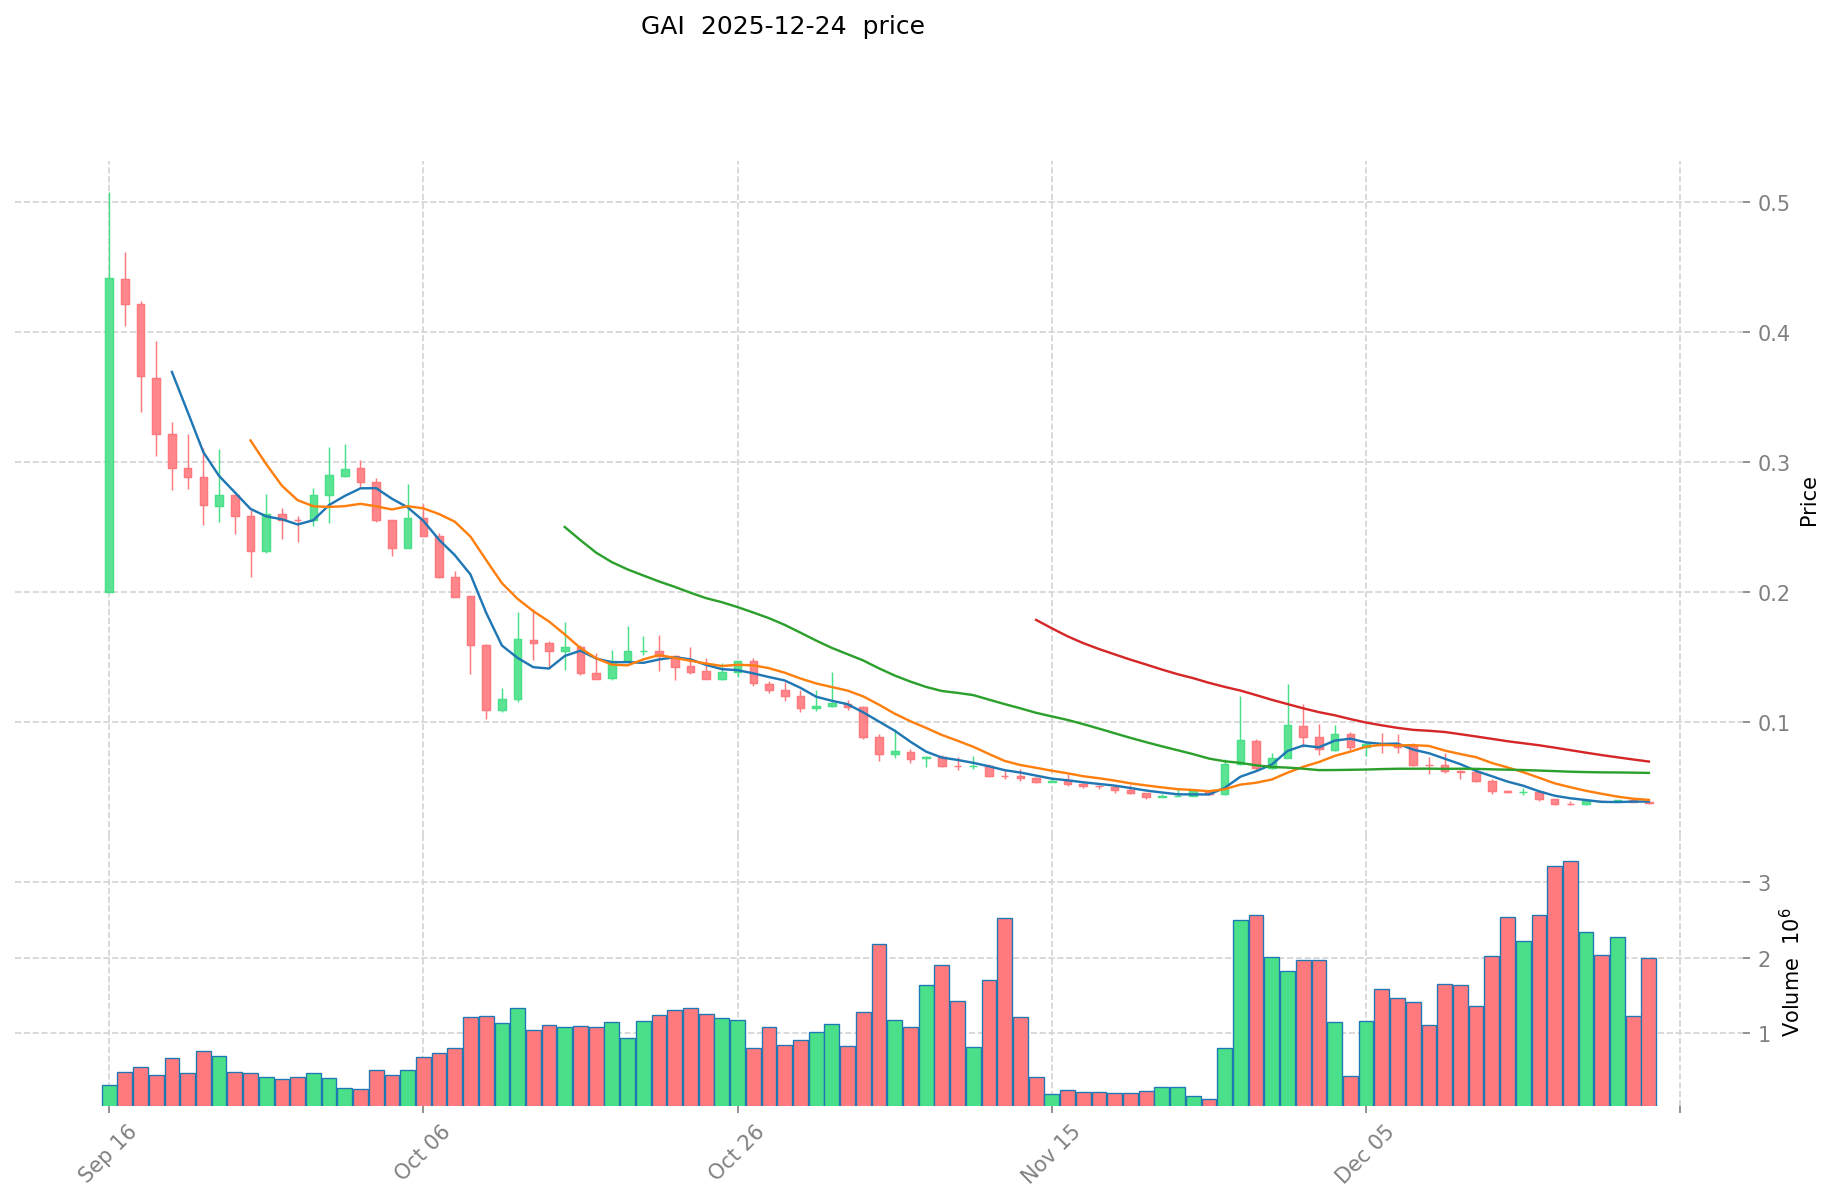
Based on available data, GraphAI (GAI) has experienced significant volatility since its launch:
- September 16, 2025: All-Time High (ATH) reached at $0.5078, marking the peak of market enthusiasm for the project
- December 19, 2025: All-Time Low (ATL) recorded at $0.036, indicating substantial market correction
- Current Period (December 2025): Price trading in recovery phase with volatile movements
GAI Current Market Situation
As of December 25, 2025, GraphAI (GAI) is trading at $0.03767, representing a -2.77% decline over the past 24 hours. However, the token demonstrates resilience with a +0.44% gain in the last hour and a +0.96% increase over the 7-day period.
Market Metrics:
- Market Capitalization: $2,636,900 USD
- Fully Diluted Valuation (FDV): $3,767,000 USD
- 24-Hour Trading Volume: $24,595.18 USD
- Circulating Supply: 70,000,000 GAI tokens (70% of total supply)
- Total Supply: 100,000,000 GAI tokens
- Market Dominance: 0.00011%
Price Range (24H):
- High: $0.03886
- Low: $0.03616
Extended Performance Metrics:
- 30-Day Change: -21.16% (showing extended downtrend)
- 1-Year Change: +3,884.18% (exceptional long-term gains since inception)
The token maintains a holder base of 7,318 addresses and is currently available for trading on Gate.com platform. Market sentiment indicators suggest "Extreme Fear" conditions (VIX: 24), which typically precedes potential recovery opportunities in cryptocurrency markets.
Visit GraphAI (GAI) Market Price on Gate.com for real-time quotes
GAI Market Sentiment Index
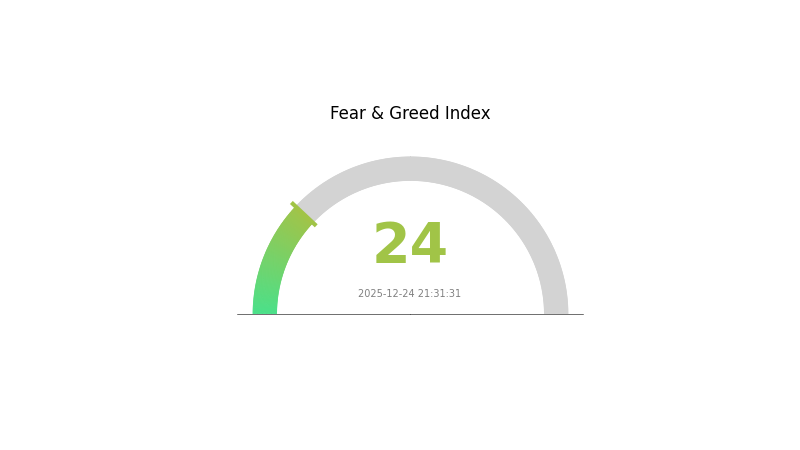
2025-12-24 Fear and Greed Index: 24 (Extreme Fear)
Click to view current Fear & Greed Index
The crypto market is currently experiencing extreme fear with an index reading of 24. This significantly low reading indicates severe market pessimism and heightened risk aversion among investors. During such periods, market volatility tends to increase as panic selling dominates. However, contrarian investors often view extreme fear as a potential buying opportunity, as assets may be oversold. Traders should exercise caution and conduct thorough risk assessment before making investment decisions during these highly uncertain market conditions.
GAI Holdings Distribution
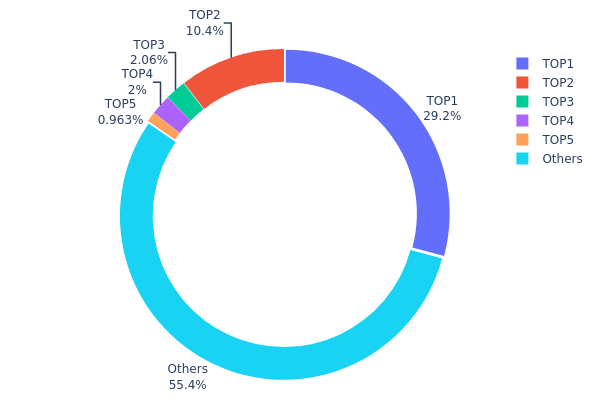
The holdings distribution chart illustrates the concentration of GAI tokens across blockchain addresses, serving as a critical indicator of token ownership structure and potential centralization risks. By analyzing the top holders and their respective proportions, market participants can assess the level of decentralization and evaluate whether significant risks exist from large stakeholders.
Current data reveals a moderate concentration pattern in GAI's address distribution. The top holder commands 29.17% of total supply, while the second-largest holder controls 10.42%, collectively representing 39.59% of all circulating tokens. The concentration becomes more pronounced when examining the top five addresses, which together account for 44.6% of the token supply. This distribution suggests that while the token maintains a reasonably diverse holder base—with the remaining 55.4% distributed across other addresses—notable concentration among the largest stakeholders exists. Such a structure indicates that decision-making power is partially concentrated, though not extremely so compared to more centralized tokens.
This concentration pattern carries implications for market dynamics and price stability. The significant holdings by top addresses create potential for substantial sell pressure should these holders choose to liquidate positions, which could trigger price volatility. However, the majority of tokens distributed among numerous smaller holders suggests some resistance to extreme price manipulation. The current distribution reflects a market still in transition toward greater decentralization, with established early participants maintaining substantial positions while the broader community gradually accumulates exposure to the asset.
Click to view current GAI Holdings Distribution
| Top |
Address |
Holding Qty |
Holding (%) |
| 1 |
0xb5d7...e0fe3b |
29176.79K |
29.17% |
| 2 |
0xf3d4...d58355 |
10423.40K |
10.42% |
| 3 |
0xeec5...0f6d0c |
2055.49K |
2.05% |
| 4 |
0x4e3a...a31b60 |
2001.84K |
2.00% |
| 5 |
0x6da9...3e4bf6 |
962.80K |
0.96% |
| - |
Others |
55379.68K |
55.4% |
II. Core Factors Influencing GAI's Future Price
Macroeconomic Environment
-
Monetary Policy Impact: The Federal Reserve's policy trajectory represents a critical price driver for GAI. Following three consecutive rate cuts from September to December 2025, bringing the federal funds rate to 3.50%-3.75%, market expectations for 2026 suggest only one to two additional 25 basis point cuts. This more cautious monetary stance, combined with internal Fed dissent (7 officials opposed December's rate cut), indicates a potential slowdown in monetary easing compared to prior periods. The appointment of a new Fed Chair in early 2026 introduces additional uncertainty, though candidates are perceived as dovish-leaning, potentially supporting softer policy conditions that could benefit risk assets including cryptocurrencies.
-
Inflation Hedge Properties: In an environment where inflation remains sticky despite rate cuts, with corporate expectations showing average price increases of 4.2% anticipated for 2026 (well above the Fed's 2% target), GAI's properties as a hedge against currency devaluation and inflation gain relevance. Global central banks' continuous large-scale gold purchases demonstrate institutional recognition of precious metals' inflation-protection value, a dynamic that extends to cryptocurrency assets perceived as alternative stores of value.
-
Geopolitical Factors: Escalating geopolitical tensions—including Middle East conflicts, Russia-Ukraine peace negotiation stalled progress, and Venezuela-related international friction—create an environment where risk-off sentiment strengthens demand for safe-haven assets. These uncertainties historically correlate with increased interest in alternative asset classes, including digital assets positioned as decentralized stores of value.
Macroeconomic Outlook for 2026
-
Global Economic Divergence: The "multi-speed parallel" monetary policy framework emerging across major developed economies creates distinct investment landscapes. The U.S. economy is projected to grow 2.3% in 2026 (up from 1.7% in 2025), while Eurozone growth is expected at 1.2% and Japan's at 0.7%. This divergence in economic trajectories may drive capital flows toward jurisdictions with more favorable policy conditions, potentially benefiting cryptocurrencies in regions with dovish central banks.
-
Central Bank Policy Coordination Breakdown: Unlike 2024's synchronized easing, 2026 features fragmented approaches: the Federal Reserve and Bank of England may continue modest rate cuts, the ECB maintains a neutral stance, and the Bank of Japan pursues cautious rate increases. This policy fragmentation reduces coordinated liquidity injections that previously supported broad risk-asset rallies, introducing new price discovery challenges for speculative assets.
Three、2025-2030 GAI Price Forecast
2025 Outlook
- Conservative Forecast: $0.03353 - $0.03767
- Neutral Forecast: $0.03767
- Optimistic Forecast: $0.04407 (requires sustained market momentum and positive ecosystem developments)
2026-2028 Mid-term Outlook
- Market Stage Expectations: Gradual accumulation phase with incremental growth potential as the project matures and adoption expands
- Price Range Predictions:
- 2026: $0.03678 - $0.0421
- 2027: $0.03775 - $0.04605
- 2028: $0.03676 - $0.05865
- Key Catalysts: Ecosystem expansion, increased utility adoption, potential protocol upgrades, and growing institutional interest in emerging digital assets
2029-2030 Long-term Outlook
- Base Scenario: $0.03431 - $0.0635 (assumes moderate adoption growth and stable market conditions)
- Optimistic Scenario: $0.05121 - $0.07743 (assumes accelerated ecosystem development and mainstream blockchain integration)
- Transformative Scenario: $0.07743+ (extreme favorable conditions including widespread enterprise adoption and breakthrough technological innovations)
- 2030-12-25: GAI at projected average of $0.05735 (potential milestone year representing 52% cumulative growth from 2025 baseline)
Note: Price predictions are based on historical data analysis and market trend modeling. Investors should conduct thorough due diligence on Gate.com and monitor market developments closely, as cryptocurrency markets remain highly volatile and subject to regulatory, technological, and macroeconomic influences.
| 年份 |
预测最高价 |
预测平均价格 |
预测最低价 |
涨跌幅 |
| 2025 |
0.04407 |
0.03767 |
0.03353 |
0 |
| 2026 |
0.0421 |
0.04087 |
0.03678 |
8 |
| 2027 |
0.04605 |
0.04149 |
0.03775 |
10 |
| 2028 |
0.05865 |
0.04377 |
0.03676 |
16 |
| 2029 |
0.0635 |
0.05121 |
0.03431 |
35 |
| 2030 |
0.07743 |
0.05735 |
0.05448 |
52 |
GraphAI (GAI) Professional Investment Strategy and Risk Management Report
IV. GAI Professional Investment Strategy and Risk Management
GAI Investment Methodology
(1) Long-term Holding Strategy
- Suitable for: Investors seeking exposure to AI-native blockchain infrastructure with medium to long-term horizon (12+ months)
- Operation Recommendations:
- Accumulate GAI tokens gradually during market downturns, leveraging dollar-cost averaging to reduce timing risk
- Hold tokens through market cycles to capture potential upside as GraphAI's ecosystem matures and adoption expands
- Stake GAI tokens to earn network rewards while maintaining long-term exposure to the protocol
(2) Active Trading Strategy
- Technical Analysis Tools:
- Moving Averages (20-day and 50-day): Identify trend direction; buy when price is above both averages, sell when below
- RSI (Relative Strength Index): Use 30-70 levels for overbought/oversold conditions; trade reversals at extremes
- Wave Trading Key Points:
- Monitor 24-hour and 7-day price movements; GAI shows -2.77% in 24h but +0.96% in 7d, indicating short-term volatility
- Set stop-loss orders at -15% from entry to manage downside risk during volatile periods
GAI Risk Management Framework
(1) Asset Allocation Principles
- Conservative Investors: 2-5% of portfolio allocation to GAI
- Active Investors: 5-10% of portfolio allocation to GAI
- Professional Investors: 10-15% of portfolio allocation to GAI
(2) Risk Hedging Solutions
- Portfolio Diversification: Balance GAI holdings with established cryptocurrencies and stablecoins to reduce concentration risk
- Profit Taking: Establish predetermined price targets and take profits at 30%, 50%, and 100%+ gains to lock in returns
(3) Secure Storage Solutions
- Hardware Wallet Method: Use institutional-grade hardware wallets for amounts exceeding $10,000
- Web wallet Method: Utilize Gate.com Web3 Wallet for active trading and frequent access, with multi-signature authentication enabled
- Security Best Practices: Enable two-factor authentication, use unique passwords, regularly audit wallet permissions, and never share private keys
V. GAI Potential Risks and Challenges
GAI Market Risk
- High Volatility: GAI experienced a 30-day decline of -21.16% and is trading 92.6% below its all-time high of $0.5078 (reached September 16, 2025), indicating significant price uncertainty
- Low Trading Volume: Daily volume of $24,595.17 relative to market cap suggests limited liquidity, which could amplify price swings during large trades
- Market Sentiment Risk: Current market emotion indicators and relatively low holder count (7,318 addresses) suggest concentration risk among early stakeholders
GAI Regulatory Risk
- Emerging Protocol Classification: As an AI-native data layer project, regulatory clarity on how GraphAI's indexing and AI reasoning components are classified remains uncertain across jurisdictions
- Changing Data Privacy Laws: Potential future regulations on on-chain data aggregation and knowledge graph construction could impact operational scope
- Web3 Compliance Uncertainty: Evolving regulatory frameworks around decentralized indexing services and AI integration with blockchain may require significant protocol adjustments
GAI Technology Risk
- Protocol Scalability: GraphEngine's ability to handle massive subgraph creation and real-time analysis at scale has not been stress-tested across all major blockchain networks
- Integration Dependency: Reliance on Base, Ethereum, and other ecosystem integrations means network outages or protocol changes could impact functionality
- AI Model Reliability: Accuracy and reliability of AI-driven contextual insights are subject to model training quality and may contain biases or errors
VI. Conclusion and Action Recommendations
GAI Investment Value Assessment
GraphAI presents a compelling thesis as an AI-native data layer addressing the convergence of blockchain and artificial intelligence. The project's focus on transforming raw blockchain events into queryable knowledge graphs fills a critical infrastructure gap in Web3. However, investors must acknowledge the early-stage nature of the protocol, evidenced by -21.16% monthly performance, 92.6% decline from ATH, and limited liquidity. The fundamentals around AI reasoning integration and ecosystem partnerships (Base, Ethereum, Artificial Superintelligence Alliance) suggest long-term potential, but near-term volatility and execution risks are substantial.
GAI Investment Recommendations
✅ Beginners: Start with small allocations (2-5% of crypto portfolio) using dollar-cost averaging over 3-6 months; prioritize understanding the project's technology before increasing position size
✅ Experienced Investors: Consider 5-10% portfolio allocation with a 12-18 month holding horizon; actively monitor GraphEngine adoption metrics and ecosystem integration milestones; use technical indicators to optimize entry points
✅ Institutional Investors: Evaluate 10-15% allocation as a strategic bet on AI-blockchain infrastructure; require detailed due diligence on GraphEngine's technical capabilities and competitive moat; consider staking mechanisms for yield generation
GAI Trading Participation Methods
- Trading on Gate.com: Access GAI/USDT trading pair on Gate.com with real-time charting tools and advanced order types for active management
- Staking Programs: Participate in network staking to earn protocol rewards while maintaining long-term exposure to token appreciation
- Ecosystem Participation: Engage with GraphAI's indexing and querying services on Base and Ethereum to gain hands-on experience with the protocol's functionality
Cryptocurrency investment carries extreme risk. This report does not constitute investment advice. Investors must make decisions based on their individual risk tolerance and should consult professional financial advisors. Never invest more capital than you can afford to lose completely.
FAQ
What is GAI and what is its current price?
GraphAI (GAI) is a blockchain-based artificial intelligence token. As of December 24, 2025, GAI is trading at $0.03863, reflecting recent market activity. GAI represents the growing intersection of AI technology and decentralized finance within the Web3 ecosystem.
What are expert price predictions for GAI in 2025?
Expert predictions for GAI in 2025 estimate an average price of $0.03858, with a high of $0.04783 and a low of $0.02121, based on comprehensive market analysis and technical evaluation.
What factors could influence GAI's price growth potential?
GAI's price growth potential is driven by market demand, technological innovations, adoption rates, regulatory developments, and overall crypto market trends. Trading volume, ecosystem expansion, and investor sentiment also significantly impact price movements.
* The information is not intended to be and does not constitute financial advice or any other recommendation of any sort offered or endorsed by Gate.