The article delves into the price prediction and market forecast for the Mayflower (MAY) token within the Solana ecosystem. It presents an overview of MAY's technological innovation in AI-driven DeFi interactions, analyzing its historical price movement, current market status, and factors impacting future price trajectories through 2030. The piece addresses investment strategies and risk management considerations, targeting investors interested in Solana's AI-empowered DeFi landscape. Emphasizing practical insights on market sentiment, macroeconomic influences, and potential challenges, the report serves as a comprehensive guide for both novice and experienced crypto investors.
Introduction: MAY's Market Position and Investment Value
Mayflower (MAY) is an AI-powered assistant layer built on Solana that transforms how users interact with decentralized finance. By leveraging cutting-edge large language models, MAY converts natural language requests into real-time onchain actions, automating tasks and navigating decentralized applications to streamline multichain exploration. Since its launch in November 2025, Mayflower has established itself as an innovative solution within the Solana ecosystem, seamlessly integrating with top protocols to enhance user onboarding and DeFi engagement.
As of December 25, 2025, MAY commands a market capitalization of approximately $13.09 million with a circulating supply of 217.2 million tokens, trading at around $0.01309 per token. The token represents a novel approach to democratizing blockchain interaction through AI assistance, positioning itself as a critical tool for users seeking clarity, confidence, and efficiency in navigating complex DeFi environments.
This article provides a comprehensive analysis of MAY's price trajectory and market dynamics through 2030, integrating historical price patterns, market supply-demand fundamentals, ecosystem development milestones, and macroeconomic factors to deliver professional price forecasts and actionable investment strategies for stakeholders considering exposure to this emerging AI-driven asset on the Solana network.
Mayflower (MAY) Market Analysis Report
I. MAY Price History Review and Current Market Status
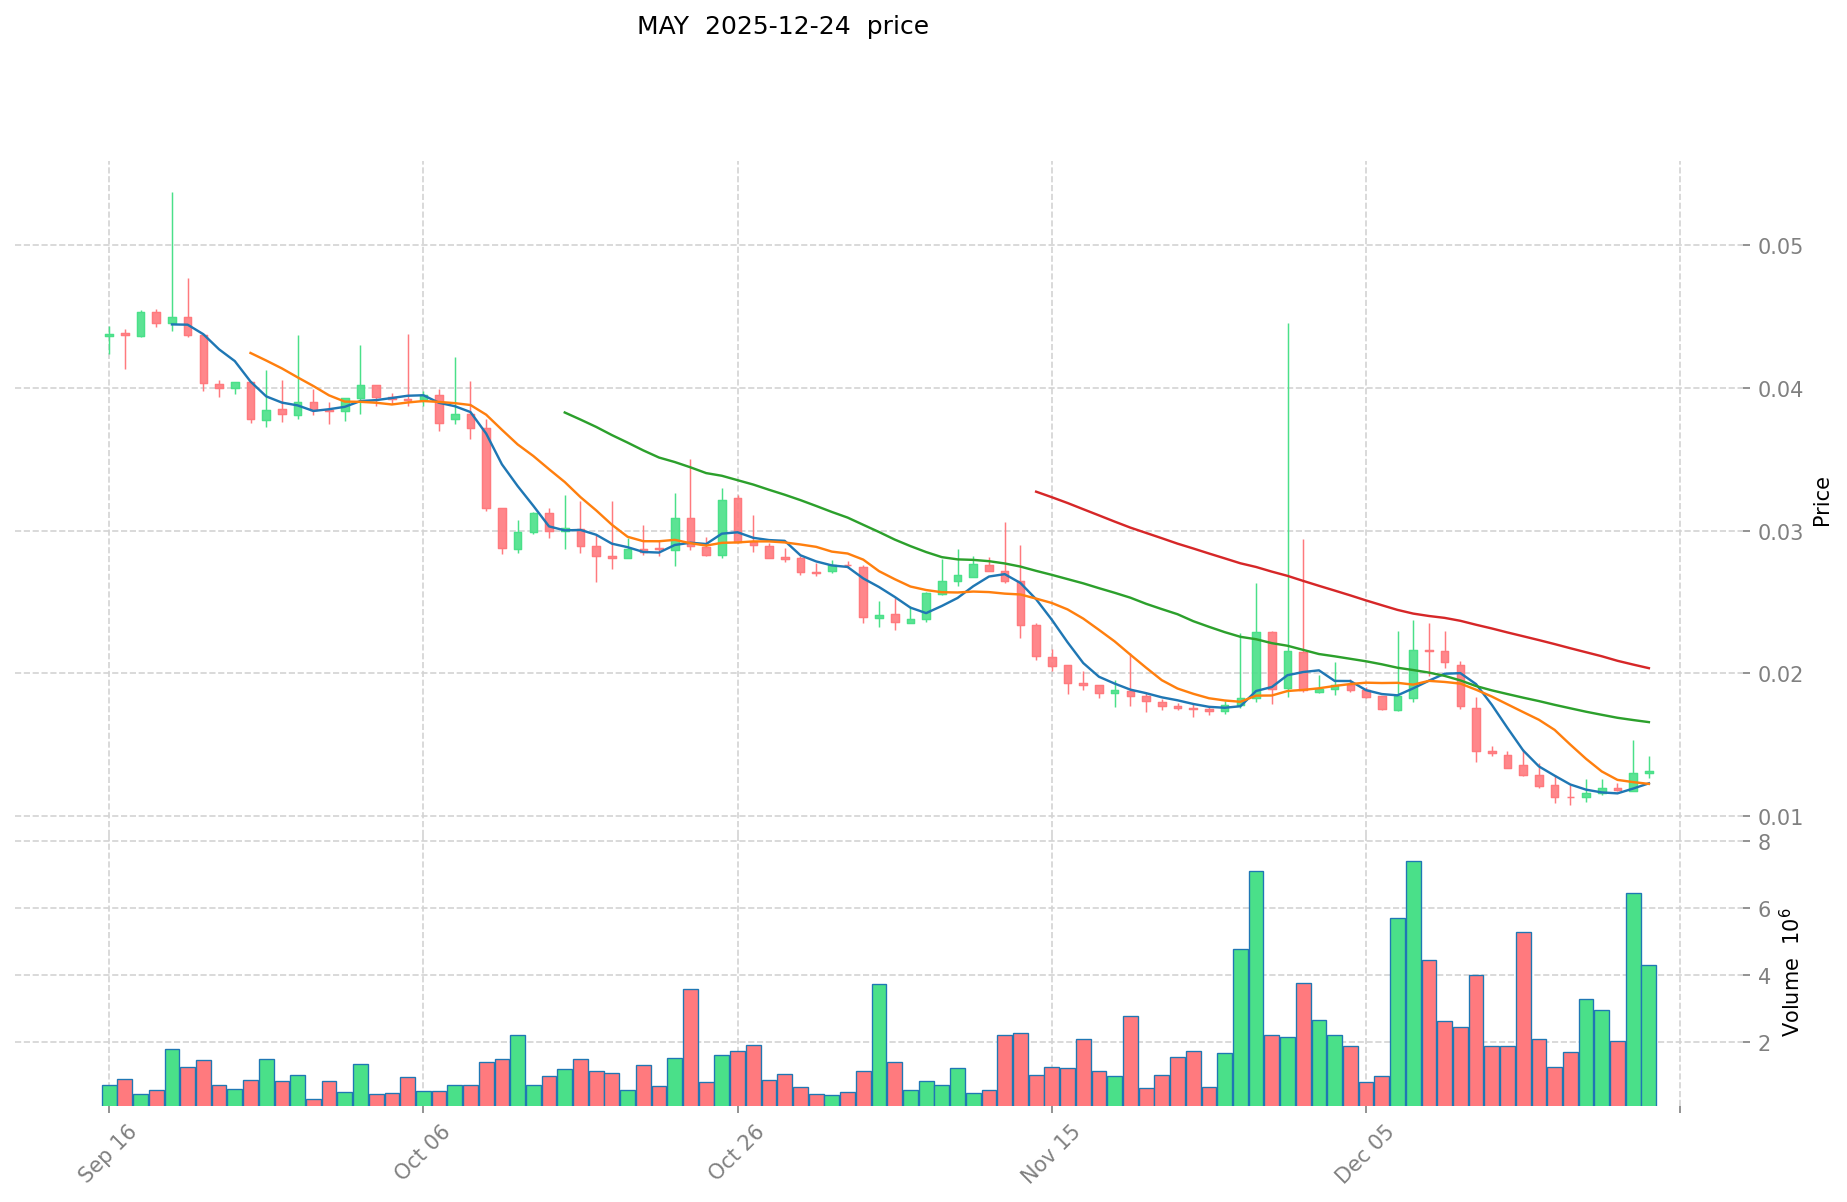
MAY Historical Price Movement Trajectory
Based on available data, Mayflower (MAY) was published on November 29, 2025. Since its launch:
- November 29, 2025: Project launch at initial price point
- December 4, 2025: Reached all-time high (ATH) of $0.07318, marking peak market optimism in early trading phase
- December 18, 2025: Declined to all-time low (ATL) of $0.01074, representing significant downward pressure within approximately three weeks of launch
- December 25, 2025: Trading at $0.01309, recovering slightly from the low but remaining well below the ATH
MAY Current Market Status
As of December 25, 2025, MAY is trading at $0.01309 with a 24-hour trading volume of $31,447.01. The token exhibits bearish short-term momentum with a -3.27% decline over the past 24 hours and a -0.38% drop in the last hour. However, the 7-day price action shows +7.38% gains, suggesting some recovery momentum from recent lows.
The market capitalization stands at $2.84 million against a fully diluted valuation of $13.09 million, indicating that only 21.72% of the total supply is currently in circulation. With 217.2 million tokens circulating out of a maximum supply of 1 billion tokens, the project maintains substantial room for future token releases.
Currently, MAY is listed on 5 exchanges with a holder base of 336 addresses. The token ranks #1906 by market capitalization, representing a mid-tier position in the broader cryptocurrency market. Market sentiment reflects extreme fear conditions (VIX reading of 24), suggesting heightened investor caution across the sector.
The year-to-date performance shows a dramatic -93.087% decline from launch to current levels, highlighting significant volatility during the project's initial trading period. The 30-day performance reflects -23.76% depreciation, indicating sustained selling pressure throughout December.
Check current MAY market price
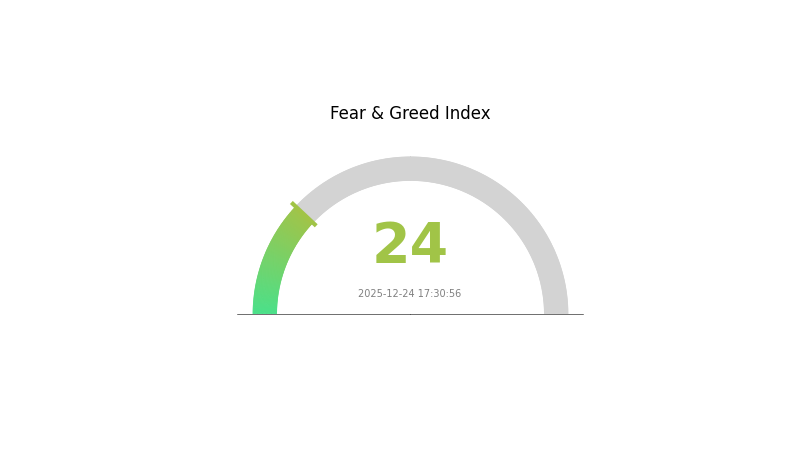
Market Sentiment Indicator
2025-12-24 Fear and Greed Index: 24 (Extreme Fear)
Click to view current Fear & Greed Index
The cryptocurrency market is currently experiencing extreme fear, with the Fear and Greed Index at 24. This reading indicates significant market pessimism and heightened risk aversion among investors. During periods of extreme fear, volatility tends to increase substantially, and prices often reach lower levels. Experienced traders may view this as a potential accumulation opportunity, while conservative investors should exercise caution. Market recovery typically requires positive catalysts and improved sentiment. Monitor key support levels and fundamental developments closely before making investment decisions.
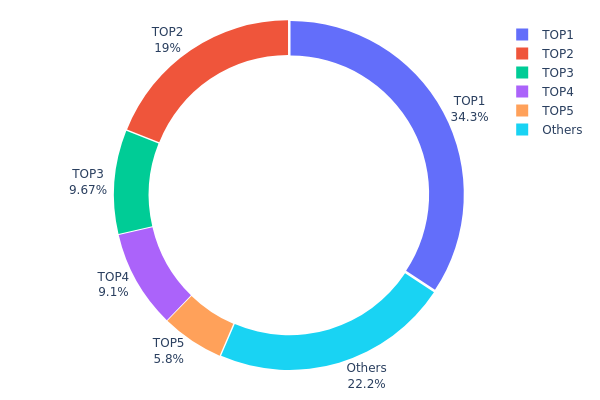
MAY Holdings Distribution
The holdings distribution chart illustrates the concentration of MAY tokens across on-chain addresses, revealing the ownership structure and capital allocation patterns within the ecosystem. By analyzing the top holders and their proportional stake, this metric provides critical insights into token liquidity, market structure stability, and potential systemic risks associated with token concentration.
MAY currently exhibits pronounced concentration characteristics, with the top four addresses controlling approximately 71.03% of the total token supply. The leading address alone commands 34.30% of all MAY tokens, representing a significant concentration point that warrants close attention. The second and third largest holders contribute an additional 18.96% and 9.67% respectively, while the fourth holder accounts for 9.10%. This tiered concentration pattern indicates that decision-making power and market influence are concentrated among a limited number of actors. The remaining 22.17% distributed across other addresses demonstrates that while a substantial minority of tokens are dispersed, the majority remain in few hands, suggesting a relatively immature distribution phase typical of emerging tokens.
This level of concentration presents material implications for market dynamics. High token concentration elevates the potential for significant price volatility, as large holders possess the capacity to execute substantial transactions that could move markets. Additionally, concentrated ownership structures may present elevated risks of market manipulation or coordinated selling pressure. The current distribution reflects a market structure that has not yet achieved optimal decentralization, with governance and price discovery mechanisms potentially vulnerable to the influence of major stakeholders. For investors and ecosystem participants, monitoring shifts in this distribution pattern becomes essential, as gradual decentralization through trading activity and community adoption would represent a positive structural development.
Click to view current MAY holdings distribution
| Top |
Address |
Holding Qty |
Holding (%) |
| 1 |
E6egfb...FixiJn |
343066.86K |
34.30% |
| 2 |
8Mm46C...zrMZQH |
189658.38K |
18.96% |
| 3 |
7W4fSR...AbiWWi |
96713.24K |
9.67% |
| 4 |
Ap1wy7...vuwhzH |
91017.99K |
9.10% |
| 5 |
4KEmyu...LQXnvz |
58000.00K |
5.80% |
| - |
Others |
221541.82K |
22.17% |
II. Core Factors Impacting MAY's Future Price
Macroeconomic Environment
-
Monetary Policy Impact: U.S. Federal Reserve policy decisions, particularly interest rate changes, are critical to MAY's price trajectory. The Fed has implemented consecutive 25 basis point rate cuts, adjusting the target rate range to 3.50%-3.75%. Market expectations regarding 2026 inflation decline and economic growth slowdown will serve as core drivers of future rate curve movements. Historical data shows that in 15 past policy cycles, stock markets recorded gains in the year following the Fed's final rate cut, with average returns reaching 16.5%.
-
Policy Uncertainty and Fiscal Dynamics: U.S. economic policy uncertainty has approached historic highs in early 2025, creating substantial market impact. Tariff policy volatility and contradictory policy signals have raised effective tariff rate expectations to approximately 17%, the highest level since 1950. Government debt issuance is expanding globally while central banks reduce bond purchases, creating upward pressure on yields, particularly at the long end. The "Big and Beautiful Act" establishes a multi-year fiscal expansion path, projected to add approximately 3.4 trillion USD in cumulative deficits during 2025-2034.
-
Inflation Hedging Properties: Among 38 OECD member nations, only 7 currently maintain inflation rates at or below 2%. However, analysts project that inflation, while important, will not serve as a major market disruptor in 2026. Traditional "cash alternative assets" demonstrated resilience and recorded substantial gains in 2025: gold appreciated approximately 65%, while global investment-grade bonds gained 7.9%.
-
Geopolitical Factors: Ongoing Ukraine conflict shows no signs of resolution, with Russian leadership signaling commitment to strategic objectives. Additional geopolitical tensions have emerged beyond Europe, including U.S.-Venezuela tensions affecting oil prices. Global defense spending is projected to grow 5% by 2030, with NATO members committing to increase defense expenditure to 5% of GDP by 2035, supporting broader infrastructure and industrial capacity expansion initiatives.
III. 2025-2030 MAY Price Forecast
2025 Outlook
- Conservative Forecast: $0.0089 - $0.01309
- Base Case Forecast: $0.01309
- Optimistic Forecast: $0.01401 (requires sustained market recovery and increased institutional adoption)
2026-2028 Medium-term Outlook
- Market Stage Expectation: Gradual accumulation and recovery phase with increasing market confidence and ecosystem development
- Price Range Predictions:
- 2026: $0.00705 - $0.01639
- 2027: $0.00943 - $0.01796
- 2028: $0.01581 - $0.01844
- Key Catalysts: Network expansion, strategic partnerships, improved market liquidity on platforms like Gate.com, and broader cryptocurrency market sentiment recovery
2029-2030 Long-term Outlook
- Base Case Scenario: $0.01554 - $0.02444 (assumes moderate adoption growth and normalized market conditions)
- Optimistic Scenario: $0.01571 - $0.02388 (assumes accelerated ecosystem development and increased utility recognition)
- Transformational Scenario: $0.02095 - $0.02444 (assumes breakthrough technological advancement, mainstream integration, and significant market expansion)
- December 25, 2030: MAY trading at $0.02095 average with 60% cumulative gains from baseline levels (reflects strong long-term growth trajectory)
| 年份 |
预测最高价 |
预测平均价格 |
预测最低价 |
涨跌幅 |
| 2025 |
0.01401 |
0.01309 |
0.0089 |
0 |
| 2026 |
0.01639 |
0.01355 |
0.00705 |
3 |
| 2027 |
0.01796 |
0.01497 |
0.00943 |
14 |
| 2028 |
0.01844 |
0.01647 |
0.01581 |
25 |
| 2029 |
0.02444 |
0.01746 |
0.01554 |
33 |
| 2030 |
0.02388 |
0.02095 |
0.01571 |
60 |
Mayflower (MAY) Professional Investment Strategy and Risk Management Report
IV. MAY Professional Investment Strategy and Risk Management
MAY Investment Methodology
(1) Long-Term Holding Strategy
- Target Audience: Investors with strong conviction in AI-driven DeFi infrastructure and Solana ecosystem growth
- Operation Recommendations:
- Accumulate MAY during market pullbacks, leveraging the 7-day positive momentum of +7.38% as potential support levels
- Establish a core position and maintain for 12+ months to benefit from protocol adoption and ecosystem expansion
- Reinvest any trading gains to compound holdings
(2) Active Trading Strategy
- Technical Analysis Tools:
- Moving Averages (MA): Use 20-day and 50-day MAs to identify trend reversals and support/resistance levels
- Relative Strength Index (RSI): Monitor overbought/oversold conditions when RSI exceeds 70 or falls below 30
- Wave Trading Key Points:
- Entry signals: Position when price approaches the 24-hour low of $0.01293, with stop-loss at $0.01200
- Exit signals: Take partial profits at resistance near the 24-hour high of $0.01367 and all-time high of $0.07318
MAY Risk Management Framework
(1) Asset Allocation Principles
- Conservative Investors: 2-3% of portfolio allocation
- Active Investors: 3-5% of portfolio allocation
- Professional Investors: 5-8% of portfolio allocation
(2) Risk Hedging Solutions
- Dollar-Cost Averaging (DCA): Invest fixed amounts monthly to reduce volatility impact and smooth entry prices across market cycles
- Profit-Taking Protocol: Establish predetermined exit points at 20%, 50%, and 100% gains to lock in profits systematically
(3) Secure Storage Solutions
- Centralized Exchange Storage: Gate.com offers secure custodial services with insurance coverage for exchange-held assets
- Self-Custody Approach: Transfer MAY to a personal non-custodial wallet for enhanced security and full asset control
- Security Best Practices: Enable two-factor authentication (2FA), use hardware wallets for long-term holdings exceeding $10,000, and never share private keys or seed phrases with anyone
V. MAY Potential Risks and Challenges
MAY Market Risks
- Price Volatility: The token has experienced significant drawdown (-93.087% over one year), indicating extreme volatility unsuitable for risk-averse investors
- Liquidity Constraints: With 24-hour trading volume of only $31,447 and listed on only 5 exchanges, liquidity may be insufficient for large position entries or exits
- Market Sentiment Deterioration: Currently down 23.76% over 30 days, suggesting weakening short-term investor confidence and potential further downside pressure
MAY Regulatory Risks
- Uncertain Classification: The regulatory status of AI-driven DeFi protocols remains ambiguous across major jurisdictions, exposing MAY to potential legal restrictions
- Solana Ecosystem Scrutiny: Regulatory pressure on the Solana network could indirectly impact all projects built on the chain, including Mayflower
- Token Securities Designation: If regulators classify MAY as a security rather than utility token, it could face trading restrictions on certain platforms
MAY Technical Risks
- Smart Contract Vulnerabilities: As an AI-driven protocol, any bugs or vulnerabilities in the underlying smart contracts could result in fund loss or protocol compromise
- Artificial Intelligence Failures: Over-reliance on LLM technology introduces risks of AI model errors, hallucinations, or unexpected behavior in executing financial transactions
- Multi-Chain Integration Complexity: Streamlining multi-chain exploration increases attack surface and potential failure points across different blockchain networks
VI. Conclusion and Action Recommendations
MAY Investment Value Assessment
Mayflower presents an interesting but high-risk opportunity at the intersection of AI and DeFi on the Solana ecosystem. The project's focus on creating an AI-driven user layer for decentralized finance addresses a genuine pain point in blockchain adoption. However, the severe long-term decline (-93.087% annually), limited liquidity (only $31,447 in 24-hour volume), and early-stage nature of the technology necessitate careful consideration. With a market cap of just $2.84 million and only 21.72% of its total supply circulating, MAY remains highly speculative. Investors should only commit capital they can afford to lose entirely.
MAY Investment Recommendations
✅ Beginners: Start with minimal allocation (1-2% of crypto portfolio) through Dollar-Cost Averaging on Gate.com. Use this exposure to learn about AI-driven DeFi protocols without excessive risk exposure.
✅ Experienced Investors: Consider opportunistic entry during marked pullbacks, particularly when RSI falls below 30 or price approaches support levels. Maintain strict stop-loss discipline at 20-30% below entry points.
✅ Institutional Investors: Conduct thorough technical audits of Mayflower's smart contracts and AI systems. Consider small pilot allocations only after comprehensive due diligence on team credentials and development roadmap verification.
MAY Trading Participation Methods
- Gate.com Spot Trading: Purchase MAY directly using stablecoins or other cryptocurrencies through Gate.com's spot trading interface
- Dollar-Cost Averaging Orders: Set up recurring purchases at fixed intervals and predetermined amounts to systematically build positions
- Limit Orders: Place buy orders significantly below current market price to capture deeper discounts during high-volatility periods
Cryptocurrency investments carry extreme risk of total capital loss. This report is educational and does not constitute investment advice. Investors must carefully assess their risk tolerance, investment horizon, and financial situation before committing any funds. Consult with qualified financial advisors before making investment decisions. Never invest more than you can afford to lose completely.
FAQ
What is MAY token and what is its use case?
MAY token is the governance and utility token of Maya Protocol. It distributes 10% of protocol fees to holders, incentivizing participation and rewarding users while promoting network growth and ecosystem development.
What is the price prediction for MAY in 2025?
MAY reached its all-time high of $0.07318 in July 2025, reflecting strong bullish momentum. Current market data shows the token consolidating after this peak, with potential for continued growth driven by increasing adoption and positive market sentiment.
What factors could influence MAY's future price?
MAY's price is influenced by market demand and trading volume, project development progress, broader crypto market sentiment, macroeconomic conditions, and regulatory changes in the industry.
How does MAY compare to other similar cryptocurrencies?
MAY offers unique features within its niche market segment. Compared to mainstream cryptocurrencies, MAY provides distinct utility and community focus. While Bitcoin and Ethereum dominate market capitalization, MAY differentiates through specialized functionality and targeted applications, attracting specific user communities seeking alternatives to established coins.
What is the current market cap and trading volume of MAY?
MAY's market cap and trading volume fluctuate based on market conditions. As of recent data, MAY demonstrates significant market activity with substantial daily trading volume. For the most current figures, monitor real-time market data sources to track MAY's performance metrics accurately.
* The information is not intended to be and does not constitute financial advice or any other recommendation of any sort offered or endorsed by Gate.