The article "2025 MF Price Prediction: Expert Analysis and Market Forecast" offers a detailed examination of Moonwalk Fitness (MF), a pioneering gamified fitness platform. It discusses MF's market position, price history, and the factors influencing its value over 2025-2030. The analysis provides actionable investment strategies, considering macroeconomic conditions, technical risks, and regulatory impacts. Suitable for investors in the crypto and fitness tech domains, the article aims to inform strategic investment decisions. Key focus areas include price forecasts, market sentiment, and risk management approaches.
Introduction: Market Position and Investment Value of MF
Moonwalk Fitness (MF), a gamified fitness platform powered by Solana blockchain, has emerged as an innovative player in the Web3 fitness ecosystem. As of December 25, 2025, MF has achieved a market capitalization of $11.26 million with a circulating supply of 168 million tokens, maintaining a price point around $0.01126. This asset, which transforms daily step goals into social competitions and accountability mechanisms, is playing an increasingly significant role in the intersection of fitness, gaming, and decentralized finance.
This comprehensive analysis will examine MF's price trajectory throughout 2025-2030, integrating historical performance patterns, market supply and demand dynamics, ecosystem development, and macroeconomic factors to deliver professional price forecasts and actionable investment strategies for stakeholders.
I. MF Price History Review and Current Market Status
MF Historical Price Evolution
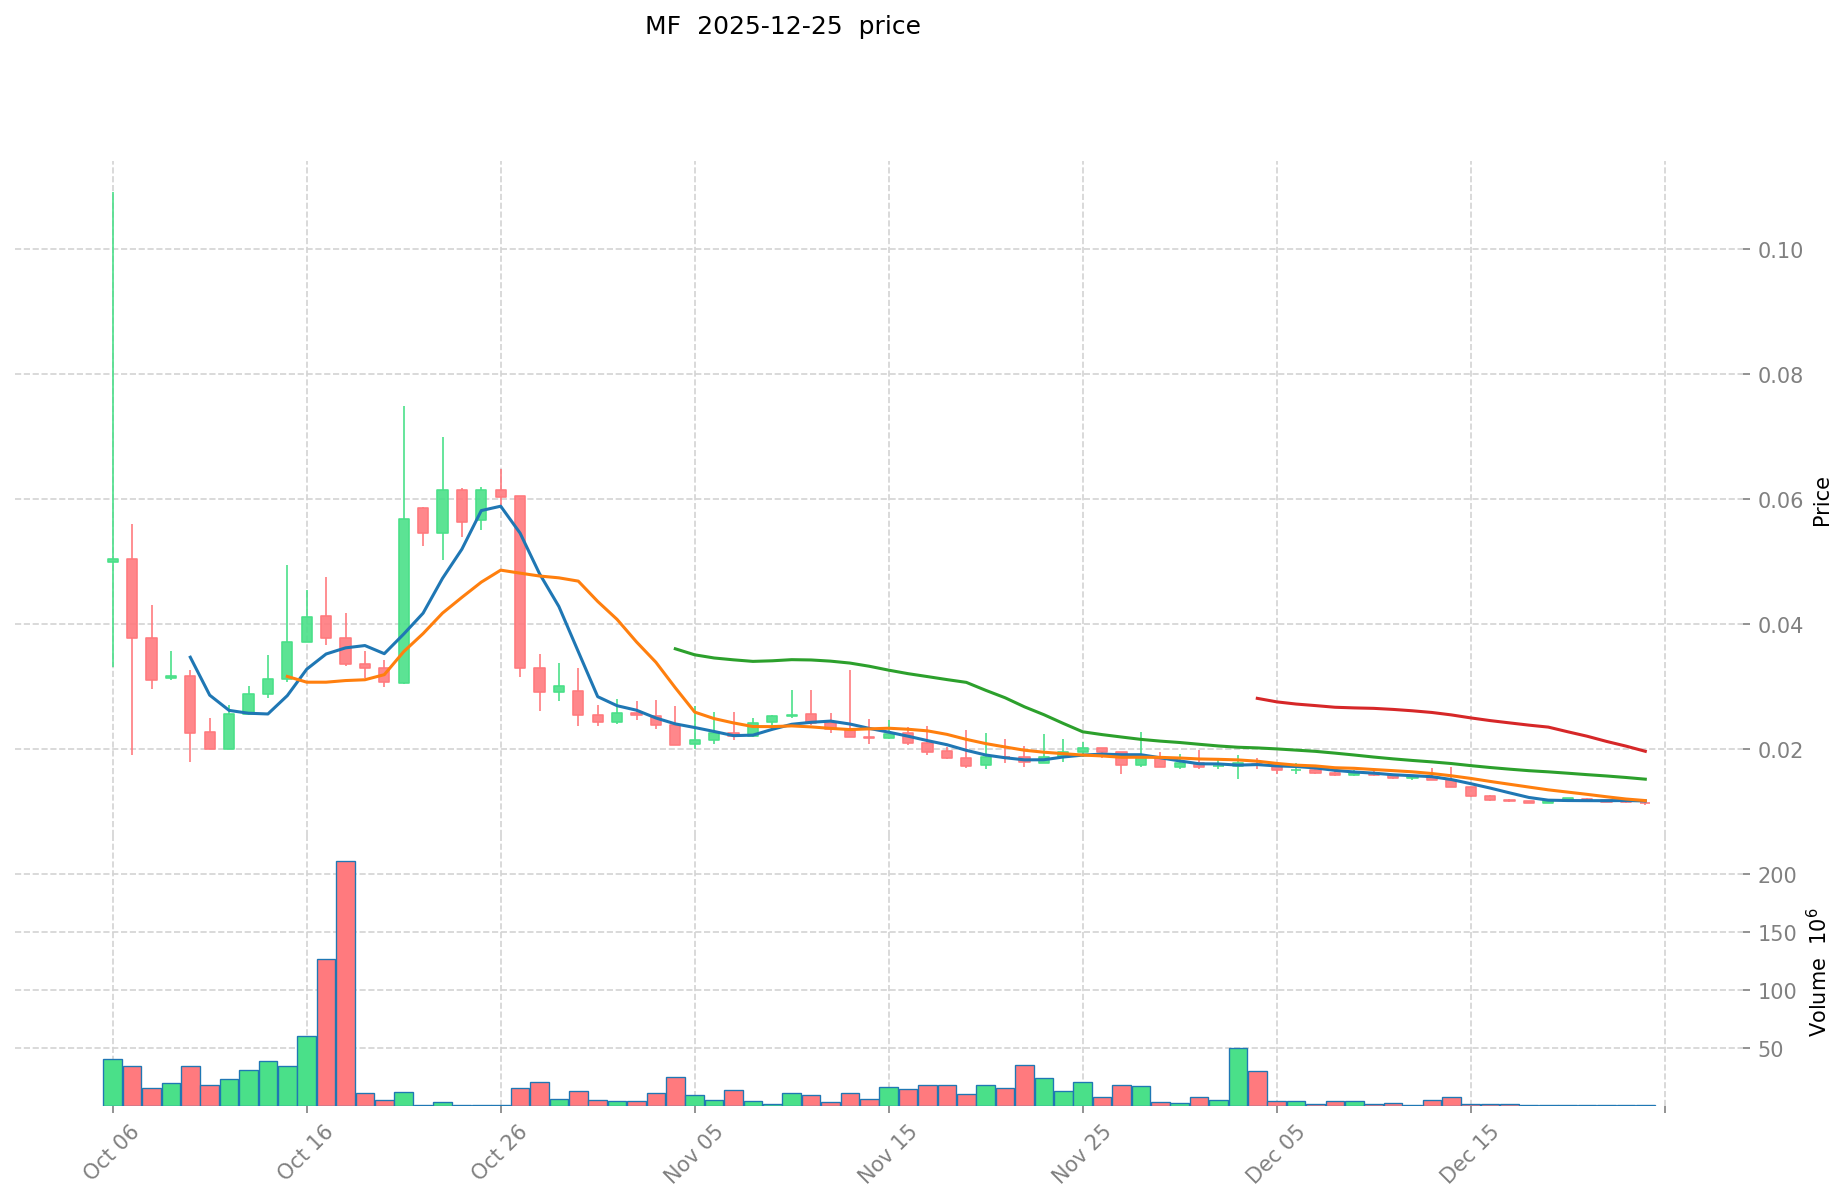
Based on available data, Moonwalk Fitness (MF) reached its all-time high of $0.10922 on October 6, 2025, reflecting strong market interest in the fitness gaming platform during its early growth phase. The token subsequently experienced significant depreciation, declining to an all-time low of $0.01099 on December 24, 2025, representing an 89.9% decrease from peak valuation within approximately 2.5 months.
As of December 25, 2025, MF is trading at $0.01126, reflecting a modest 24-hour gain of 1.25%. However, the token demonstrates weakness across longer timeframes, with a 7-day decline of 0.96% and a more pronounced 30-day loss of 41.74%. The hourly price action shows a slight pullback of 0.79% in the past hour, indicating recent selling pressure.
The token commands a fully diluted market capitalization of $11.26 million against a current market cap of approximately $1.89 million, with 168 million tokens in circulation out of a total supply of 1 billion tokens (16.8% circulating ratio). Trading volume over the past 24 hours stands at $14,565.74, suggesting limited liquidity relative to market cap. MF maintains a ranking of 2,168 by market capitalization and represents just 0.00035% of the total crypto market.
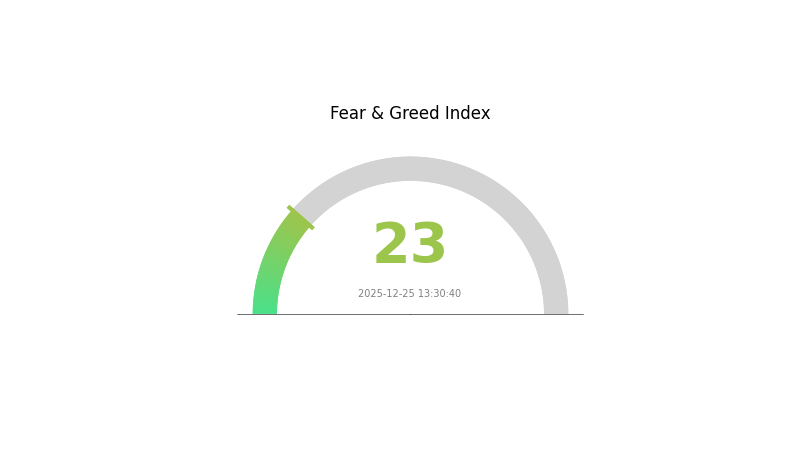
The current market sentiment reflects extreme fear, with a VIX reading of 23, indicating heightened market volatility and risk aversion across the broader cryptocurrency ecosystem. This sentiment backdrop has likely contributed to downward pressure on emerging tokens like MF.
View current MF market price on Gate.com
MF Market Sentiment Indicator
2025-12-25 Fear and Greed Index: 23 (Extreme Fear)
Click to view current Fear & Greed Index
The cryptocurrency market is currently experiencing extreme fear, with the Fear and Greed Index at 23. This indicates significant market pessimism and heightened risk aversion among investors. During periods of extreme fear, asset prices often reach attractive levels for long-term investors. However, caution is advised as market volatility remains elevated. Consider dollar-cost averaging strategies and maintaining a diversified portfolio on Gate.com to navigate this challenging sentiment environment effectively.
MF Holdings Distribution
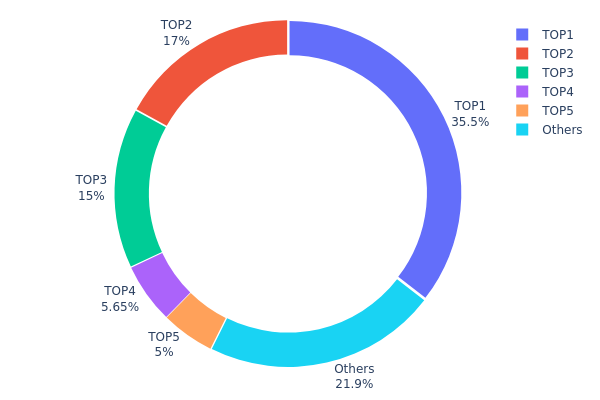
The address holdings distribution map represents the concentration of MF tokens across blockchain addresses, serving as a critical indicator of token ownership structure and market decentralization. By analyzing the distribution patterns of top holders and their respective percentage allocations, market participants can assess liquidity dynamics, potential concentration risks, and the overall health of the token ecosystem.
The current MF holdings distribution reveals a pronounced concentration risk, with the top five addresses controlling 78.12% of total token supply. The leading address alone holds 35.48% of all MF tokens, while the second and third largest holders maintain 17.00% and 15.00% respectively. This top-heavy distribution structure indicates significant centralization, where a limited number of stakeholders possess substantial influence over token supply and potential market movements. The remaining 21.88% distributed among other addresses suggests a relatively fragmented secondary tier of holders, yet the dominance of the top five positions creates a structural vulnerability to coordinated actions or sudden liquidation events.
Such concentration levels present considerable implications for market stability and price dynamics. The high proportion of tokens held by a small cohort of addresses elevates the potential for substantial price volatility should these major holders execute large-scale transactions. Additionally, this distribution pattern may limit genuine decentralization aspirations and raises questions regarding governance fairness and long-term ecosystem sustainability. The market structure reflects characteristics more aligned with early-stage projects or concentrated distribution models, rather than mature, widely-distributed token economies. Close monitoring of these top addresses' on-chain activity remains essential for anticipating potential supply shocks or market-moving events.
For current holdings data and detailed address tracking, visit MF Holdings Distribution on Gate.com.
| Top |
Address |
Holding Qty |
Holding (%) |
| 1 |
ES4cxN...KL2sWB |
354807.70K |
35.48% |
| 2 |
8oUSXe...5zFyRs |
170000.00K |
17.00% |
| 3 |
3sxwPD...omNH7g |
150000.00K |
15.00% |
| 4 |
7Jf1DB...73fTkb |
56461.97K |
5.64% |
| 5 |
EVm7Pd...U7WX7J |
50000.00K |
5.00% |
| - |
Others |
218729.88K |
21.88% |
II. Core Factors Influencing the Future Price of MF
Macroeconomic Environment
-
Monetary Policy Impact: Major central banks' policy directions remain uncertain. In 2023, central banks implemented significant interest rate hikes to combat inflation, which limited economic growth momentum. Looking ahead to 2024, monetary policy uncertainty persists, with the US and European central banks' policy trajectories remaining unclear, which could adversely affect global economic growth.
-
Inflation Hedging Properties: Global inflation has shown a gradual moderation trend. In 2023, global CPI growth rate declined from 7.6% in 2022 to 5.7%, with advanced economies at 4.5% and emerging economies at 6.4%. However, this remains elevated compared to pre-Russia-Ukraine war levels. S&P Global projects global CPI growth will decline to 4.8% in 2024, though the decline magnitude is limited. Advanced economies are expected to continue declining to 2.9%, while emerging economies may rebound to 7.0% as several Latin American and emerging European economies enter monetary easing cycles earlier.
-
Geopolitical Factors: Geopolitical tensions remain unresolved, creating multiple risk factors. Red Sea shipping crises and potential supply disruptions could cause international commodity prices to face upward pressure risks. Additionally, extreme climate events and El Niño phenomena may trigger food security concerns, further influencing macroeconomic stability and investment sentiment.
Three、2025-2030 MF Price Forecast
2025 Outlook
- Conservative Prediction: $0.00721 - $0.01126
- Neutral Prediction: $0.01126
- Optimistic Prediction: $0.01543 (requires sustained market momentum and increased adoption)
2026-2028 Medium-term Outlook
- Market Stage Expectation: Gradual recovery phase with consolidation patterns, characterized by incremental growth and institutional interest building
- Price Range Predictions:
- 2026: $0.00787 - $0.01641 (18% upside potential)
- 2027: $0.01146 - $0.01577 (32% cumulative gains)
- 2028: $0.0141 - $0.019 (36% cumulative gains)
- Key Catalysts: Regulatory clarity, ecosystem expansion, increased liquidity on platforms like Gate.com, strategic partnerships, and broader market sentiment improvement
2029-2030 Long-term Outlook
- Base Case Scenario: $0.01358 - $0.02426 (60% appreciation by 2030, assuming stable macroeconomic conditions and moderate crypto adoption)
- Optimistic Scenario: $0.01562 - $0.01905 in 2029 with continued upward trajectory into 2030 (assuming accelerated mainstream adoption and positive regulatory developments)
- Transformative Scenario: $0.02426+ by 2030 (requires breakthrough technological innovation, mass institutional adoption, and significant geopolitical tailwinds favoring digital assets)
- 2025-12-25: MF trading at historical reference levels with 52-60% potential appreciation over five-year horizon
| 年份 |
预测最高价 |
预测平均价格 |
预测最低价 |
涨跌幅 |
| 2025 |
0.01543 |
0.01126 |
0.00721 |
0 |
| 2026 |
0.01641 |
0.01334 |
0.00787 |
18 |
| 2027 |
0.01577 |
0.01488 |
0.01146 |
32 |
| 2028 |
0.019 |
0.01532 |
0.0141 |
36 |
| 2029 |
0.01905 |
0.01716 |
0.01562 |
52 |
| 2030 |
0.02426 |
0.01811 |
0.01358 |
60 |
Moonwalk Fitness (MF) Professional Investment Strategy and Risk Management Report
IV. MF Professional Investment Strategy and Risk Management
MF Investment Methodology
(1) Long-term Holding Strategy
-
Target Investors: Fitness-conscious individuals seeking passive income through health activities, risk-averse crypto investors interested in wellness-to-earn models.
-
Operational Recommendations:
- Accumulate MF tokens during market downturns when prices fall below historical support levels, particularly given the recent 41.74% decline over 30 days.
- Participate actively in Moonwalk Fitness group games to maximize earning potential through consistent daily step targets.
- Reinvest earned rewards to compound your MF holdings over extended periods.
-
Storage Solutions:
- Maintain long-term holdings on Gate.com for enhanced security and convenient staking opportunities.
- Consider transferring larger holdings to self-custody wallets after reaching significant accumulation targets.
(2) Active Trading Strategy
-
Market Context:
- Current price: $0.01126 (as of December 25, 2025)
- 24-hour change: +1.25%
- 30-day change: -41.74%
- All-time high: $0.10922 (October 6, 2025)
- Distance from ATH: approximately 89.7% below peak
-
Wave Trading Key Points:
- Monitor the critical support level at $0.01099 (all-time low set on December 24, 2025).
- Watch for resistance near the $0.01163 level (24-hour high).
- The significant drawdown from ATH suggests potential accumulation phase, with possible recovery rallies.
- Volume monitoring is essential given the current 24-hour trading volume of $14,565.74.
MF Risk Management Framework
(1) Asset Allocation Principles
- Conservative Investors: 1-3% of portfolio allocation, focusing exclusively on long-term holding strategies with dollar-cost averaging entry points.
- Active Investors: 3-8% of portfolio allocation, combining both holding positions and active trading during high-volatility periods.
- Professional Investors: 5-15% of portfolio allocation with sophisticated hedging strategies and derivatives management through Gate.com's advanced trading features.
(2) Risk Mitigation Strategies
- Portfolio Diversification: Avoid concentration risk by limiting MF exposure to no more than your predetermined allocation percentage across your overall crypto holdings.
- Position Sizing: Use scaled entry points rather than single lump-sum purchases, particularly given the historical price volatility and recent downward momentum.
(3) Secure Storage Solutions
- Exchange Custody: Maintain active trading positions on Gate.com for optimal liquidity and trading flexibility.
- Self-Custody Strategy: For holdings exceeding your active trading needs, consider cold storage solutions after thoroughly understanding private key management protocols.
- Security Considerations:
- Enable two-factor authentication on all exchange accounts.
- Never share private keys or seed phrases.
- Verify wallet addresses before transfers.
- Keep firmware updated on hardware wallets if using cold storage.
- Beware of phishing attempts targeting Solana ecosystem users.
V. MF Potential Risks and Challenges
Market Risk Factors
- Extreme Price Volatility: MF exhibits significant price fluctuations, with an 89.7% decline from all-time high and a 41.74% 30-day drawdown, reflecting high market risk exposure.
- Liquidity Risk: With relatively low 24-hour trading volume ($14,565.74) and only 3 exchanges listing MF, market depth may be insufficient for large trades without significant price slippage.
- Market Cap Fragility: Total market cap of $11.26 million represents a micro-cap asset vulnerable to sudden price movements and reduced investor interest.
Regulatory Risk Factors
- Evolving Fitness-to-Earn Regulations: The move-to-earn and fitness-to-earn sectors face uncertain regulatory treatment globally, with potential restrictions on reward mechanisms.
- Deposit and Reward Mechanics: The core mechanism of collecting lost deposits from failed players and redistributing to successful participants may face legal scrutiny under gambling or securities regulations in certain jurisdictions.
- Solana Blockchain Regulatory Status: Any regulatory action against the Solana network could directly impact MF token holders and transaction capabilities.
Technical Risk Factors
- Platform Dependency: Reliance on integration with third-party wearables (Apple Watch, Fitbit, Garmin) creates vulnerability to API changes or partnership terminations.
- Smart Contract Risk: Bugs or vulnerabilities in the Ascent system or reward distribution smart contracts could result in loss of funds or frozen assets.
- Blockchain Congestion: While Solana provides fast transactions, network outages or congestion could disrupt gameplay and reward distribution mechanisms.
VI. Conclusion and Action Recommendations
MF Investment Value Assessment
Moonwalk Fitness presents a novel intersection of fitness incentives and cryptocurrency rewards, operating within the rapidly evolving move-to-earn ecosystem. However, the token demonstrates characteristics of an emerging, speculative asset: significant distance from all-time high valuations, limited trading liquidity, and reliance on user engagement sustainability. The project's integration with mainstream wearables represents genuine technical strength, yet regulatory uncertainties surrounding fitness-to-earn models and deposit redistribution mechanisms present material headwinds. MF should be viewed as a high-risk, speculative investment suitable only for investors with substantial risk tolerance and deep interest in Web3 fitness applications.
Investment Recommendations
✅ Beginners: Start with minimal positions (0.5-1% of crypto allocation) through dollar-cost averaging on Gate.com. Focus on understanding the Moonwalk ecosystem through actual gameplay before committing capital.
✅ Experienced Investors: Consider tactical accumulation during significant dips (below $0.011), but maintain strict position sizing and profit-taking discipline. Monitor community engagement and wearable integration metrics as fundamental health indicators.
✅ Institutional Investors: Evaluate MF within broader fitness-tech and Web3 thesis portfolios. Request comprehensive smart contract audits and user retention metrics before institutional allocation.
Trading Participation Methods
- Exchange Trading on Gate.com: Direct token purchase and sale through Gate.com's spot trading markets for immediate liquidity and portfolio management.
- In-Game Participation: Engage directly through the Moonwalk Fitness platform by joining group games, depositing MF tokens or credits, and earning rewards through daily step targets.
- Wearable Integration: Connect Apple Watch, Fitbit, or Garmin devices to automate step tracking and reward distribution without manual transaction management.
Cryptocurrency investments carry extreme risk and potential for total loss. This report does not constitute investment advice. Investors must make decisions based on their personal risk tolerance and financial circumstances. Always consult qualified financial advisors before making significant investment decisions. Never invest more than you can afford to lose.
FAQ
What is the price prediction for MFI stock?
Based on current market analysis, MFI stock is predicted to rise approximately 45.31% and reach $31.18 per share. This forecast reflects positive market trends and growing investor interest in the asset.
What is the TSX prediction for 2025?
Based on market analysis, TSX is expected to reach approximately 31,162 by end of 2025, with potential maximum values around 35,033 and minimum support near 29,706. The index shows positive momentum driven by economic factors and market sentiment throughout the year.
How to predict if a stock will go up?
Analyze candlestick closes above volume weighted average price (VWAP) and use technical indicators like momentum oscillators. Monitor trading volume and price trends to identify potential upward movements in the market.
What is the stock market prediction for Canada?
The TSX Composite surged 28% in 2025, driven by AI stocks and strong economic outlook. Analysts predict continued growth in 2026, with Brookfield Asset Management positioned as a key beneficiary of emerging market trends.
What factors influence MF stock price movements?
MF price movements are primarily influenced by: underlying asset performance, market demand and trading volume, macroeconomic conditions, investor sentiment, and project developments. Supply and demand dynamics, along with broader cryptocurrency market trends, also significantly impact price fluctuations.
What are the risks associated with MF price predictions?
MF price predictions involve market volatility, liquidity risk, and credit risk. Concentration risk and inflation impacts may affect prediction accuracy and trading outcomes.
* The information is not intended to be and does not constitute financial advice or any other recommendation of any sort offered or endorsed by Gate.