The article provides an expert analysis of Saber (SBR), a governance token for the Solana-based cross-chain stablecoin exchange. It offers readers insights into the current market position, historical price trends, and future price predictions for SBR in 2025 and beyond. Targeted towards investors and traders on Gate, it addresses market sentiment, potential risks, and investment strategies. The content is structured with a detailed market analysis, price forecast, and professional investment methods, enhancing keyword density for terms like 'SBR price prediction' and 'Solana ecosystem' for readability and quick scanning.
Introduction: Market Position and Investment Value of SBR
Saber (SBR) serves as the governance token for Saber, the leading cross-chain stablecoin exchange on Solana. Since its launch in 2021, SBR has established itself as a key infrastructure asset within the Solana ecosystem. As of December 2025, SBR maintains a market capitalization of approximately $1.75 million, with a circulating supply of around 2.24 billion tokens, currently trading at $0.0007776. This governance asset is playing an increasingly vital role in managing the Saber protocol's development and optimizing incentive mechanisms across its stakeholder ecosystem.
This article provides a comprehensive analysis of SBR's price trajectory and market dynamics, combining historical performance patterns, supply and demand fundamentals, ecosystem developments, and macroeconomic factors to deliver professional price forecasts and practical investment strategies for 2025 and beyond.
Saber (SBR) Price History and Market Analysis Report
I. SBR Price History Review and Current Market Status
SBR Historical Price Evolution Trajectory
-
September 2021: SBR reached its all-time high (ATH) of $0.960362, marking the peak of the initial market enthusiasm for the Solana-based cross-chain stable coin exchange protocol.
-
June 2023: SBR hit its all-time low (ATL) of $0.00052473, reflecting a significant market correction and extended downtrend from its historical peak.
-
2024-2025: Continued market pressure with SBR trading at substantially lower levels compared to its inception price, indicating prolonged bearish sentiment in the broader market.
SBR Current Market Status
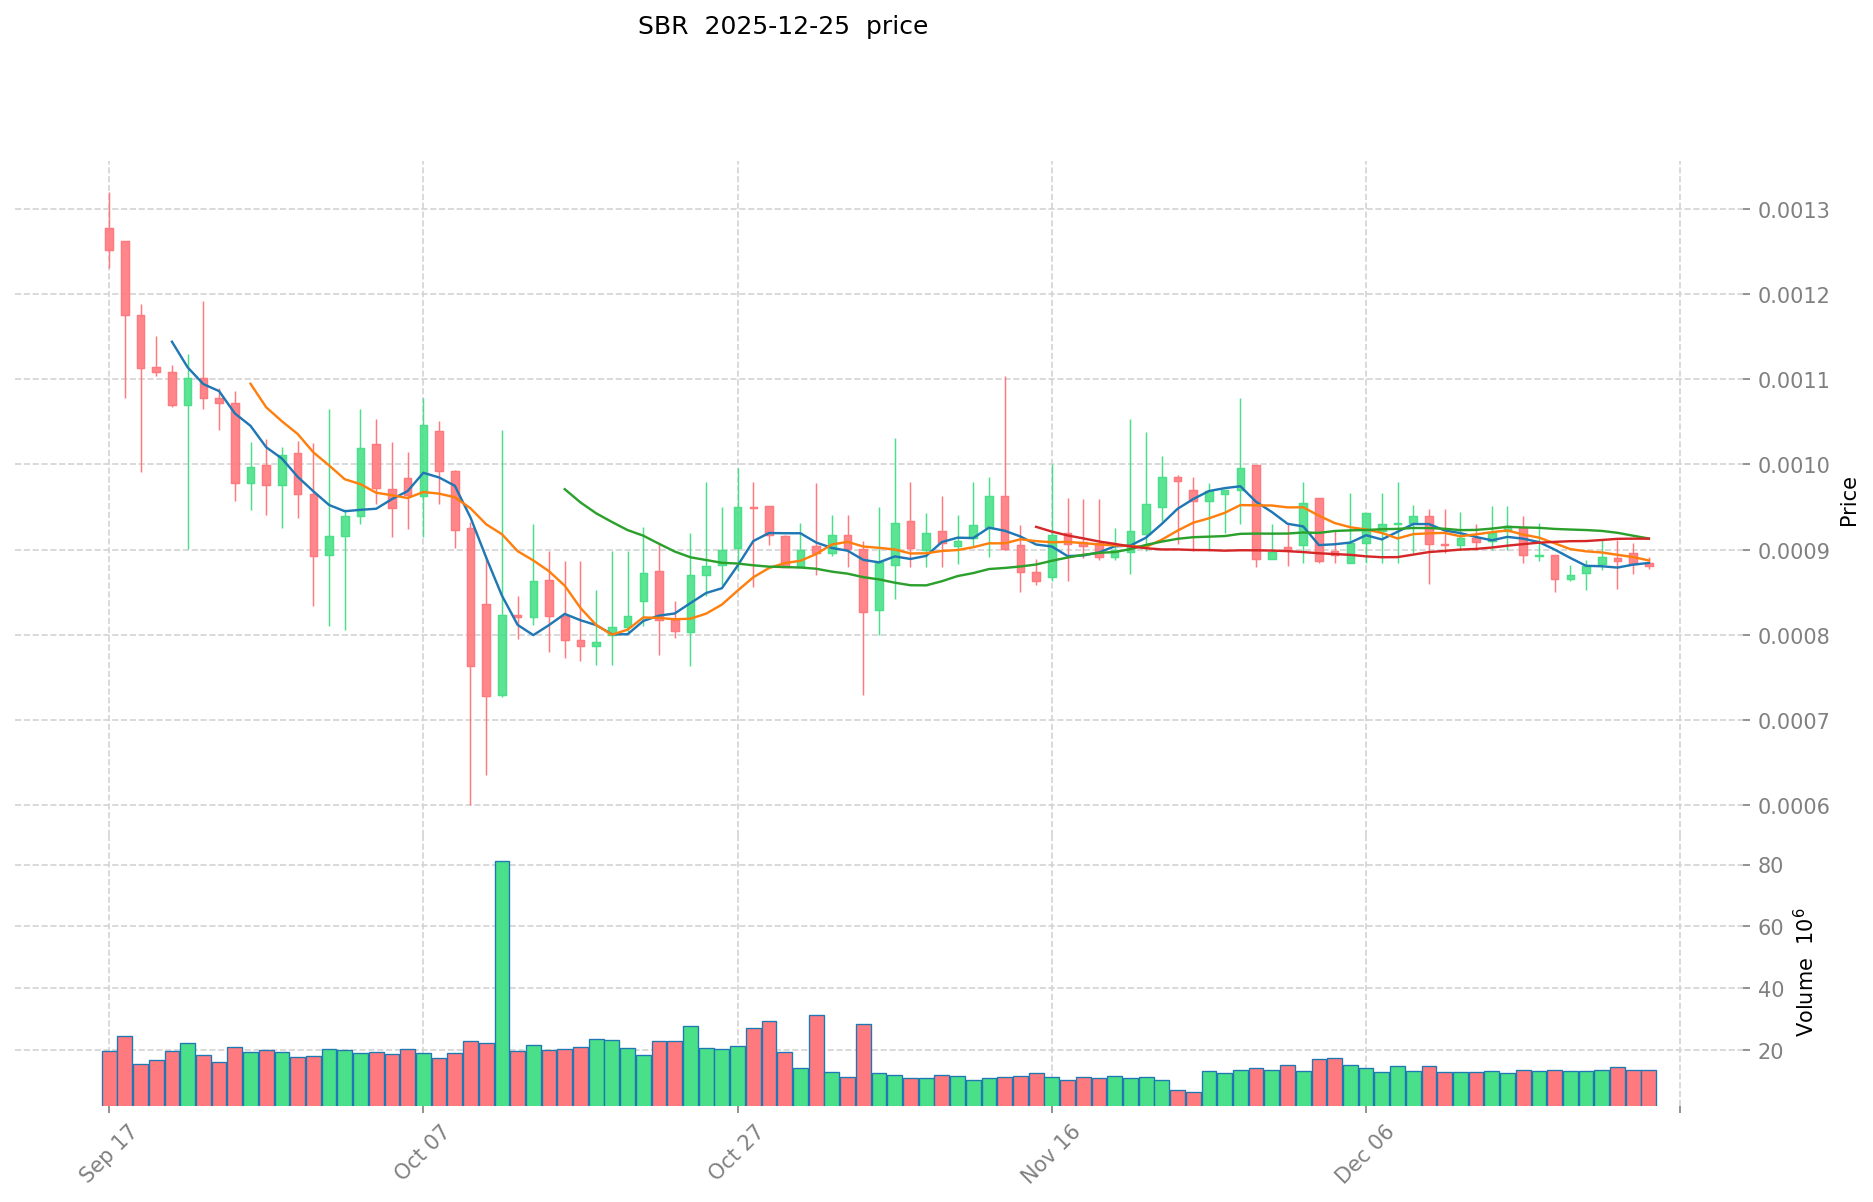
As of December 26, 2025, SBR is trading at $0.0007776, down 9.86% in the past 24 hours and 10.87% over the past 7 days. The token has experienced a 17.99% decline over the past 30 days and a severe 66.95% decline over the past year, reflecting ongoing downward pressure.
Market Metrics:
- 24-Hour High/Low: $0.0008822 / $0.00076
- Market Capitalization: $1,745,926.33
- Fully Diluted Valuation (FDV): $2,365,234.55
- Circulating Supply: 2,245,275,630.88 SBR (22.45% of maximum supply)
- Maximum Supply: 10,000,000,000 SBR
- 24-Hour Trading Volume: $12,822.83
- Market Dominance: 0.000073%
- Total Holders: 39,965
The market sentiment indicator shows Extreme Fear (VIX: 23), suggesting heightened risk aversion across the broader cryptocurrency market. SBR's market cap to FDV ratio stands at 22.45%, indicating significant distance between current market valuation and full dilution scenarios.
Click to view current SBR market price
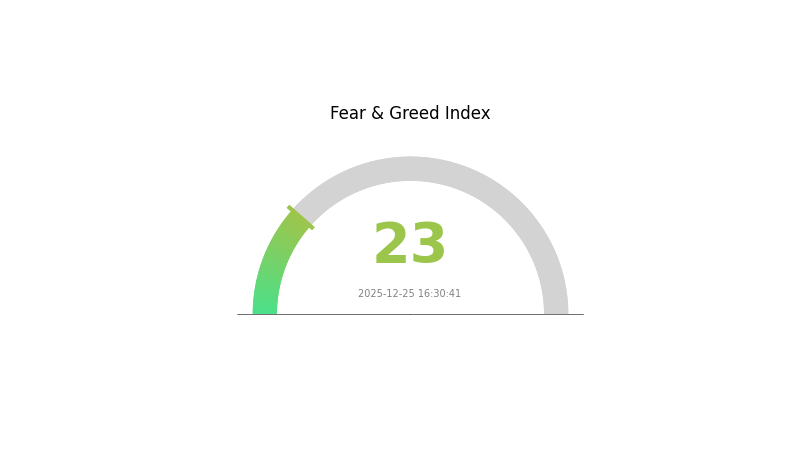
SBR Market Sentiment Index
2025-12-25 Fear and Greed Index: 23 (Extreme Fear)
Click to view the current Fear & Greed Index
The crypto market is currently experiencing extreme fear, with the Fear and Greed Index dropping to 23. This indicates significant market pessimism and widespread investor anxiety. During such periods, volatility tends to increase sharply as traders react to negative sentiment. However, extreme fear often presents contrarian opportunities for long-term investors. Consider this a moment to reassess your investment strategy and portfolio allocation on Gate.com. Remember that market cycles are inevitable, and extreme sentiment readings frequently precede significant recoveries.
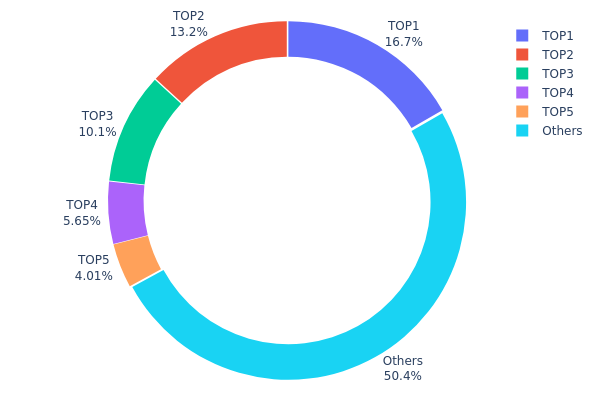
SBR Holding Distribution
The address holding distribution map illustrates the concentration of token ownership across blockchain addresses, revealing the extent to which SBR tokens are distributed among large holders versus the broader community. This metric serves as a critical indicator of market decentralization, liquidity dynamics, and potential vulnerability to price manipulation.
Current analysis of SBR's top holder distribution demonstrates moderate concentration characteristics. The top five addresses collectively command approximately 49.58% of total holdings, with the largest holder maintaining 16.66% of circulating tokens. While this concentration level is noteworthy, the remaining 50.42% distributed among other addresses suggests a reasonably diversified ownership structure compared to highly centralized tokens. The third-largest holder's 10.08% position and the gradual decline in holdings from rank two to five further indicate a relatively balanced distribution pattern rather than extreme concentration in a single entity.
The current holding distribution structure presents both stabilizing and risk factors for market dynamics. The substantial minority stake held by top addresses provides sufficient liquidity depth and potential stability, while the dominant presence of distributed holdings reduces the immediate risk of coordinated price manipulation by individual whale accounts. However, coordinated action among the top five holders could theoretically influence market movements given their combined ~50% stake. The relatively even distribution pattern suggests adequate decentralization, supporting sustainable ecosystem development and reducing systemic concentration risk that might otherwise constrain organic growth or trigger regulatory scrutiny.
For current SBR Holding Distribution data, please visit Gate.com.
| Top |
Address |
Holding Qty |
Holding (%) |
| 1 |
GESNnr...GjLjc2 |
537933.85K |
16.66% |
| 2 |
EFE3j1...o4ewqR |
425840.08K |
13.19% |
| 3 |
E2RvJg...qnatYy |
325290.66K |
10.08% |
| 4 |
6LY1Jz...kZzkzF |
182166.67K |
5.64% |
| 5 |
u6PJ8D...ynXq2w |
129547.77K |
4.01% |
| - |
Others |
1626212.47K |
50.42% |
Analysis of Core Factors Influencing SBR Future Price
II. Core Factors Affecting SBR Future Price
Supply Mechanism
-
Raw Material Price Fluctuations: SBR pricing is significantly influenced by crude oil-linked raw material costs. Price volatility in upstream materials directly impacts production costs and pricing power.
-
Production Capacity in Asia: Large-scale production capacity in Asian manufacturing clusters provides competitive advantages through proximity to automotive customers and economies of scale, which affects global market pricing dynamics.
-
Carbon Emission Regulations: Stricter carbon emission regulations increasingly impact production costs and operational expenses, influencing overall market pricing trends.
Market Demand Drivers
-
Automotive Industry Demand: The automotive sector remains the primary demand driver for SBR, with consistent market pull supporting pricing structures.
-
Construction and Footwear Industries: Secondary demand from construction and footwear industries contributes to overall market consumption and price stability.
-
Environmental Product Focus: Growing emphasis on eco-friendly products is expected to further enhance market expansion and support sustainable pricing models.
Competitive Landscape
-
Thermoplastic Elastomer Competition: Intensifying competition from other thermoplastic elastomers constrains SBR production volumes and pricing capabilities.
-
Market Consolidation: Regional regulatory changes and individual market factors affect current and future market trends, creating both opportunities and pricing pressures across different geographical markets.
III. SBR Price Forecast 2025-2030
2025 Outlook
- Conservative Forecast: $0.00042 - $0.00078
- Base Case Forecast: $0.00078
- Optimistic Forecast: $0.00111 (requires sustained market momentum and positive ecosystem developments)
2026-2028 Medium-term Outlook
- Market Phase Expectation: Gradual recovery and accumulation phase with increasing adoption signals
- Price Range Forecast:
- 2026: $0.00078 - $0.00126 (21% potential upside)
- 2027: $0.00082 - $0.00118 (41% cumulative growth)
- 2028: $0.00092 - $0.00168 (46% cumulative growth)
- Key Catalysts: Protocol upgrades, expanded partnership network, increased liquidity on major exchanges including Gate.com, and growing institutional interest in emerging altcoins
2029-2030 Long-term Outlook
- Base Case Scenario: $0.00082 - $0.00188 (81% growth by 2029, assuming steady market development and moderate adoption)
- Optimistic Scenario: $0.00092 - $0.00187 (111% growth by 2030, assuming accelerated ecosystem expansion and broader market participation)
- Transformation Scenario: Price potential exceeding $0.00188 (requires major technological breakthroughs, significant regulatory clarity, and substantial increase in trading volume across platforms like Gate.com)
- Key Observation: Average price trajectory shows consistent growth from $0.00078 (2025) to $0.00164 (2030), indicating potential sustained upward pressure over the forecast period
| 年份 |
预测最高价 |
预测平均价格 |
预测最低价 |
涨跌幅 |
| 2025 |
0.00111 |
0.00078 |
0.00042 |
0 |
| 2026 |
0.00126 |
0.00095 |
0.00078 |
21 |
| 2027 |
0.00118 |
0.0011 |
0.00082 |
41 |
| 2028 |
0.00168 |
0.00114 |
0.00092 |
46 |
| 2029 |
0.00188 |
0.00141 |
0.00082 |
81 |
| 2030 |
0.00187 |
0.00164 |
0.00092 |
111 |
Saber (SBR) Professional Investment Strategy and Risk Management Report
IV. SBR Professional Investment Strategy and Risk Management
SBR Investment Methodology
(1) Long-term Holding Strategy
- Target Investor Profile: Community members and ecosystem participants who believe in Saber's role as Solana's core cross-chain liquidity network
- Operational Recommendations:
- Accumulate SBR tokens during market downturns when sentiment is negative, particularly given the -66.95% decline over the past year
- Participate in governance proposals to actively shape protocol development and fee structures
- Reinvest rewards from liquidity provision activities to compound returns over time
(2) Active Trading Strategy
- Market Analysis Approach:
- Price Action Tracking: Monitor the 24-hour trading volume of 12,822.83 USD and volatility patterns, noting the -9.86% 24-hour price decline as a potential entry point for bounce-trading opportunities
- Trend Analysis: Observe the 7-day (-10.87%) and 30-day (-17.99%) trends to identify medium-term support and resistance levels
- Wave Trading Key Points:
- Execute buy orders near the 24-hour low of 0.00076 USD when market sentiment stabilizes
- Take profit positions when price approaches the 24-hour high of 0.0008822 USD or when positive momentum indicators align
SBR Risk Management Framework
(1) Asset Allocation Principles
- Conservative Investors: 1-3% of total portfolio
- Active Investors: 3-5% of total portfolio
- Professional Investors: 5-10% of total portfolio
(2) Risk Hedging Solutions
- Position Sizing: Limit individual SBR positions to reduce concentration risk given its relatively low market capitalization of $2.37 million
- Dollar-Cost Averaging: Implement systematic purchases over multiple periods to mitigate timing risk and reduce the impact of volatility
(3) Secure Storage Solutions
- Hot Wallet Option: Gate.com Web3 Wallet for frequent trading and immediate liquidity access
- Cold Storage Approach: Transfer SBR tokens to secure offline storage for long-term holding periods when not actively participating in governance
- Security Best Practices: Enable multi-factor authentication on exchange accounts, never share private keys, and verify smart contract addresses before transactions on the Solana blockchain
V. SBR Potential Risks and Challenges
SBR Market Risk
- Extreme Price Volatility: SBR has declined from an all-time high of $0.960362 (September 10, 2021) to current levels of $0.0007776, representing a 99.92% decline. This extreme depreciation indicates substantial downside risk and suggests potential structural challenges in demand
- Low Trading Liquidity: Daily trading volume of only $12,822.83 USD is exceptionally low, creating significant slippage risk for medium to large orders and potentially limiting exit opportunities during market stress
- Limited Market Adoption: With a market rank of 2,220 and only 39,965 token holders, SBR faces serious challenges in achieving meaningful ecosystem adoption and network effects
SBR Regulatory Risk
- Blockchain Network Dependency: As a Solana-based token, SBR is subject to regulatory actions against the Solana ecosystem or broader cryptocurrency regulations affecting stablecoin protocols
- Governance Protocol Changes: Future amendments to the protocol's fee structure or economic parameters through governance voting could negatively impact token value and utility
SBR Technical Risk
- Smart Contract Vulnerability: Cross-chain stable coin exchanges involve complex cryptographic mechanisms that face potential exploitation risks or operational failures
- Network Congestion Impact: Solana network stability issues or congestion episodes could disrupt Saber protocol functionality and liquidity provision services
- Protocol Scalability Constraints: The current market capitalization and liquidity limitations suggest the protocol may face challenges in handling significantly increased transaction volumes or becoming a major cross-chain bridge
VI. Conclusions and Action Recommendations
SBR Investment Value Assessment
SBR operates within a highly specialized niche as a governance token for Solana's cross-chain stablecoin exchange. While the protocol addresses a legitimate infrastructure need in the Solana ecosystem, the investment presents substantial challenges. The catastrophic 99.92% decline from all-time highs, minimal liquidity, and comparatively low market presence suggest limited current demand for the token. The governance utility provides some intrinsic value for protocol participants, but this alone may not justify investment for most retail participants. The token exhibits characteristics of a mature bear market recovery scenario with uncertain recovery prospects.
SBR Investment Recommendations
✅ Beginners: Monitor the project's development and ecosystem growth for 3-6 months before considering small speculative positions; prioritize learning about cross-chain protocols and Solana infrastructure before allocating capital
✅ Experienced Investors: Consider SBR as a high-risk speculative position only if you have conviction in Saber's long-term role in Solana infrastructure; implement strict stop-loss orders at -20% from entry price
✅ Institutional Investors: Conduct comprehensive due diligence on Saber Labs' development roadmap, team background, and competitive positioning within the Solana ecosystem before any allocation consideration
SBR Trading Participation Methods
- Gate.com Trading Platform: Execute spot trading, set limit orders to optimize entry prices, and utilize trading alerts to monitor price movements
- Governance Participation: Hold SBR tokens to vote on protocol development decisions and fee structure modifications that may impact future token economics
- Liquidity Provision: For advanced users, provide liquidity to Saber pools to earn trading fees and potential reward distributions, though assess counterparty and smart contract risks carefully
Cryptocurrency investment carries extreme risk and this report does not constitute investment advice. Investors should make cautious decisions based on their personal risk tolerance and financial circumstances. It is strongly recommended to consult with professional financial advisors before making investment decisions. Never invest more capital than you can afford to lose completely.
FAQ
What is SBR crypto?
SBR crypto refers to Saber, an automated market maker (AMM) built on the Solana blockchain. It specializes in trading pegged assets like stablecoins and derivatives without traditional order books, providing efficient liquidity for users.
Will sand reach $10?
Yes, SAND has potential to reach $10 if metaverse adoption accelerates and The Sandbox expands its ecosystem. Strong development momentum and increasing platform usage could drive significant price appreciation in the coming years.
Which coin price prediction 2025?
SBR's 2025 price prediction depends on market factors and technical analysis. Based on current trends, potential price targets range from $0.50 to $2.00. However, detailed forecasts vary by analyst. Monitor market momentum and on-chain metrics for updated predictions.
What factors influence SBR price movements?
SBR price movements are driven by supply and demand dynamics, market sentiment, trading volume, blockchain adoption trends, regulatory developments, and macroeconomic conditions affecting the crypto sector.
SBR has demonstrated strong historical performance with a 9.70% increase over the past year. The 52-week price range spans from $58.25 to $84.39, reflecting solid market positioning and investor confidence in the asset.
What are the risks associated with SBR price predictions?
SBR price predictions face risks from market volatility, fluctuating commodity prices, and regulatory changes. Uncertainties in future royalty revenue and broader economic factors can significantly impact valuation accuracy and prediction reliability.
* The information is not intended to be and does not constitute financial advice or any other recommendation of any sort offered or endorsed by Gate.