The article offers an in-depth analysis of EtherVista (VISTA), highlighting its market position since its launch in 2024 and forecasting price trends from 2025 to 2030. It addresses VISTA's historical price performance, current market conditions, and factors influencing future prices, providing valuable insights for investors. The target audience includes long-term cryptocurrency enthusiasts, active traders, and institutional investors interested in decentralized exchanges and Layer 2 solutions. With structured sections on market analysis, price forecasts, investment strategies, and risk management, the article serves as a comprehensive guide for navigating VISTA investments.
Introduction: VISTA's Market Position and Investment Value
EtherVista (VISTA) stands as a new standard for Decentralized Exchanges built for Ethereum and Layer 2s. Since its launch in September 2024, the project has established itself within the decentralized finance ecosystem. As of December 2025, VISTA's market capitalization has reached approximately $2.89 million, with a circulating supply of around 940,512.79 VISTA tokens, currently trading at $2.89 per token. This innovative blockchain asset is playing an increasingly critical role in advancing decentralized exchange infrastructure for Ethereum-based networks and Layer 2 solutions.
This article will provide a comprehensive analysis of VISTA's price movements and market trends, examining historical performance patterns, market supply and demand dynamics, ecosystem development, and broader market conditions. By synthesizing these factors, we aim to deliver professional price forecasts and actionable investment strategies for VISTA investors navigating the 2025-2030 period.
EtherVista (VISTA) Market Analysis Report
I. VISTA Price History Review and Current Market Status
VISTA Historical Price Evolution
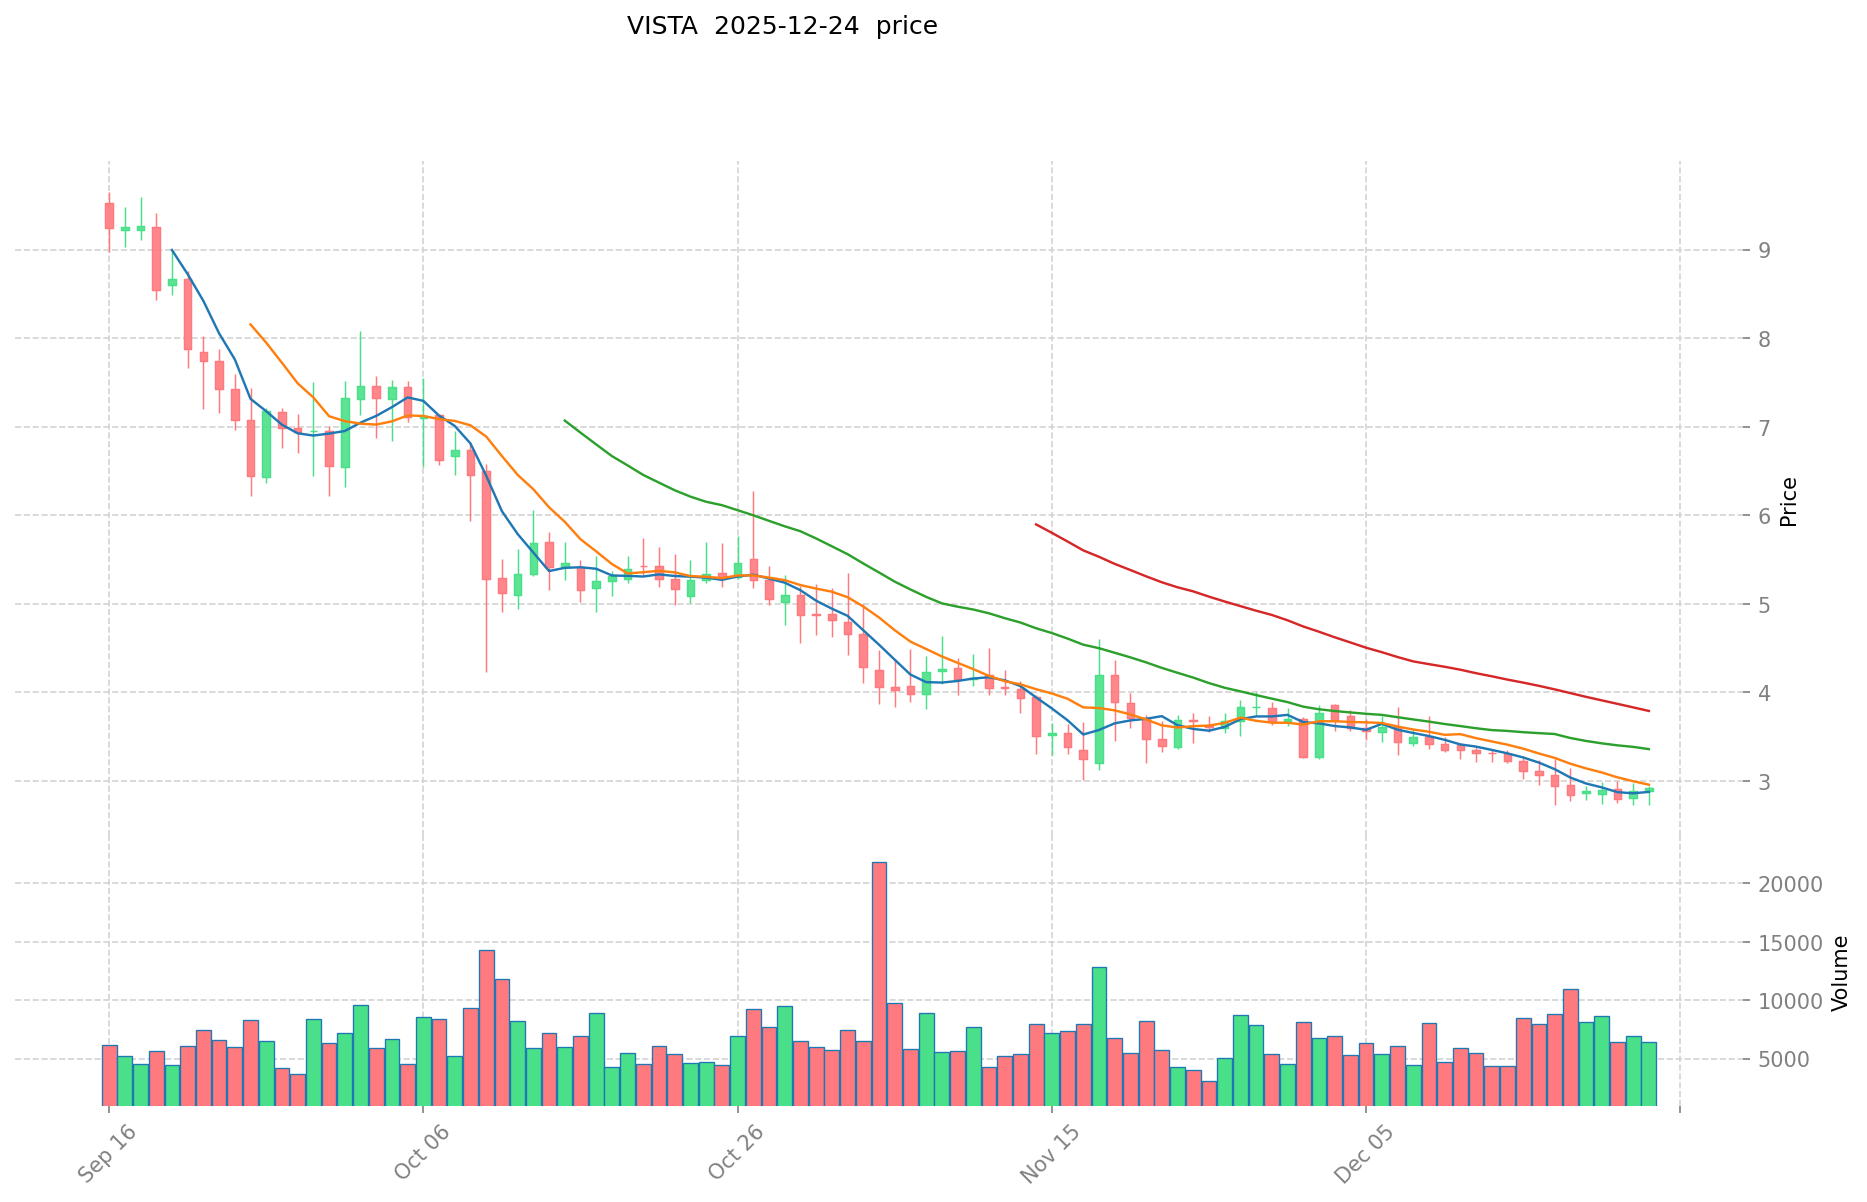
Based on available data, EtherVista has experienced significant volatility since its launch:
- November 2024: Project reached its all-time high of $76.689 on November 2, 2024, representing peak market enthusiasm during the launch period.
- December 2025: Token experienced substantial decline, reaching its all-time low of $2.724 on December 17, 2025, marking an 96.45% decrease from the historical peak.
VISTA Current Market Conditions
As of December 25, 2025, EtherVista trades at $2.89 with a market capitalization of $2.71 million and a fully diluted valuation of $2.89 million. The token demonstrates a circulating supply of 940,512.79 VISTA tokens out of a total supply of 1,000,000 tokens, representing 94.05% circulation ratio.
Short-term Price Performance:
- 1-hour change: +0.44%
- 24-hour change: +1.51%
- 7-day change: -1.53%
- 30-day change: -20.95%
- Year-to-date change: -88.34%
The 24-hour trading volume stands at $23,424.71, with the token trading within a range of $2.75 to $3.05. VISTA maintains a market ranking of 1,942 by market capitalization, with 13,991 token holders and availability on 8 exchanges.
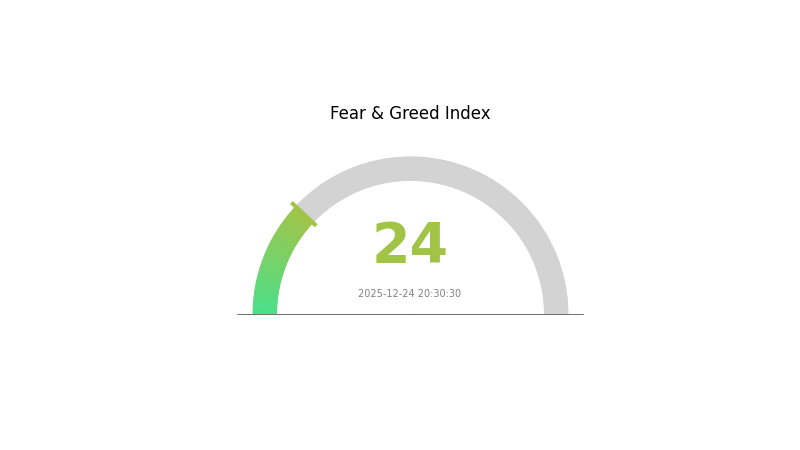
Market sentiment remains in "Extreme Fear" territory with a VIX reading of 24, reflecting broader market uncertainty and cautious investor positioning.
Click to view current VISTA market price
VISTA Market Sentiment Indicator
2025-12-24 Fear and Greed Index: 24 (Extreme Fear)
Click to view current Fear & Greed Index
The crypto market is currently experiencing extreme fear, with the Fear and Greed Index at 24. This indicates severe pessimism among investors, as market sentiment has reached critical lows. During such periods, extreme fear often precedes significant market reversals, presenting potential opportunities for contrarian investors. However, heightened volatility and downside risks remain prevalent. Traders should exercise caution, maintain strict risk management, and avoid emotional decision-making. Consider diversifying your portfolio and only invest capital you can afford to lose during these uncertain market conditions.
VISTA Holdings Distribution
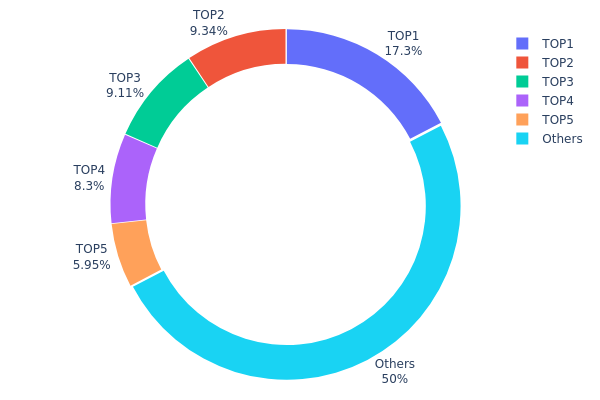
The address holdings distribution chart illustrates the concentration of VISTA tokens across the blockchain network by tracking the top token holders and their respective share of the total supply. This metric serves as a critical indicator of token decentralization, market structure stability, and the potential vulnerability to coordinated price movements or market manipulation.
The current distribution of VISTA demonstrates moderate concentration characteristics. The top five addresses collectively control 49.01% of the total supply, with the largest holder (0x3cc9...aecf18) commanding 17.34% of all tokens in circulation. The second and third largest holders maintain significant positions at 9.33% and 9.11% respectively, while the fourth holder retains 8.29% of the supply. Notably, a substantial portion of tokens (5.94%) resides in the dead address (0x0000...00dead), which represents permanently removed or burned tokens and effectively reduces the active circulating supply. The remaining 49.99% of tokens are distributed across other addresses, suggesting a relatively healthy dispersion of ownership among smaller token holders and participants.
This distribution pattern indicates a moderately decentralized token structure with some degree of concentration risk among major stakeholders. While the top five addresses do not constitute an overwhelming majority, their combined influence of approximately 50% of the supply warrants monitoring for potential market impact during periods of volatility or significant token movements. The substantial portion held by distributed addresses demonstrates organic participation from the broader community, though the presence of significant individual holders introduces asymmetric risk factors that could influence price dynamics and market sentiment. Overall, VISTA exhibits a relatively balanced holder structure that preserves decentralization while acknowledging the inherent concentration patterns common to established cryptocurrency projects.
Click to view the current VISTA Holdings Distribution
| Top |
Address |
Holding Qty |
Holding (%) |
| 1 |
0x3cc9...aecf18 |
173.49K |
17.34% |
| 2 |
0x75e8...1dcb88 |
93.36K |
9.33% |
| 3 |
0x0d07...b492fe |
91.13K |
9.11% |
| 4 |
0xb8ba...1ad7ef |
82.96K |
8.29% |
| 5 |
0x0000...00dead |
59.49K |
5.94% |
| - |
Others |
499.57K |
49.99% |
II. Core Factors Influencing VISTA's Future Price
Market Sentiment and Investor Confidence
- Investor Sentiment Impact: Investor emotions and confidence have a direct impact on VISTA price movements. Positive market sentiment regarding VISTA's ecosystem expansion or favorable news can directly drive price appreciation.
- Ecosystem Development: Announcements about VISTA ecosystem growth and technological breakthroughs can significantly influence market perception and investment decisions.
Macroeconomic Environment
- Monetary Policy and Interest Rate Changes: Changes in monetary policy and interest rate fluctuations may impact investment attractiveness for emerging cryptocurrencies like VISTA.
- Geopolitical Uncertainty: International geopolitical tensions may influence investor risk appetite and asset allocation decisions.
Three、2025-2030 VISTA Price Forecast
2025 Outlook
- Conservative Forecast: $1.51-$2.85
- Neutral Forecast: $2.85 (Average)
- Bearish Forecast: $1.51 (Lower bound, with market headwinds)
2026-2028 Medium-term Outlook
- Market Phase Expectation: Recovery and accumulation phase with gradual bullish momentum building
- Price Range Forecast:
- 2026: $2.83-$4.10
- 2027: $3.20-$5.08
- 2028: $4.12-$6.00
- Key Catalysts: Ecosystem development maturation, increased institutional adoption, improved market liquidity, and positive regulatory clarity
2029-2030 Long-term Outlook
- Base Case: $3.48-$7.06 (Assuming steady ecosystem adoption and moderate market growth)
- Optimistic Case: $5.19-$8.39 (Supported by accelerated platform integration and network effects)
- Transformative Case: $8.39+ (With breakthrough technological advancement and mainstream institutional participation)
- 2025-12-25: VISTA trading range reflects early consolidation phase
Note: These forecasts represent analytical projections based on historical patterns and market indicators. Actual market performance may vary significantly based on macroeconomic conditions, regulatory developments, and technological breakthroughs. Investors should conduct independent research and consider risk tolerance when trading on platforms like Gate.com.
| 年份 |
预测最高价 |
预测平均价格 |
预测最低价 |
涨跌幅 |
| 2025 |
3.67005 |
2.845 |
1.50785 |
-1 |
| 2026 |
4.10448 |
3.25753 |
2.83405 |
12 |
| 2027 |
5.07978 |
3.681 |
3.20247 |
27 |
| 2028 |
6.00114 |
4.38039 |
4.11757 |
51 |
| 2029 |
7.05944 |
5.19077 |
3.47781 |
79 |
| 2030 |
8.39139 |
6.1251 |
3.61381 |
111 |
EtherVista (VISTA) Professional Investment Strategy and Risk Management Report
IV. VISTA Professional Investment Strategy and Risk Management
VISTA Investment Methodology
(1) Long-term Holding Strategy
- Target Investors: Cryptocurrency enthusiasts focused on decentralized exchange innovations, Layer 2 adoption believers, and patient capital allocators
- Operational Recommendations:
- Dollar-cost averaging (DCA) approach: Regular purchases at fixed intervals to reduce timing risk, particularly during market downturns
- Accumulation during bearish sentiment: The token has experienced an 88.34% decline over the past year, potentially offering entry opportunities for long-term believers
- Secure storage: Hold VISTA tokens on Gate.com after purchase, utilizing their secure custody features for medium-term positions
(2) Active Trading Strategy
- Technical Analysis Considerations:
- Volatility Assessment: With a 24-hour price range of $2.75 to $3.05, monitor intraday support and resistance levels
- Trend Analysis: Observe whether the token can sustain the recent 1.51% 24-hour gain against the -20.95% monthly decline
- Wave Trading Key Points:
- Entry signals: Identify oversold conditions during bearish phases, particularly when price approaches the all-time low of $2.724
- Exit strategies: Set profit targets at resistance levels, considering the historical all-time high of $76.689 as a long-term reference point
VISTA Risk Management Framework
(1) Asset Allocation Principles
- Conservative Investors: 1-3% of total crypto portfolio allocation
- Active Investors: 3-8% of total crypto portfolio allocation
- Professional Investors: Up to 15% of total crypto portfolio allocation, with hedging instruments
(2) Risk Hedging Solutions
- Portfolio Diversification: Balance VISTA holdings with established Layer 1 and Layer 2 tokens to mitigate concentration risk
- Position Sizing: Implement strict position limits relative to overall portfolio size to contain potential losses
(3) Secure Storage Solutions
- Exchange Storage: Gate.com custody for active trading positions, with two-factor authentication enabled
- Security Precautions: Enable withdrawal whitelisting, use hardware security keys for high-value accounts, and regularly audit transaction history
V. VISTA Potential Risks and Challenges
VISTA Market Risk
- Extreme Price Volatility: The token has declined 88.34% over one year, with a price floor established only on December 17, 2025, indicating extreme volatility and potential further downside
- Low Trading Volume: Daily trading volume of $23,424.71 suggests limited liquidity, making large position exits potentially difficult without significant price slippage
- Market Cap Concentration: With a relatively small market capitalization of $2.89 million, the token is susceptible to manipulation and sudden price swings
VISTA Regulatory Risk
- DeFi Regulatory Uncertainty: Decentralized exchange protocols face evolving regulatory frameworks globally, with potential restrictions impacting platform usage and token value
- Compliance Requirements: Future regulatory changes could impose operational constraints on Ethereum and Layer 2 networks, affecting VISTA's utility
- Legal Challenges: Potential enforcement actions against DeFi platforms could directly impact the project's viability
VISTA Technical Risk
- Smart Contract Vulnerability: As an ERC-20 token on Ethereum, VISTA depends on the security of its underlying smart contracts and the Ethereum network
- Layer 2 Dependency: The project's focus on Layer 2 solutions introduces technical risks associated with bridge security and scaling protocol stability
- Early-Stage Development: Limited historical performance data suggests the protocol may still be in active development phases with potential unresolved technical issues
VI. Conclusion and Action Recommendations
VISTA Investment Value Assessment
EtherVista (VISTA) represents a speculative investment in the decentralized exchange innovation space. The project positions itself as a new standard for DEXs on Ethereum and Layer 2 solutions, addressing critical infrastructure needs in the DeFi ecosystem. However, the token's 88.34% year-to-date decline, minimal trading volume, and small market capitalization indicate significant risk factors. The project shows potential for appreciation if Layer 2 adoption accelerates and the DEX protocol gains market traction, but current metrics suggest this remains a high-risk, high-reward opportunity suitable only for risk-tolerant investors with a strong conviction in the underlying protocol's technology.
VISTA Investment Recommendations
✅ Beginners: Start with minimal positions (0.5-1% of crypto portfolio) through Gate.com, using dollar-cost averaging over 3-6 months to understand the project's development trajectory before increasing exposure
✅ Experienced Investors: Conduct detailed protocol analysis and smart contract audits; consider 3-5% allocations while monitoring Layer 2 ecosystem developments; utilize technical analysis for tactical entry and exit opportunities
✅ Institutional Investors: Engage with the project's development team to assess roadmap credibility; consider strategic partnerships if the protocol demonstrates significant adoption metrics; maintain strict position limits due to liquidity constraints
VISTA Trading Participation Methods
- Spot Trading: Purchase VISTA directly on Gate.com using ETH or stablecoins for immediate ownership
- Liquidity Provision: Participate in decentralized liquidity pools on supported Layer 2 networks to earn additional yield (with associated smart contract risks)
- Periodic Rebalancing: Review and adjust VISTA holdings quarterly based on DEX market adoption rates and competitive protocol developments
Cryptocurrency investment carries extreme risk. This report does not constitute investment advice. Investors should make decisions based on their risk tolerance and are strongly advised to consult professional financial advisors. Never invest more than you can afford to lose.
FAQ
Is Vista a good stock to buy?
Vista demonstrates strong market potential with positive technical indicators and solid fundamentals. Current market conditions suggest favorable entry opportunities for investors seeking growth exposure. Consider your investment goals and risk tolerance for optimal results.
What is the target price for Vista Energy?
The target price for Vista Energy ranges from $50.00 to $88.00, with an average target of $69.00, representing a potential 48.5% increase from current levels.
How much is Vista token worth today?
As of today, Vista token is worth $2.85. The 24-hour trading volume is $325,388, with a price increase of 1.99% in the last day.
What factors influence VISTA price predictions?
VISTA price predictions are influenced by market fundamentals, transaction volume, social media sentiment, project developments, and overall crypto market conditions. These factors combined help forecast potential price movements.
VISTA has shown fluctuating price movements historically. Expert forecasts range from $50.00 to $88.00, with an average target representing a 48.5% potential increase from recent levels.
* The information is not intended to be and does not constitute financial advice or any other recommendation of any sort offered or endorsed by Gate.