# 2025 XNL Price Prediction: Expert Analysis and Market Forecast for the Year Ahead
## Article Overview
This comprehensive analysis examines Novastro (XNL), a cross-chain Real-World Asset tokenization platform, providing professional price forecasts through 2031. The article synthesizes historical price patterns, market supply dynamics, and ecosystem developments to deliver actionable investment strategies. Designed for cryptocurrency investors across experience levels, it addresses portfolio allocation optimization, risk management, and trading methodologies specific to emerging RWA tokens. The XNL price forecast ranges from $0.00054-$0.00136 through 2031, incorporating conservative, neutral, and optimistic scenarios grounded in technology adoption and market maturation timelines.
---
## Article Structure
**I. Market Position & Current Status** — Reviews XNL's all-time high ($0.046) and subsequent 98.73% correction to current trading levels ($0.0006685 as of January 2026), analyzing holder distribution
Introduction: Market Position and Investment Value of XNL
Novastro (XNL) is a cross-chain Real-World Asset (RWA) platform that enables seamless tokenization of tangible assets on the Ethereum ledger, ensuring regulatory compliance and verifiable ownership. The platform integrates AI-powered yield optimization mechanisms, dynamically compounding returns from RWA-backed stable assets such as real estate, credit, and commodities. As of January 2026, XNL has achieved a market capitalization of $668,500, with a circulating supply of approximately 200 million tokens trading at around $0.0006685. This innovative asset is playing an increasingly critical role in transforming real-world yields into scalable, on-chain opportunities within a decentralized, trust-anchored ecosystem.
This article will provide a comprehensive analysis of XNL's price trends and market dynamics, combining historical price patterns, market supply and demand factors, and ecosystem developments to deliver professional price forecasts and practical investment strategies for investors seeking exposure to the RWA tokenization sector.
I. XNL Price History Review and Current Market Status
XNL Historical Price Evolution
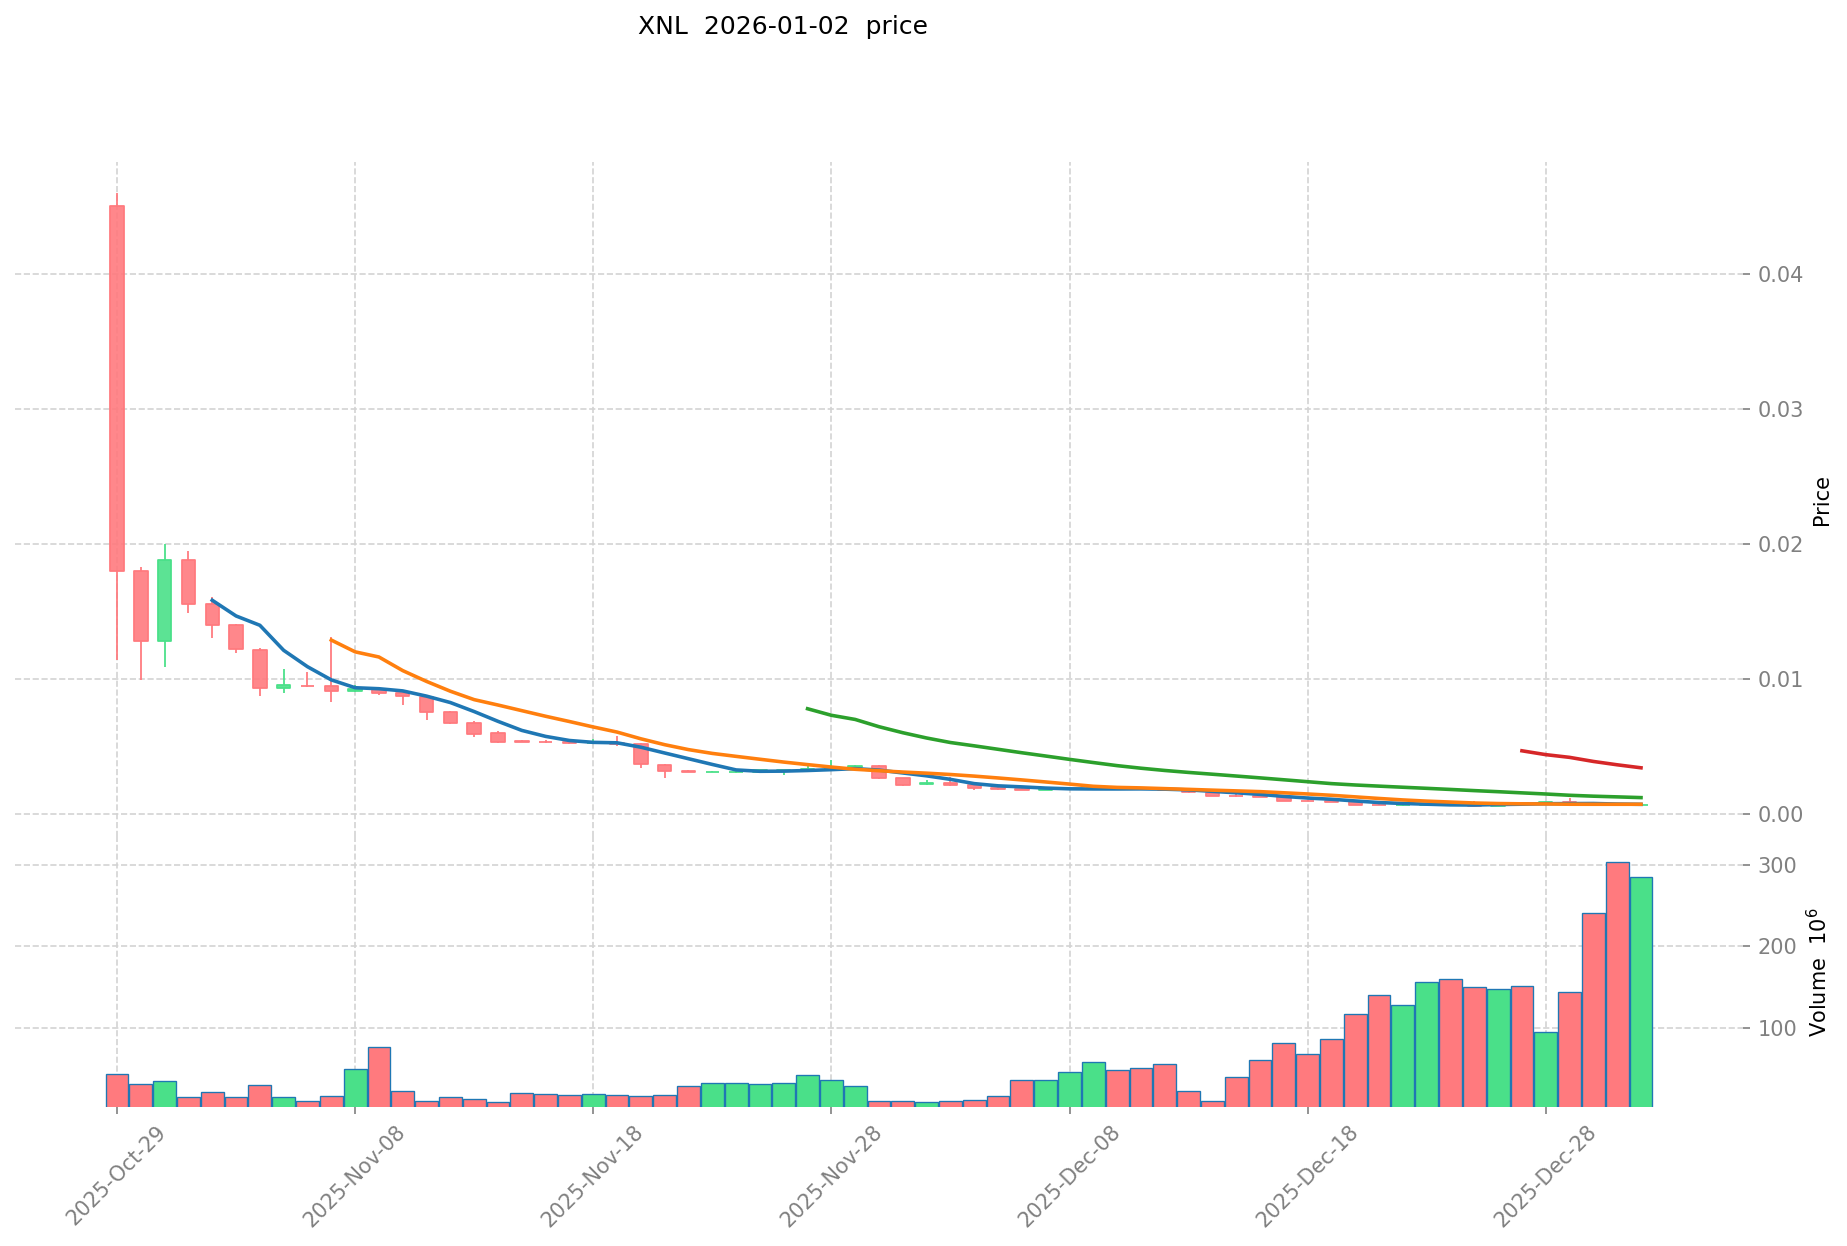
Based on available data, XNL reached its all-time high (ATH) of $0.046 on October 29, 2025, marking the peak of investor interest in the Novastro platform during its early trading phase. The token subsequently experienced significant downward pressure, declining to its all-time low (ATL) of $0.0005841 on December 29, 2025. This represents a substantial correction of approximately 98.73% from the peak, reflecting the volatility characteristic of emerging RWA platform tokens during their initial market discovery phase.
XNL Current Market Stance
As of January 3, 2026, XNL is trading at $0.0006685, positioned marginally above its all-time low. The token has demonstrated modest recovery momentum over the past 24 hours, with a price increase of 2.48% (approximately +$0.000016). However, broader timeframe analysis reveals persistent downward pressure: the 7-day period shows a decline of 8.46%, while the 30-day performance reflects a steeper contraction of 69.03%.
The current market capitalization stands at approximately $133,700, with a fully diluted valuation of $668,500 based on the maximum supply of 1 billion tokens. Trading volume over the past 24 hours reached $136,127.53, indicating liquidity activity despite the token's depressed price levels. XNL maintains a ranking of 4,579 by market capitalization.
The token's holder base comprises 12,196 addresses, suggesting a distributed ownership structure during the early adoption phase. XNL trades on the Binance Smart Chain (BSC) network under the contract address 0xdfeb13936a8975f9f788e73fb93861ce461541f9, with Gate.com serving as the primary trading venue.
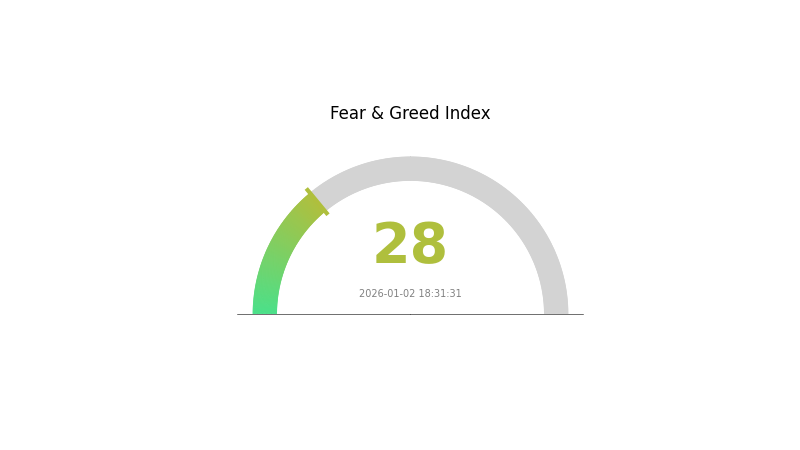
Current market sentiment reflects cautious positioning, with fear indicators (VIX: 28) prevailing in broader market conditions as of January 2, 2026.
Click to view current XNL market price
XNL Market Sentiment Index
2026-01-02 Fear and Greed Index: 28 (Fear)
Click to view the current Fear & Greed Index
The cryptocurrency market is currently experiencing a pronounced fear sentiment with the index standing at 28. This reading indicates heightened investor anxiety and risk aversion across the market. During such periods, market participants tend to adopt defensive positions, leading to increased selling pressure and price volatility. Traders should exercise caution and conduct thorough due diligence before making investment decisions. This fear-driven environment may present contrarian opportunities for long-term investors, though careful risk management remains essential. Monitor market developments closely on Gate.com for real-time data and trading opportunities.
XNL Holdings Distribution
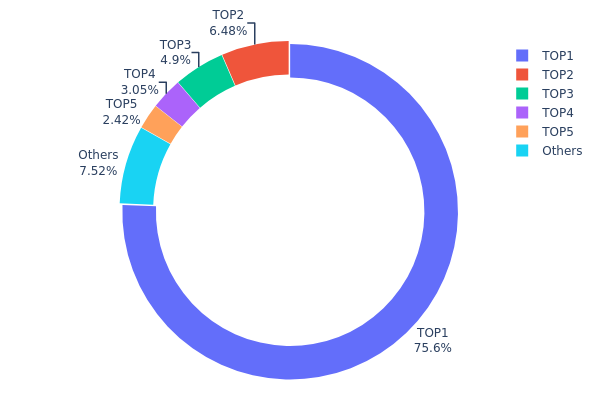
The address holdings distribution map illustrates the concentration of token ownership across the blockchain network by tracking the top holders and their respective share of total circulating supply. This metric serves as a critical indicator for assessing decentralization levels, potential market manipulation risks, and overall network health.
XNL currently exhibits pronounced concentration characteristics, with the top holder controlling 75.63% of the total supply, representing a significant centralization risk. The top five addresses collectively account for 92.46% of all holdings, leaving merely 7.54% distributed among remaining addresses. This extreme concentration pattern suggests that a minimal number of stakeholders maintain overwhelming control over token liquidity and governance decisions. Such distribution dynamics create a fragmented market structure where price discovery mechanisms may be substantially compromised, and the potential for coordinated selling or supply-side shocks remains elevated.
The current holdings distribution presents considerable implications for market microstructure and price stability. With three-quarters of supply concentrated in a single address, the XNL market exhibits heightened vulnerability to sudden liquidation events or strategic token releases, which could induce significant downward price pressure. Furthermore, the steep concentration gradient demonstrates limited retail participation and organic community involvement, indicating that XNL's decentralization quotient remains substantially underdeveloped. The token architecture reflects characteristics typical of early-stage or centrally-managed projects, where principal stakeholders maintain disproportionate leverage over market dynamics and protocol development trajectories.
View current XNL holdings distribution
| Top |
Address |
Holding Qty |
Holding (%) |
| 1 |
0xa028...96b14f |
755710.10K |
75.63% |
| 2 |
0xb8aa...04f5c5 |
64746.36K |
6.48% |
| 3 |
0x53f7...f3fa23 |
48913.54K |
4.89% |
| 4 |
0x0d07...b492fe |
30436.74K |
3.04% |
| 5 |
0x09d8...ee72c6 |
24185.54K |
2.42% |
| - |
Others |
75179.12K |
7.54% |
II. Core Factors Influencing XNL Future Price
Supply Mechanism
-
Total Supply and Circulation: XNL has a total supply of 1,000,000,000 tokens with approximately 200,000,020 tokens currently in circulation, directly impacting price and investment value.
-
Token Unlock Event Impact: At the Token Generation Event (TGE) on October 29th, all tokens were unlocked simultaneously, creating instant market oversupply. This caused XNL price to plummet over 70% from the public sale price of $0.05 USD to approximately $0.014-0.015 USD, demonstrating the significant price pressure from massive supply release.
-
Current Market Supply Dynamics: The concentration of holdings shows the top wallet holds 54.52% of circulating supply, with the top five addresses controlling approximately 78.52% of tokens, indicating potential liquidity constraints and price volatility risks.
Technology Development and Ecosystem Construction
-
AI-Driven RWA Layer 2 Blockchain: Novastro operates as an AI-driven Real-World Asset (RWA) Layer 2 blockchain integrating MoveVM and EigenLayer AVS technology, designed to provide Ethereum-level security while significantly reducing transaction costs.
-
Modular RWA Ledger Architecture: As a modular RWA ledger based on Ethereum, Novastro enables tokenization of traditional financial assets such as real estate, bonds, and commodities into freely tradable digital assets.
-
Regulatory-Compliant Solutions: Novastro provides end-to-end turnkey solutions for projects seeking tokenization, encompassing the complete workflow from asset onboarding to trading with regulatory compliance built-in.
-
Planned Ecosystem Enhancements: Staking functionality and blockchain explorer features scheduled for Q2 2025 are expected to increase XNL use cases and demand, potentially supporting price recovery.
-
DeFi, NFT and Payment Integration: Combination of DeFi, NFT, and payment applications with real-world asset integration enhances XNL investment value by expanding ecosystem utility.
III. 2026-2031 XNL Price Forecast
2026 Outlook
- Conservative Forecast: $0.00054 - $0.00067
- Neutral Forecast: $0.00067 (average price)
- Optimistic Forecast: $0.00074 (potential resistance level)
2027-2028 Medium-term Outlook
- Market Stage Expectation: Consolidation phase with gradual recovery, characterized by modest price appreciation and stabilizing trading patterns as market sentiment gradually strengthens.
- Price Range Predictions:
- 2027: $0.00037 - $0.00074 (5% upside potential)
- 2028: $0.00043 - $0.00074 (7% upside potential)
- Key Catalysts: Accumulation by institutional investors, improved market liquidity, positive regulatory developments, and strengthening fundamental adoption metrics.
2029-2031 Long-term Outlook
- Base Case Scenario: $0.00052 - $0.00101 (assuming moderate market expansion and steady institutional participation by 2029)
- Optimistic Scenario: $0.00085 - $0.00136 (assuming accelerated adoption and positive macroeconomic conditions through 2031)
- Transformative Scenario: $0.00121 - $0.00136 (under extreme favorable conditions including mainstream institutional adoption, regulatory clarity, and market-wide cryptocurrency expansion by 2030-2031)
- 2031-12-31: XNL $0.00136 (potential peak with 55% cumulative gain from current levels)
| 年份 |
预测最高价 |
预测平均价格 |
预测最低价 |
涨跌幅 |
| 2026 |
0.00074 |
0.00067 |
0.00054 |
0 |
| 2027 |
0.00074 |
0.0007 |
0.00037 |
5 |
| 2028 |
0.00074 |
0.00072 |
0.00043 |
7 |
| 2029 |
0.00101 |
0.00073 |
0.00052 |
9 |
| 2030 |
0.00121 |
0.00087 |
0.00085 |
30 |
| 2031 |
0.00136 |
0.00104 |
0.00056 |
55 |
Novastro (XNL) Professional Investment Strategy and Risk Management Report
IV. XNL Professional Investment Strategy and Risk Management
XNL Investment Methodology
(1) Long-Term Holding Strategy
- Target Investors: RWA ecosystem believers, yield-seeking investors, and those with medium to long-term investment horizons
- Operational Recommendations:
- Accumulate XNL during market downturns, particularly when prices drop below $0.0006 support levels
- Hold tokens for minimum 12-24 months to benefit from AI-driven yield optimization mechanisms
- Participate in platform governance to earn additional rewards while maintaining core positions
(2) Active Trading Strategy
- Technical Analysis Tools:
- Support and Resistance Levels: Monitor key levels at $0.0006307 (24H low) and $0.0007359 (24H high); breakouts above $0.0007359 suggest bullish momentum
- Volume Analysis: Track 24H volume trends against the $136,127.53 baseline; volume spikes above 150% indicate potential trend reversals
- Wave Trading Key Points:
- Enter positions during oversold conditions (RSI below 30) after confirming support hold
- Take partial profits at resistance levels, particularly around $0.001 to $0.002 psychological zones
- Implement trailing stops to protect gains during volatile market cycles
XNL Risk Management Framework
(1) Asset Allocation Principles
- Conservative Investors: 2-5% of digital asset portfolio
- Active Investors: 5-10% of digital asset portfolio
- Professional Investors: 10-15% of digital asset portfolio
(2) Risk Hedging Solutions
- Stablecoin Reserve Strategy: Maintain 30-40% of investment value in stablecoins to average down during significant drawdowns
- Position Sizing: Never allocate more than 3-5% of total investment capital to any single RWA token position
(3) Secure Storage Solutions
- Self-Custody Approach: Transfer XNL tokens to personal wallet addresses after purchase on Gate.com for enhanced security
- Exchange Storage: Keep minimal trading balances on Gate.com, utilizing the platform's institutional-grade security for active trading operations
- Security Best Practices: Enable two-factor authentication on Gate.com accounts, use hardware-grade security protocols, and never share private keys or seed phrases with third parties
V. XNL Potential Risks and Challenges
XNL Market Risks
- Liquidity Risk: With 24H trading volume of $136,127.53 and market cap of $133,700.01, relatively low liquidity may result in significant slippage during large transactions
- Volatility Exposure: The token experienced a -69.03% decline over 30 days, demonstrating extreme price volatility that can result in substantial capital losses
- Market Adoption Risk: As an emerging RWA platform, adoption rates remain uncertain; failure to attract institutional capital could severely impact token valuation
XNL Regulatory Risks
- RWA Compliance Uncertainty: Regulatory frameworks for tokenized real-world assets remain nascent globally; future regulatory changes could restrict platform operations or token utility
- Jurisdiction-Specific Restrictions: Different regulatory environments may prohibit RWA token trading or restrict certain use cases by geography
- Securities Classification Risk: Depending on regulatory interpretation, XNL could potentially be classified as a security, triggering stricter compliance requirements
XNL Technology Risks
- Smart Contract Vulnerabilities: AI-driven yield optimization mechanisms introduce complexity that could harbor undiscovered security flaws or exploits
- Cross-Chain Bridge Risk: Multi-chain deployment increases exposure to bridge-related vulnerabilities and potential asset loss scenarios
- AI Model Risk: Reliance on AI-powered yield algorithms creates dependency on model accuracy; algorithmic failures could generate poor returns or liquidation events
VI. Conclusions and Action Recommendations
XNL Investment Value Assessment
Novastro presents a compelling opportunity within the RWA sector by bridging traditional finance with blockchain infrastructure through AI-optimized yield mechanisms. The platform's focus on regulated, tangible asset backing differentiates it from speculative altcoins. However, significant headwinds include extreme recent volatility (-69.03% monthly decline), low liquidity relative to market cap, and early-stage regulatory uncertainty. The token's recent peak of $0.046 followed by 98.5% decline to current levels ($0.0006685) suggests extreme sentiment shifts and high execution risk. Investment suitability depends heavily on individual risk tolerance and conviction in RWA market maturation timelines.
XNL Investment Recommendations
✅ Beginners: Start with 1-2% portfolio allocation; dollar-cost average small positions over 3-6 months while researching platform fundamentals; prioritize holding over active trading
✅ Experienced Investors: Allocate 5-10% of digital asset portfolio; combine long-term staking positions with tactical trading around key support/resistance levels; monitor AI yield optimization performance quarterly
✅ Institutional Investors: Consider 10-15% allocation for diversified RWA exposure; engage with Novastro governance; negotiate OTC trading arrangements on Gate.com for large position accumulation
XNL Trading Participation Methods
- Gate.com Spot Trading: Direct XNL/USDT trading pairs with real-time market price discovery and professional-grade order management tools
- Dollar-Cost Averaging: Execute systematic purchase programs over extended periods to reduce timing risk and average acquisition costs
- Governance Participation: Hold XNL tokens to participate in platform governance decisions and potentially earn additional governance rewards
Cryptocurrency investments carry extreme risk. This report does not constitute investment advice. Investors must make decisions based on personal risk tolerance and financial circumstances. Professional financial consultation is strongly recommended. Never invest capital you cannot afford to lose entirely.
FAQ
What is XNL token? What is its project background and use case?
XNL is the native cryptocurrency of Chronicle, an ERC-20 utility token on Ethereum. It enables exclusive access, community governance, discounts, and rewards within the Chronicle ecosystem.
XNL has demonstrated strong upward momentum over the past year, reaching historical highs in late 2025. The token experienced significant price appreciation, with trading volume increasing substantially. Market sentiment has remained positive, though normal market corrections occurred during the period. As of January 2, 2026, XNL continues to maintain elevated price levels compared to previous years.
How will XNL price be predicted for 2024-2025? What factors will influence the price?
XNL price in 2024-2025 is projected to range from $0.004 to $0.01077, influenced by blockchain gaming adoption, market conditions, technological advancements, and macroeconomic trends. Key factors include trading volume and regulatory changes.
What are the main risks of investing in XNL and what should investors pay attention to?
XNL investment risks include market volatility, regulatory changes, and technology failures. Monitor market dynamics closely and make careful investment decisions based on thorough research and risk tolerance.
What are the advantages or disadvantages of XNL compared to similar tokens?
XNL offers low transaction fees and fast confirmation times. However, it faces competition from similar efficient cryptocurrencies like Nano and Litecoin in the market.
What are the technical and fundamental analysis methods for XNL?
Technical analysis examines XNL price trends and trading volume patterns. Fundamental analysis evaluates project technology, team capability, market adoption, and tokenomics. Combining both approaches helps identify investment opportunities comprehensively.
Where is XNL listed? How is the liquidity?
XNL is listed on major exchanges including KuCoin, MEXC, and Gate.com. However, liquidity remains relatively weak, which may contribute to significant price volatility in the market.
* The information is not intended to be and does not constitute financial advice or any other recommendation of any sort offered or endorsed by Gate.