This comprehensive CORN price analysis examines the Bitcoin utility token's market trajectory from 2026-2031, providing professional forecasts and investment strategies. The article evaluates CORN's current $37 million market cap, historical price evolution, and supply-demand dynamics to deliver predictions ranging from conservative to optimistic scenarios. Key sections address ecosystem development catalysts, technical analysis frameworks, and risk management protocols tailored for different investor profiles. With detailed holding distribution analysis revealing 49.38% concentration and token concentration risks, the guide offers actionable recommendations for spot trading and dollar-cost averaging on Gate exchange. Investors gain insights into smart contract vulnerabilities, regulatory considerations, and strategic allocation principles (1-10% based on risk tolerance) to navigate this early-stage Bitcoin infrastructure protocol effectively.
Introduction: CORN's Market Position and Investment Value
Corn (CORN), positioned as an innovative protocol that enhances Bitcoin's utility and accessibility, has been making significant strides in the cryptocurrency ecosystem since its launch. As of January 2026, Corn has achieved a market capitalization of approximately $37 million, with a circulating supply of 525 million tokens and a current price hovering around $0.07. This asset, described as "a better way to use Bitcoin," is playing an increasingly important role in unlocking earning opportunities for Bitcoin holders and expanding BTC's practical applications.
Backed by prominent venture capital firms including Polychain Capital, Framework, and Tribe Capital, along with over 1,000 ICO participants, Corn successfully raised $16.5 million to support Bitcoin's expansion and ecosystem development. The project's protocol stack aims to release Bitcoin's utility while the CORN token fuels its growing ecosystem and brand presence.
This article will comprehensively analyze CORN's price trajectory from 2026 through 2031, combining historical patterns, market supply-demand dynamics, ecosystem development, and macroeconomic factors to provide investors with professional price forecasts and practical investment strategies. With a fully diluted market cap of $148 million and a market cap to FDV ratio of 25%, CORN presents a unique opportunity in the Bitcoin-adjacent infrastructure space that warrants careful examination.
I. CORN Price History Review and Market Status
CORN Historical Price Evolution Trajectory
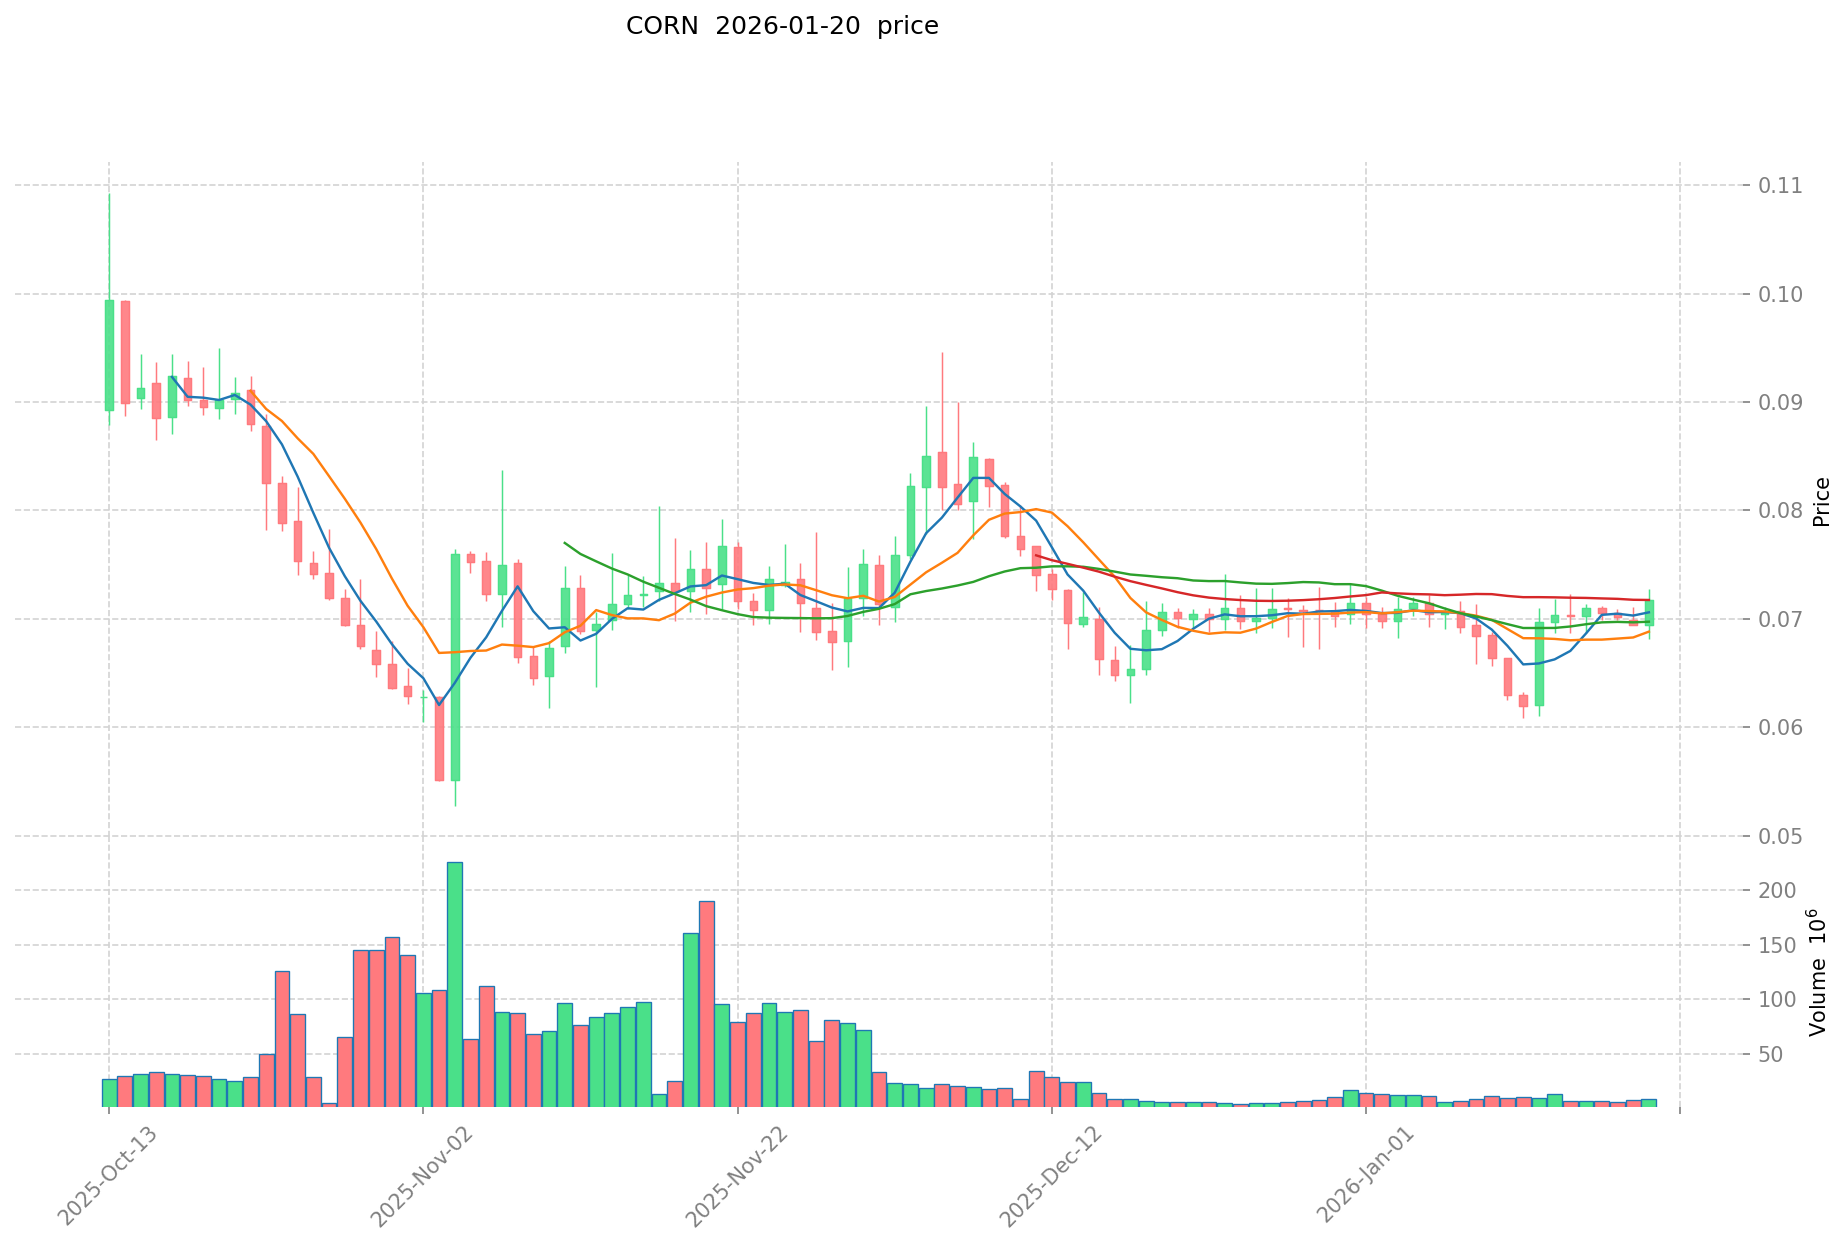
- 2025: Token launched in early 2025, experiencing significant volatility with price reaching $13.986 in February 2025
- 2025: Price underwent substantial correction throughout the year, declining to $0.05271 in November 2025
- 2025-2026: Market entered consolidation phase, with price stabilizing around $0.07 range after the November low
CORN Current Market Dynamics
As of January 20, 2026, CORN is trading at $0.07049, showing a modest increase of 1.3% over the past 24 hours. The token has demonstrated mixed short-term performance, with a slight decline of 0.98% over the past week, while maintaining relative stability on a monthly basis with only a 0.04% decrease.
The market capitalization stands at $37.01 million, with a circulating supply of 525 million tokens representing 25% of the total supply of 2.1 billion CORN. The fully diluted market cap is calculated at $148.03 million. Daily trading volume has reached $747,728, indicating moderate market activity.
CORN's market dominance remains at 0.0045%, positioning it as a mid-cap asset within the broader cryptocurrency landscape. The token is currently trading significantly below its February 2025 peak, representing approximately 99.5% down from that level, while showing a 33.7% recovery from its November 2025 low.
The project maintains active community engagement with 714 token holders and is listed across 6 cryptocurrency exchanges. Market sentiment indicators reflect a fear reading of 32 on the volatility index, suggesting cautious investor positioning in the current environment.
Click to view current CORN market price
CORN Market Sentiment Index
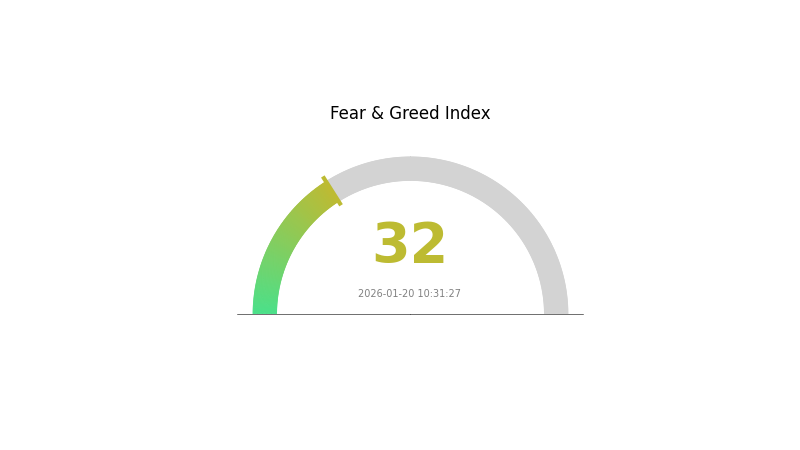
2026-01-20 Fear and Greed Index: 32 (Fear)
Click to view the current Fear & Greed Index
The CORN market sentiment index has reached 32, indicating a strong fear sentiment in the cryptocurrency market. This fear level suggests that investors are becoming increasingly cautious and risk-averse. During such periods, market volatility tends to increase as selling pressure builds up. Traders should exercise caution and consider their risk management strategies carefully. However, historically, extreme fear has often presented opportunities for long-term investors to accumulate positions at lower valuations. Monitor market developments closely on Gate.com to make informed investment decisions.
CORN Holding Distribution
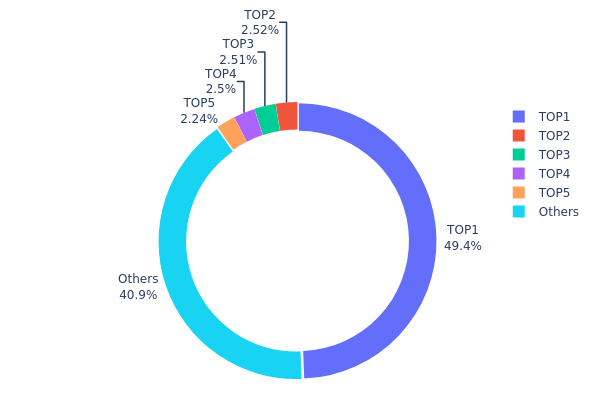
The holding distribution chart visually represents the allocation of CORN tokens across different wallet addresses, offering insights into the token's ownership structure and concentration levels. This metric is crucial for understanding whether token holdings are widely distributed among numerous participants or concentrated in the hands of a few large holders, which directly impacts market dynamics and price stability.
Based on the current data, CORN exhibits a notably high concentration pattern. The top address alone controls approximately 618.27 million tokens, accounting for 49.38% of the total supply—nearly half of all circulating tokens. The top five addresses collectively hold 740.48 million tokens, representing 59.13% of the supply. This indicates that a significant majority of CORN tokens are concentrated among a small number of entities, while the remaining 40.88% is distributed among all other holders.
Such concentrated holding distribution presents several market implications. The dominant position of the largest holder creates potential vulnerability to significant price volatility, as large-scale transactions from this address could substantially impact market liquidity and price stability. This concentration level also raises concerns about potential market manipulation risks and limits the token's decentralization characteristics. From a market structure perspective, this distribution suggests that CORN's on-chain structure is currently imbalanced, with price discovery heavily influenced by the actions of major holders rather than reflecting broader market consensus.
Click to view current CORN Holding Distribution
| Top |
Address |
Holding Qty |
Holding (%) |
| 1 |
0x9896...098ff9 |
618270.00K |
49.38% |
| 2 |
0xe71e...e13508 |
31500.00K |
2.51% |
| 3 |
0x6f82...cecce7 |
31403.40K |
2.50% |
| 4 |
0x3179...bdccb3 |
31306.80K |
2.50% |
| 5 |
0xb53d...fbbaaf |
28000.00K |
2.23% |
| - |
Others |
511579.05K |
40.88% |
II. Core Factors Affecting CORN's Future Price
Based on the available information, there is currently insufficient data to provide a comprehensive analysis of the core factors that may influence CORN's future price movements. Key aspects such as supply mechanisms, institutional holdings, macroeconomic correlations, and technical developments require more detailed information to present an accurate assessment.
As market conditions evolve and more data becomes available, a more thorough analysis of CORN's price drivers can be conducted. Investors are advised to conduct their own research and stay informed about project developments through official channels.
III. 2026-2031 CORN Price Forecast
2026 Outlook
- Conservative prediction: $0.0622 - $0.07068
- Neutral prediction: $0.07068
- Optimistic prediction: $0.08411 (subject to favorable market conditions)
2027-2029 Mid-term Outlook
- Market stage expectations: CORN is anticipated to enter a gradual development phase with moderate volatility, as the token seeks to establish broader market recognition and utility adoption.
- Price range forecasts:
- 2027: $0.05495 - $0.08204, with an average around $0.07739
- 2028: $0.06616 - $0.08609, with an average around $0.07972
- 2029: $0.04643 - $0.11773, with an average around $0.08291
- Key catalysts: Expansion of ecosystem partnerships, increased trading volume on major platforms like Gate.com, and potential integration with DeFi protocols could serve as primary drivers for price appreciation during this period.
2030-2031 Long-term Outlook
- Baseline scenario: $0.05818 - $0.10533 in 2030, averaging $0.10032 (assuming steady ecosystem growth and market stability)
- Optimistic scenario: $0.06889 - $0.1275 in 2031, averaging $0.10282 (contingent upon successful technological implementations and broader market adoption)
- Transformational scenario: Potential to reach upper ranges exceeding $0.12 (dependent upon significant breakthrough developments in utility applications and mainstream institutional interest)
- 2026-01-20: CORN demonstrates early-stage price discovery with projected annual growth ranging from 9% to 45% over the forecast period, indicating potential long-term appreciation trends.
| Year |
Predicted High Price |
Predicted Average Price |
Predicted Low Price |
Price Change |
| 2026 |
0.08411 |
0.07068 |
0.0622 |
0 |
| 2027 |
0.08204 |
0.07739 |
0.05495 |
9 |
| 2028 |
0.08609 |
0.07972 |
0.06616 |
13 |
| 2029 |
0.11773 |
0.08291 |
0.04643 |
17 |
| 2030 |
0.10533 |
0.10032 |
0.05818 |
42 |
| 2031 |
0.1275 |
0.10282 |
0.06889 |
45 |
IV. CORN Professional Investment Strategy and Risk Management
CORN Investment Methodology
(1) Long-term Holding Strategy
- Target Investors: Believers in Bitcoin ecosystem expansion and investors seeking exposure to BTC utility protocols
- Operational Recommendations:
- Consider dollar-cost averaging (DCA) during market corrections to build positions gradually
- Monitor project development milestones and ecosystem growth metrics quarterly
- Utilize secure storage solutions such as Gate Web3 Wallet for long-term custody
(2) Active Trading Strategy
- Technical Analysis Tools:
- Volume Profile: Analyze the $0.0527-$0.0727 range to identify key support and resistance levels based on trading volume concentration
- Moving Averages: Track short-term (7-day) and medium-term (30-day) trends to identify potential entry and exit points
- Swing Trading Considerations:
- Monitor volatility patterns given the token's recent price fluctuations
- Set stop-loss orders to manage downside risk in this emerging asset
CORN Risk Management Framework
(1) Asset Allocation Principles
- Conservative Investors: 1-2% of cryptocurrency portfolio allocation
- Aggressive Investors: 3-5% of cryptocurrency portfolio allocation
- Professional Investors: Up to 8-10% with active monitoring and hedging strategies
(2) Risk Hedging Solutions
- Portfolio Diversification: Balance CORN exposure with established cryptocurrencies and stablecoins
- Position Sizing: Limit single-position exposure based on risk tolerance and market volatility
(3) Secure Storage Solutions
- Hot Wallet Recommendation: Gate Web3 Wallet for convenient trading and ecosystem participation
- Cold Storage Option: Hardware wallet solutions for long-term holdings exceeding trading needs
- Security Precautions: Enable two-factor authentication, verify contract addresses (0x44f49ff0da2498bcb1d3dc7c0f999578f67fd8c6 on Ethereum), and never share private keys
V. CORN Potential Risks and Challenges
CORN Market Risks
- High Volatility: Token experienced significant price movements with a low of $0.0527 and historical fluctuations requiring careful position management
- Limited Market Depth: With a market cap of approximately $37 million and 24-hour trading volume around $747,000, liquidity constraints may impact large orders
- Early-stage Token: Launched in January 2025 with only 25% of total supply in circulation, presenting uncertainty around token economics and future supply releases
CORN Regulatory Risks
- Bitcoin DeFi Classification: Evolving regulatory frameworks for Bitcoin-based DeFi protocols may impact project operations
- Securities Law Consideration: Token utility and distribution models may face scrutiny under various jurisdictions' securities regulations
- Compliance Requirements: As the project scales, increasing regulatory compliance obligations may affect operational flexibility
CORN Technical Risks
- Smart Contract Vulnerabilities: As an ERC-20 token on Ethereum, exposure to potential contract bugs or exploits exists despite backing from institutional investors
- Network Dependency: Reliance on Ethereum network performance and gas fee fluctuations may impact user experience
- Protocol Development Risk: Early-stage protocol stack development may encounter technical challenges or delays in achieving roadmap objectives
VI. Conclusion and Action Recommendations
CORN Investment Value Assessment
CORN represents an emerging opportunity in Bitcoin utility expansion, backed by notable venture capital firms including Polychain Capital, Framework, and Tribe Capital, with $16.5 million raised to support development. The project aims to enhance Bitcoin's utility through its protocol stack, addressing a genuine market need for accessible BTC earning opportunities. However, investors should recognize the early-stage nature of the project, with only 25% token circulation and limited trading history since its January 2025 launch. The token's volatility and relatively small market capitalization indicate higher risk compared to established cryptocurrencies.
CORN Investment Recommendations
✅ Beginners: Consider starting with minimal exposure (under 2% of crypto portfolio) after thoroughly researching the Bitcoin DeFi ecosystem and understanding the project's value proposition
✅ Experienced Investors: May allocate 3-5% of cryptocurrency portfolio with active monitoring of project milestones, ecosystem adoption metrics, and technical developments
✅ Institutional Investors: Could consider strategic positions with comprehensive due diligence on protocol security, tokenomics roadmap, and risk-adjusted returns within Bitcoin infrastructure thesis
CORN Trading Participation Methods
- Spot Trading: Purchase CORN tokens directly on Gate.com and other supporting exchanges with competitive liquidity
- Dollar-Cost Averaging: Implement systematic investment approach to mitigate timing risk in this volatile asset
- Ecosystem Participation: Engage with Corn protocol features to understand utility value and earn potential yields while holding tokens
Cryptocurrency investment carries extreme risk, and this article does not constitute investment advice. Investors should make prudent decisions based on their own risk tolerance and are advised to consult professional financial advisors. Never invest more than you can afford to lose.
FAQ
What are the main factors affecting CORN price predictions?
CORN price predictions are primarily influenced by agricultural supply and demand dynamics, seasonal crop cycles, global weather patterns, commodity market trends, trading volume, macroeconomic factors, and blockchain network adoption rates.
How to use technical analysis methods to predict corn price trends?
Use support and resistance levels, moving averages, RSI, and MACD indicators. Analyze trading volume patterns, identify trend directions, and monitor key resistance breakouts. Combine chart patterns with momentum indicators for more accurate price predictions.
How significant is the impact of global weather changes on corn price predictions?
Global weather significantly impacts corn prices. Droughts, floods, and temperature fluctuations affect crop yields and supply. Weather patterns are crucial factors in CORN price forecasting models, influencing market trends substantially.
What is the difference between corn futures price prediction and spot price prediction?
Futures predict prices at future contract expiration dates with higher leverage and volatility, while spot prices reflect current market rates. Futures incorporate market expectations and carry more trading volume, making them more sensitive to market sentiment and supply factors.
What are the common data indicators and models used in CORN price prediction?
CORN price prediction typically uses technical indicators like moving averages, RSI, and MACD, combined with fundamental metrics such as trading volume, market cap, and on-chain activity. Machine learning models including LSTM neural networks and regression analysis are commonly employed to forecast price trends based on historical data patterns.
How does the relationship between supply and demand affect the accuracy of corn price predictions?
Supply and demand dynamics are critical drivers of corn price movements. Strong demand growth combined with limited supply typically pushes prices higher, while oversupply pressures prices downward. Accurate prediction models that incorporate real-time supply data, global inventory levels, and trading volume significantly improve forecast precision and help anticipate price trends effectively.
* The information is not intended to be and does not constitute financial advice or any other recommendation of any sort offered or endorsed by Gate.