This comprehensive analysis examines DBR (deBridge) as a cross-chain DeFi liquidity infrastructure token, currently trading at $0.01801 with a $32.42 million market capitalization. The article provides price forecasts from 2026 through 2031, ranging from $0.01511 to $0.04394, supported by technical analysis and market sentiment evaluation (current Fear Index: 24). Key sections cover historical price evolution, market status assessment, holding distribution patterns revealing 70.22% concentration among top five addresses, and identified risk factors including volatility, regulatory uncertainty, and smart contract vulnerabilities. The article presents three investment methodologies—long-term holding, active trading, and dollar-cost averaging—alongside detailed risk management frameworks recommending portfolio allocation between 1-15% depending on investor profile. Suitable for traders and investors seeking strategic exposure to cross-chain DeFi infrastructure while maintaining appropriate risk controls through
Introduction: DBR's Market Position and Investment Value
deBridge (DBR), as a DeFi liquidity infrastructure solution enabling cross-chain asset and information flow, has been establishing its position in the decentralized finance ecosystem since its launch in 2024. As of January 2026, DBR has a market capitalization of approximately $32.42 million, with a circulating supply of 1.8 billion tokens, and its price is maintaining around $0.018. This asset, designed to facilitate seamless cross-chain interactions without traditional liquidity pool bottlenecks, is playing an increasingly important role in the DeFi interoperability space.
This article will comprehensively analyze DBR's price trends from 2026 to 2031, combining historical patterns, market supply and demand dynamics, ecosystem development, and macroeconomic conditions to provide investors with professional price forecasts and practical investment strategies.
I. DBR Price History Review and Market Status
DBR Historical Price Evolution Trajectory
- 2024: DBR was launched on October 16, 2024, with a publish price of $0.03, experiencing initial market volatility as the token entered circulation
- 2024: The token reached its peak price of $0.05764 on December 22, 2024, representing a substantial appreciation from its launch price
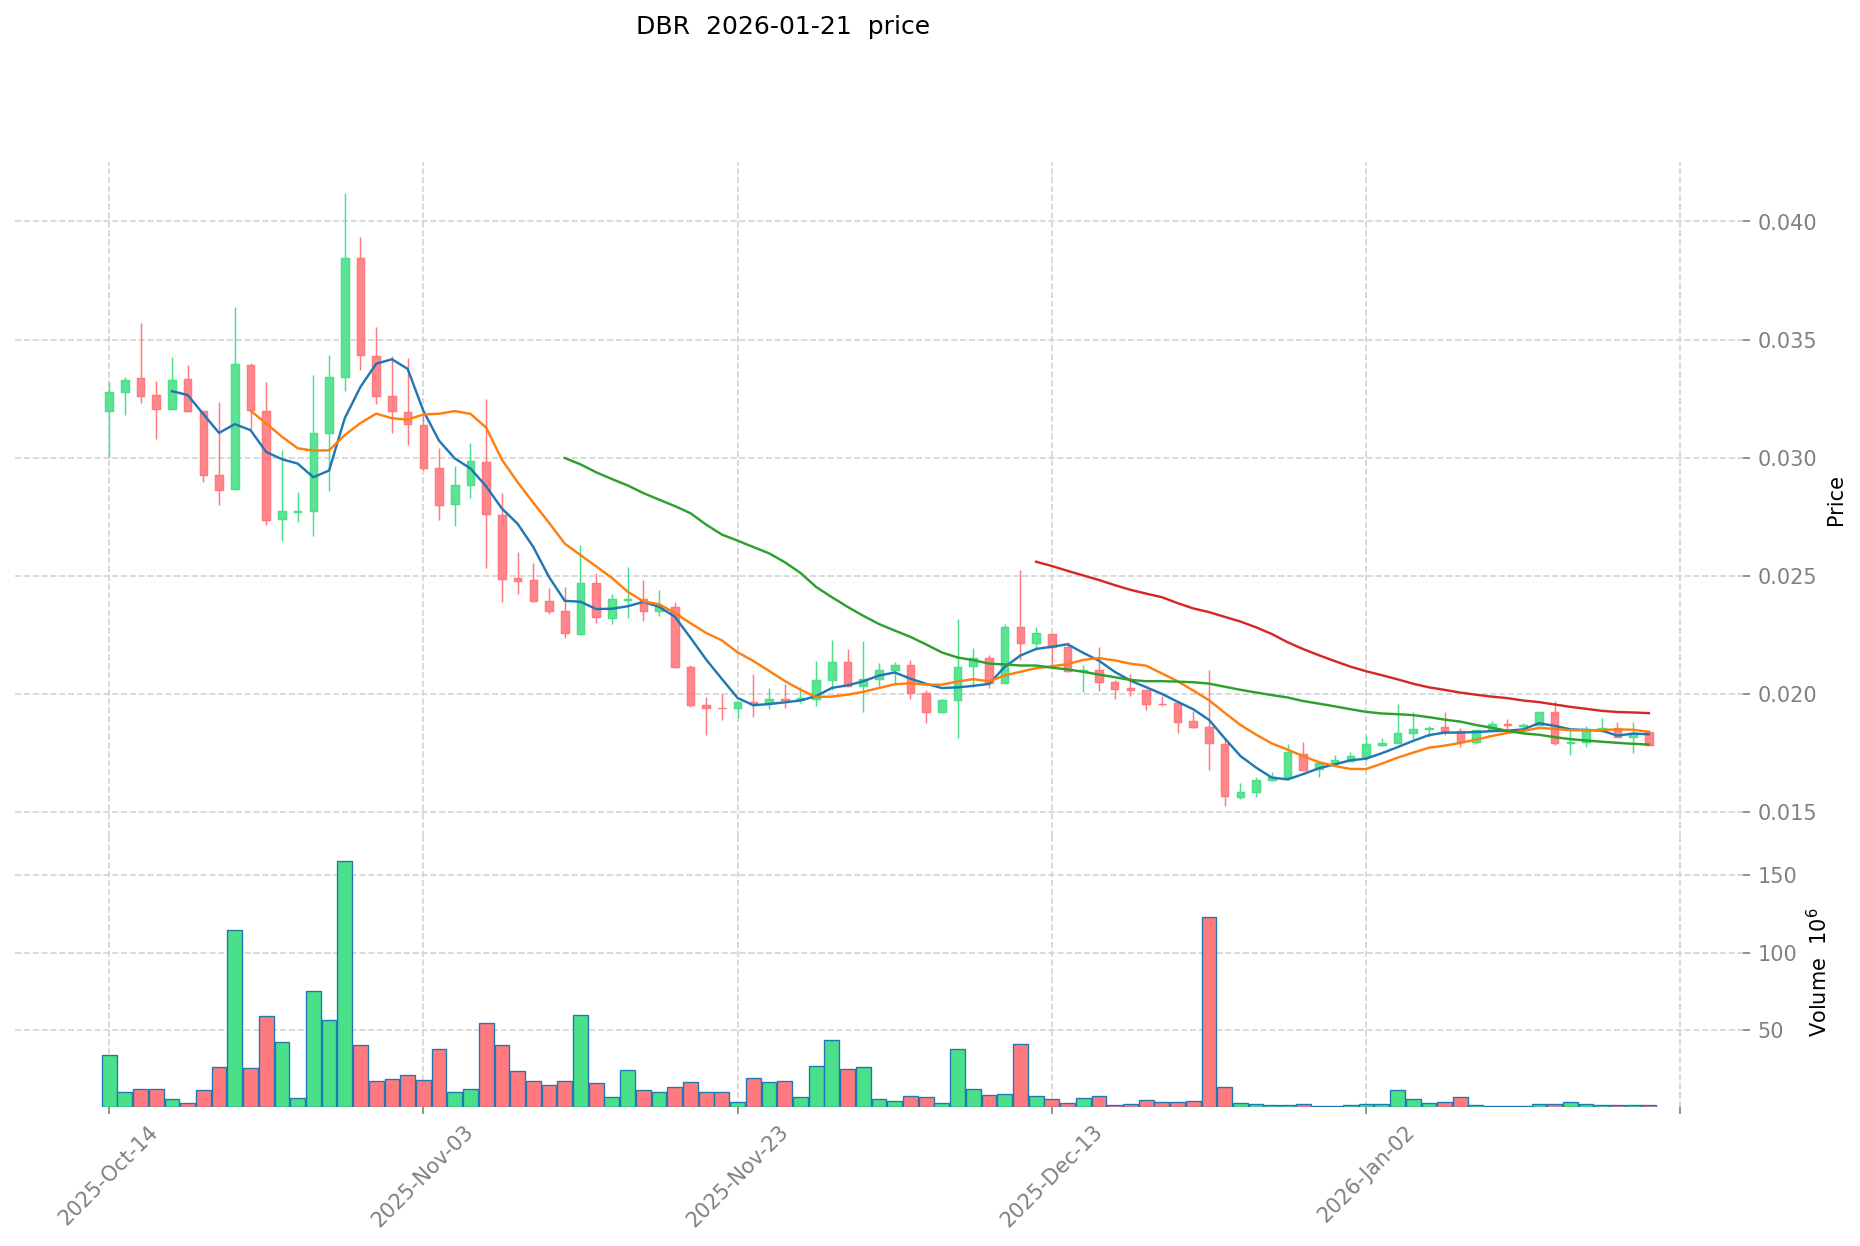
- 2024-2026: Following the December peak, DBR entered a correction phase, declining from the high of $0.05764 to its current level around $0.01801
DBR Current Market Status
As of January 21, 2026, DBR is trading at $0.01801, reflecting a decline across multiple timeframes. The token has experienced a decrease of 2.49% over the past 24 hours, with the price ranging between a 24-hour high of $0.01849 and a low of $0.01783. The short-term hourly movement shows a modest decline of 0.11%.
Looking at broader timeframes, DBR has decreased by 6.93% over the past week and 5.12% over the past month. The one-year performance indicates a more significant decline of 38.48% from its price level a year ago. The current trading price represents approximately 68.75% below the record high of $0.05764 achieved in December 2024.
The token's market capitalization stands at approximately $32.42 million, with a fully diluted market cap of $180.1 million. The circulating supply represents 18% of the maximum supply of 10 billion tokens, with 1.8 billion DBR currently in circulation. The 24-hour trading volume is recorded at $26,242.34, indicating moderate trading activity.
DBR maintains a market share of 0.0057% and is listed on 26 exchanges. The token has attracted a holder base of approximately 89,192 addresses. The current market sentiment indicator shows a Fear Index of 24, categorized as "Extreme Fear," reflecting cautious market conditions.
Click to view the current DBR market price
DBR Market Sentiment Index
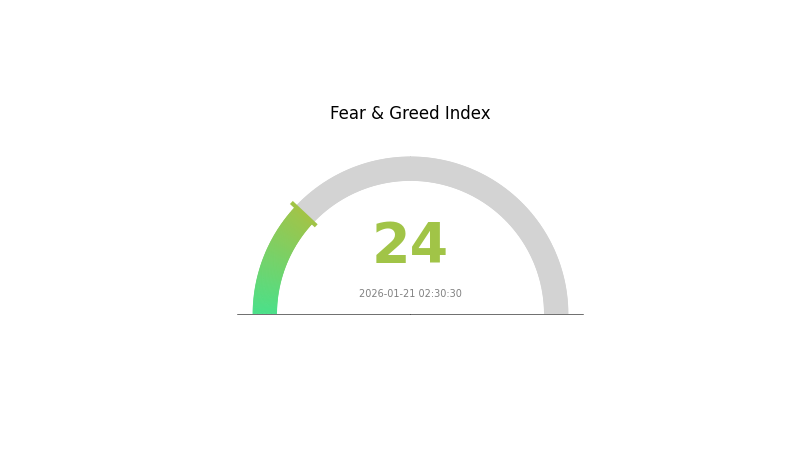
2026-01-21 Fear and Greed Index: 24 (Extreme Fear)
Click to view the current Fear & Greed Index
The crypto market is experiencing extreme fear, with the Fear and Greed Index at 24. This indicates strong bearish sentiment among investors, characterized by significant market uncertainty and risk aversion. During such periods, panic selling often dominates, creating substantial downward pressure on asset prices. However, extreme fear typically presents contrarian opportunities for long-term investors. Historically, market bottoms emerge during phases of maximum fear, potentially rewarding those with conviction and proper risk management strategies.
DBR Holding Distribution
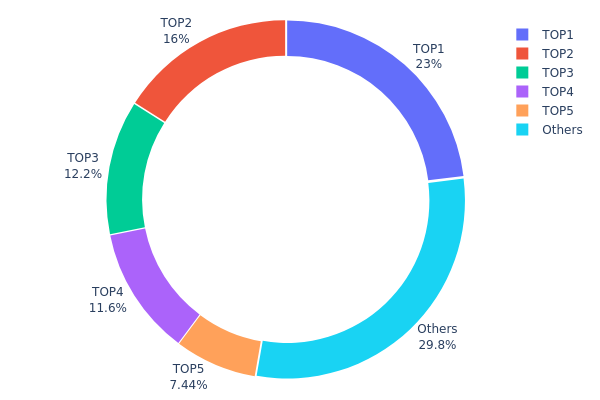
The holding distribution chart illustrates how DBR tokens are allocated across different wallet addresses on the blockchain, serving as a critical indicator of token concentration and decentralization levels. By analyzing the percentage of total supply held by top addresses, we can assess the structural health of the token's on-chain ecosystem and potential risks associated with centralization.
Based on current data, DBR exhibits a moderate to high concentration pattern. The top five addresses collectively control approximately 70.22% of the total token supply, with the largest holder alone possessing 23.00%. This concentration level suggests that a relatively small number of entities wield significant influence over the circulating supply. The top two addresses combined hold 39.00% of tokens, indicating potential vulnerability to coordinated actions by major stakeholders.
From a market structure perspective, this distribution pattern presents both opportunities and risks. The concentration of nearly 70% among top holders could lead to reduced liquidity during periods of market volatility, as large-scale movements by these addresses may trigger significant price fluctuations. However, the presence of 29.78% distributed among other addresses demonstrates some level of community participation. The gap between the fourth and fifth largest holders (11.64% versus 7.43%) suggests a tiered structure where influence diminishes progressively beyond the top addresses. This concentration level may heighten susceptibility to market manipulation, as coordinated actions by top holders could disproportionately impact price discovery mechanisms. Investors should remain vigilant regarding on-chain movements from these major addresses, as their trading activities often serve as leading indicators for broader market trends.
Click to view current DBR Holding Distribution
| Top |
Address |
Holding Qty |
Holding (%) |
| 1 |
EKFy8J...DkgBio |
2300000.00K |
23.00% |
| 2 |
ARejja...qBRBJn |
1600000.00K |
16.00% |
| 3 |
4NDX7s...49WXk7 |
1215923.27K |
12.15% |
| 4 |
4BtvjB...6BKn1R |
1164945.63K |
11.64% |
| 5 |
2V7DfG...fxJfYA |
743589.74K |
7.43% |
| - |
Others |
2975498.82K |
29.78% |
II. Core Factors Influencing DBR's Future Price
Based on the current available information, there is insufficient data to provide a comprehensive analysis of the core factors that may impact DBR's future price trajectory. The following aspects would typically be considered when evaluating cryptocurrency price dynamics:
Supply Mechanism
Detailed information regarding DBR's supply mechanism, including tokenomics, emission schedules, and historical supply patterns, is not available in the provided materials.
Institutional and Whale Activity
Data concerning institutional holdings, corporate adoption, and regulatory positions related to DBR is currently unavailable.
Macroeconomic Environment
While macroeconomic factors such as monetary policy, inflation dynamics, and geopolitical developments generally influence cryptocurrency markets, specific implications for DBR cannot be determined without additional data.
Technical Development and Ecosystem Building
Information about DBR's technical roadmap, protocol upgrades, and ecosystem applications is not present in the current materials.
For a thorough analysis of DBR's price outlook, access to project documentation, on-chain metrics, and market data would be necessary.
III. 2026-2031 DBR Price Prediction
2026 Outlook
- Conservative Forecast: $0.01511 - $0.01799
- Neutral Forecast: $0.01799
- Optimistic Forecast: $0.01961 (under favorable market conditions)
As of January 21, 2026, DBR is expected to maintain relatively stable price levels throughout the year. The token may experience moderate fluctuations within a range that reflects current market sentiment and trading activity. Price movements are likely to be influenced by broader cryptocurrency market trends and project-specific developments.
2027-2029 Mid-term Outlook
- Market Stage Expectation: Gradual growth phase with increasing volatility
- Price Range Predictions:
- 2027: $0.01072 - $0.02651
- 2028: $0.01518 - $0.03171
- 2029: $0.02120 - $0.03779
- Key Catalysts: Technology adoption rates, ecosystem expansion, and overall cryptocurrency market maturation
During this period, DBR may experience progressive price appreciation, with 2027 showing approximately 4% growth potential, followed by 25% in 2028, and 50% in 2029. These projections suggest an accelerating growth trajectory as the project gains traction and market recognition increases. Trading activity on platforms like Gate.com could contribute to improved liquidity and price discovery.
2030-2031 Long-term Outlook
- Baseline Scenario: $0.02794 - $0.03249 (assuming steady market conditions and continued project development)
- Optimistic Scenario: $0.03249 - $0.03671 (with enhanced adoption and favorable regulatory environment)
- Transformative Scenario: $0.02249 - $0.04394 (under exceptional market conditions with significant ecosystem breakthroughs)
By 2030, DBR could demonstrate an 80% growth trajectory from earlier levels, potentially reaching an average price around $0.03249. The 2031 forecast suggests continued upward momentum with approximately 92% growth potential, indicating possible maturation of the project's value proposition. However, investors should note that long-term predictions carry inherent uncertainty and depend on numerous factors including technological developments, market dynamics, and regulatory landscapes.
Price volatility may increase during this extended timeframe as the project navigates various market cycles. Traders utilizing platforms such as Gate.com should consider implementing risk management strategies and maintaining diversified portfolios when considering DBR positions.
| Year |
Predicted High Price |
Predicted Average Price |
Predicted Low Price |
Price Change |
| 2026 |
0.01961 |
0.01799 |
0.01511 |
0 |
| 2027 |
0.02651 |
0.0188 |
0.01072 |
4 |
| 2028 |
0.03171 |
0.02265 |
0.01518 |
25 |
| 2029 |
0.03779 |
0.02718 |
0.0212 |
50 |
| 2030 |
0.03671 |
0.03249 |
0.02794 |
80 |
| 2031 |
0.04394 |
0.0346 |
0.02249 |
92 |
IV. DBR Professional Investment Strategies and Risk Management
DBR Investment Methodology
(1) Long-term Holding Strategy
- Suitable for: Investors seeking exposure to cross-chain DeFi infrastructure with a medium to long-term investment horizon
- Operational recommendations:
- Consider dollar-cost averaging (DCA) to mitigate entry timing risk, given DBR's price volatility (down 38.48% year-over-year)
- Monitor deBridge protocol development and cross-chain transaction volume growth as key performance indicators
- Utilize secure storage solutions such as Gate Web3 Wallet for enhanced asset protection
(2) Active Trading Strategy
- Technical analysis tools:
- Volume analysis: Track the 24-hour trading volume of $26,242.34 to identify potential breakout or breakdown signals
- Support and resistance levels: Monitor the 24-hour range between $0.01783 (low) and $0.01849 (high) for short-term trading opportunities
- Swing trading considerations:
- DBR has shown 7-day decline of 6.93%, suggesting potential oversold conditions for contrarian traders
- Set stop-loss orders below key support levels to manage downside risk in volatile market conditions
DBR Risk Management Framework
(1) Asset Allocation Principles
- Conservative investors: 1-3% of crypto portfolio allocation
- Aggressive investors: 5-8% of crypto portfolio allocation
- Professional investors: May consider higher allocation (up to 10-15%) with appropriate hedging strategies
(2) Risk Hedging Solutions
- Portfolio diversification: Balance DBR exposure with established cryptocurrencies and stablecoins
- Position sizing: Limit single-trade exposure to 2-5% of total portfolio value to manage volatility risk
(3) Secure Storage Solutions
- Software wallet recommendation: Gate Web3 Wallet offers convenient access for active traders
- Hardware wallet solution: Consider cold storage options for long-term holdings exceeding $10,000
- Security precautions: Enable two-factor authentication, maintain backup seed phrases in secure offline locations, and never share private keys
V. DBR Potential Risks and Challenges
DBR Market Risks
- High volatility: DBR price has declined 38.48% over the past year, with a 24-hour change of -2.49%, indicating significant price instability
- Limited market capitalization: With a market cap of approximately $32.42 million and ranking #684, DBR faces liquidity constraints that may amplify price movements
- Low circulating supply ratio: Only 18% of total supply is currently circulating, creating potential dilution risk if additional tokens enter the market
DBR Regulatory Risks
- Cross-chain protocol scrutiny: Evolving regulatory frameworks may impose compliance requirements on cross-chain liquidity protocols
- Token classification uncertainty: Regulatory authorities may classify DBR differently across jurisdictions, affecting trading availability and legal status
- DeFi sector regulatory pressure: Increased regulatory attention on decentralized finance may impact deBridge protocol operations and token utility
DBR Technical Risks
- Smart contract vulnerabilities: Cross-chain protocols face complex technical challenges that may expose the system to security exploits
- Bridge security concerns: Cross-chain bridges have historically been targets for exploits, potentially affecting user confidence and token value
- Network dependency: DBR operates on the Solana blockchain (SPL20 standard), creating exposure to any technical issues or network disruptions on Solana
VI. Conclusion and Action Recommendations
DBR Investment Value Assessment
DBR presents an investment opportunity in cross-chain DeFi infrastructure, with deBridge protocol offering real-time asset and information movement across blockchain networks without traditional liquidity pool limitations. However, the token faces significant challenges, including a 38.48% year-over-year decline, relatively low market capitalization of $32.42 million, and only 18% circulating supply. The long-term value proposition depends on deBridge's ability to capture market share in the competitive cross-chain liquidity sector, while short-term risks include continued price volatility, regulatory uncertainty, and technical security concerns inherent to cross-chain protocols.
DBR Investment Recommendations
✅ Beginners: Start with small allocations (1-2% of crypto portfolio) and utilize dollar-cost averaging to manage entry risk; prioritize education on cross-chain technology before investing
✅ Experienced investors: Consider strategic positions based on technical analysis and protocol development milestones; implement stop-loss orders and diversification strategies
✅ Institutional investors: Conduct comprehensive due diligence on deBridge protocol security, competitive positioning, and regulatory compliance; consider hedging strategies and staged entry approaches
DBR Trading Participation Methods
- Spot trading: Purchase DBR directly on Gate.com and other supported exchanges (26 exchanges list DBR)
- Active trading: Utilize technical analysis tools on Gate.com platform to identify entry and exit points based on support/resistance levels
- Portfolio integration: Incorporate DBR as part of a diversified DeFi infrastructure allocation strategy, balancing exposure across multiple cross-chain protocols
Cryptocurrency investment carries extremely high risks, and this article does not constitute investment advice. Investors should make cautious decisions based on their own risk tolerance and are advised to consult professional financial advisors. Never invest more than you can afford to lose.
FAQ
What is the historical price trend of DBR?
DBR has experienced significant volatility since launch. The token peaked during bull market phases, showing strong upward momentum. Currently trading with increasing adoption, DBR demonstrates recovery potential with growing trading volume and ecosystem development driving long-term value appreciation.
What are the main factors affecting DBR price?
DBR price is primarily influenced by market demand and supply dynamics, trading volume in the market, overall crypto market sentiment, platform adoption and ecosystem development, macroeconomic conditions, and regulatory developments in the blockchain industry.
How to conduct DBR price prediction analysis?
Analyze DBR price trends by examining historical data, trading volume, market sentiment, and on-chain metrics. Monitor technical indicators like moving averages and support/resistance levels. Track adoption rates, ecosystem developments, and macroeconomic factors affecting crypto markets.
What are the advantages and disadvantages of DBR compared to other cryptocurrencies?
DBR offers efficient debt repayment mechanisms and deflationary tokenomics. Advantages include innovative burn mechanics and community governance. Disadvantages include lower liquidity compared to major coins and smaller market capitalization, affecting price stability.
What are DBR's future development prospects and price expectations?
DBR shows strong potential with increasing adoption in decentralized finance. As the protocol expands its utility and ecosystem grows, DBR is positioned for significant long-term appreciation. Market analysts project continued price growth driven by rising demand and technological improvements.
What risks should I consider when investing in DBR?
DBR investment involves market volatility, liquidity risks, and regulatory uncertainty. Price fluctuations can be significant. Conduct thorough research before investing and only allocate funds you can afford to lose.
* The information is not intended to be and does not constitute financial advice or any other recommendation of any sort offered or endorsed by Gate.