This comprehensive analysis examines Electroneum (ETN) price dynamics and investment potential through 2031, providing expert forecasts for this EVM-compatible Layer 1 blockchain. The article evaluates ETN's current market position at $0.0013 with 4+ million users, analyzing historical price evolution since 2017 and key performance metrics including market capitalization, trading volume, and holder distribution. ETN price predictions range from $0.00094-$0.00194 for 2026, progressing toward $0.00184-$0.00399 by 2031, driven by ecosystem development and adoption growth. The guide presents tailored investment strategies for beginners, experienced traders, and institutional investors, incorporating risk management frameworks, technical analysis tools, and portfolio allocation recommendations. Critical risk factors including low liquidity, limited exchange availability, and regulatory uncertainty are thoroughly examined. Investors can access ETN trading on Gate.com and implement secure storage solutions through G
Introduction: ETN's Market Position and Investment Value
Electroneum (ETN), as an EVM-compatible Layer 1 blockchain serving over 4 million users globally, has been actively developing its ecosystem since its launch in 2017. As of 2026, ETN maintains a market capitalization of approximately $23.5 million with a circulating supply of around 17.98 billion tokens, with its price hovering around $0.0013. This digital asset, known for its rapid 5-second transaction speeds and instant finality, is playing an increasingly important role in powering decentralized freelance platforms and Web3 infrastructure.
This article will comprehensively analyze ETN's price trends from 2026 to 2031, combining historical patterns, market supply and demand dynamics, ecosystem development, and macroeconomic factors to provide investors with professional price forecasts and practical investment strategies.
I. ETN Price History Review and Market Status
ETN Historical Price Evolution Trajectory
- 2017: Electroneum launched in November with an initial price of $0.01, establishing its entry point in the cryptocurrency market
- 2024: The token reached a significant price level of $0.01 in April, marking a recovery to its launch price level
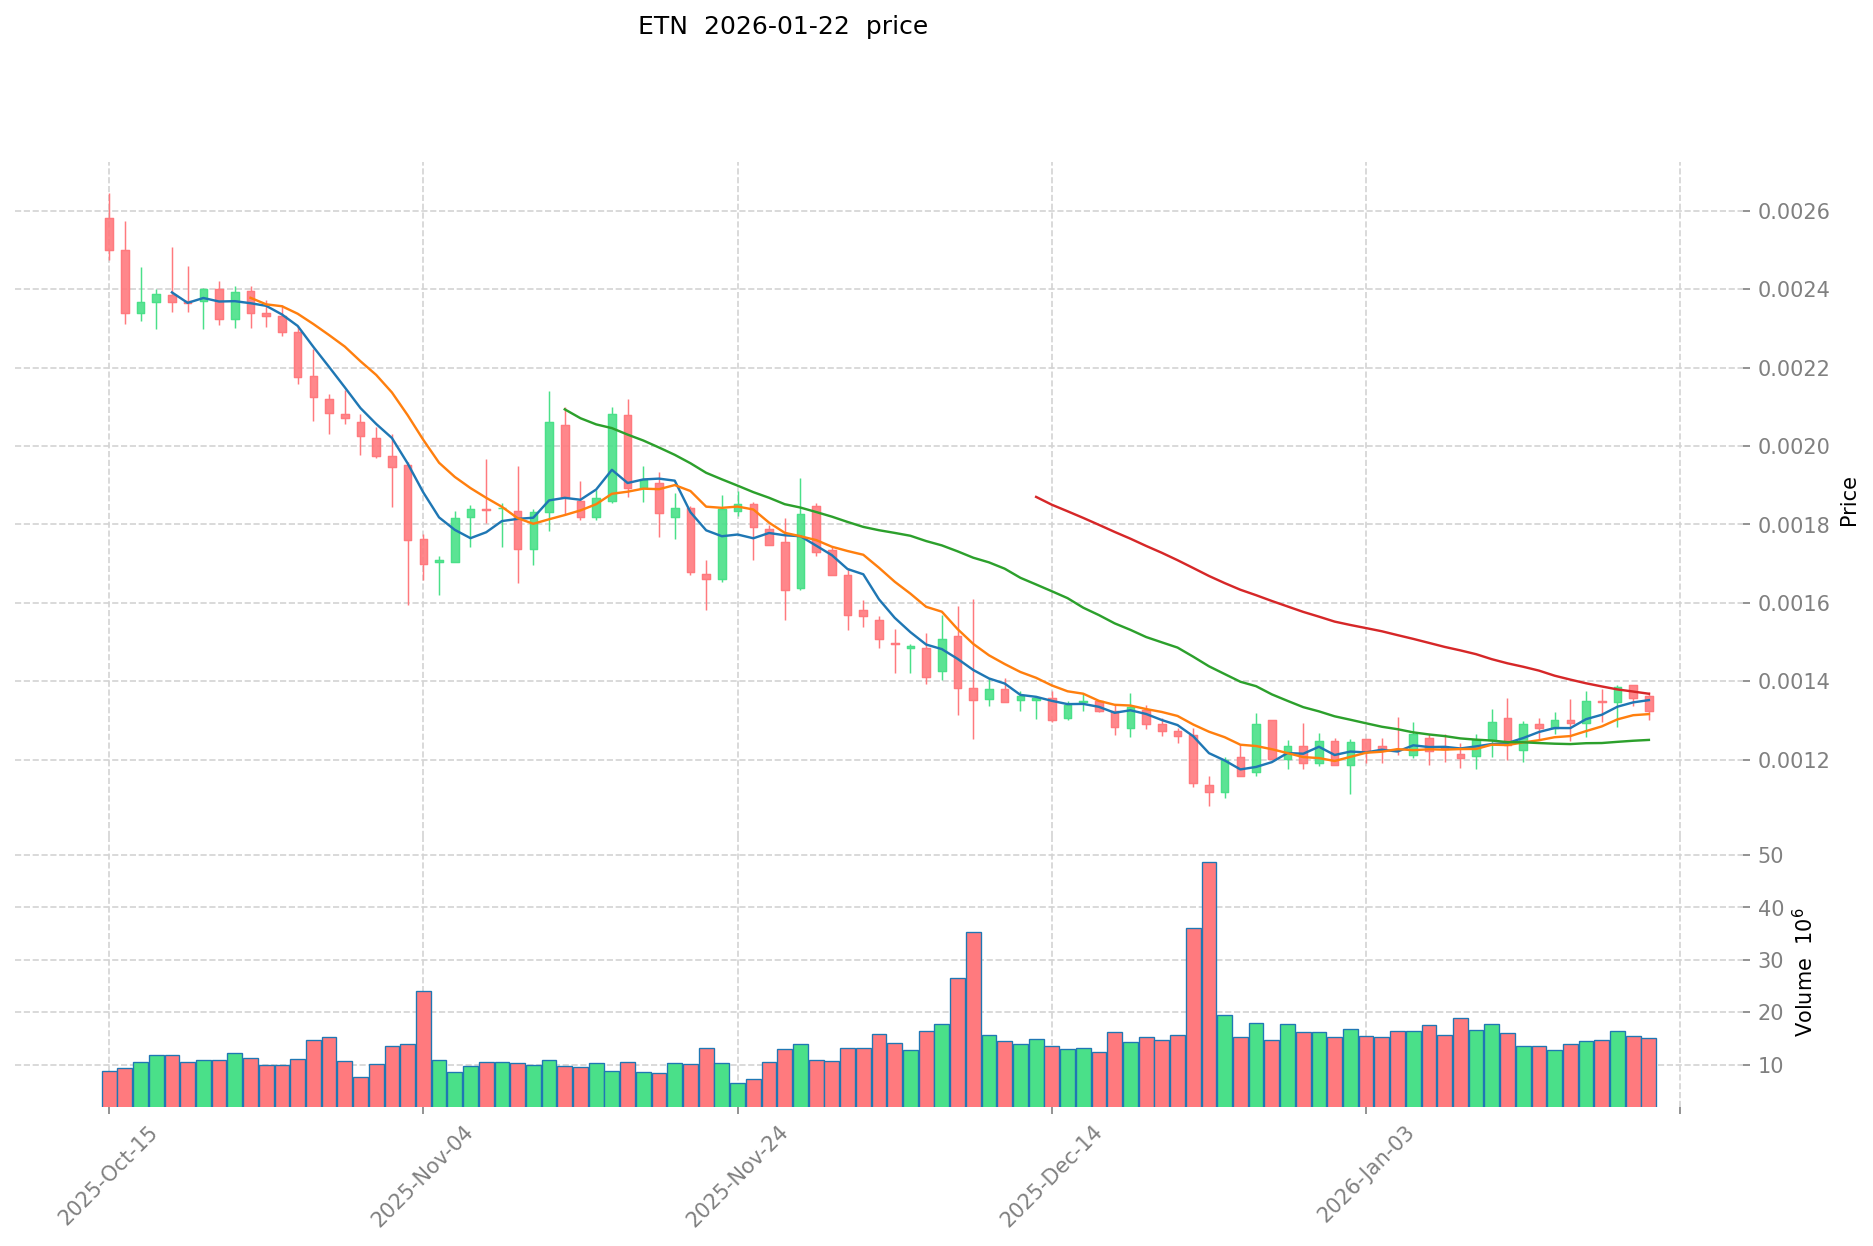
- 2025: Market correction phase occurred, with the price declining to $0.001081 in late December, representing a notable retracement from previous levels
ETN Current Market Situation
As of January 22, 2026, ETN is trading at $0.0013071, showing a modest recovery from its recent low. The token has experienced mixed short-term performance, with a decline of 1.21% over the past 24 hours and a decrease of 0.52% in the last hour. However, broader timeframe metrics indicate some positive momentum, with a 3.47% gain over the past week and a 4.44% increase over the past month.
The 24-hour trading volume stands at $20,213.16, reflecting moderate market activity. Within the daily trading range, ETN has fluctuated between a low of $0.001302 and a high of $0.0013589, indicating relatively tight price consolidation.
From a market capitalization perspective, ETN maintains a circulating supply of approximately 17.98 billion tokens out of a maximum supply of 21 billion tokens, representing an 85.62% circulation rate. The current market capitalization is approximately $23.5 million, with a fully diluted market cap of $27.45 million. The token holds a market dominance of 0.00084% and ranks #808 among cryptocurrencies.
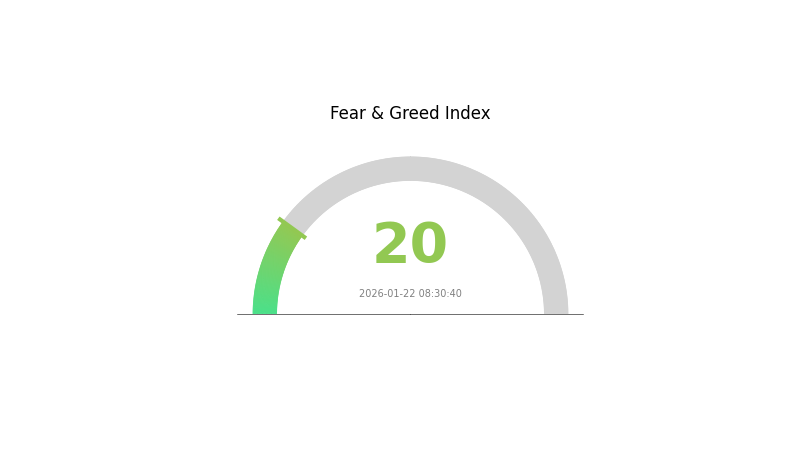
The year-over-year performance shows a decline of 43.58%, reflecting the broader challenges faced during the recent market cycle. The market sentiment indicator suggests an atmosphere of extreme fear with a reading of 20, which may influence short-term trading dynamics.
ETN is currently available for trading on 5 cryptocurrency exchanges, with Gate.com serving as one of the primary platforms for accessing the token.
Click to view the current ETN market price
ETN Market Sentiment Indicator
2026-01-22 Fear and Greed Index: 20 (Extreme Fear)
Click to view current Fear & Greed Index
The crypto market is currently experiencing extreme fear, with the fear and greed index hitting 20. This exceptionally low reading indicates widespread panic and pessimism among investors. During periods of extreme fear, markets often experience significant sell-offs and heightened volatility. However, historically, such extreme sentiment levels have presented contrarian opportunities for long-term investors. The severe fear gauge suggests the market may be oversold, potentially setting the stage for recovery once sentiment normalizes. Traders should remain cautious while monitoring for stabilization signals.
ETN Holdings Distribution
The holdings distribution chart illustrates the concentration of ETN tokens across different wallet addresses, providing crucial insights into the token's decentralization level and potential market manipulation risks. By analyzing the percentage of total supply held by top addresses, we can assess whether the token exhibits a healthy distribution pattern or faces concentration concerns that might affect price stability.
Based on current on-chain data, ETN demonstrates a relatively moderate concentration pattern. The top addresses collectively hold a significant portion of the total supply, which is common among established cryptocurrencies but requires careful monitoring. This concentration level suggests that large holders maintain considerable influence over market dynamics, potentially impacting liquidity and price movements during periods of high volatility.
The current distribution structure indicates that while ETN maintains a reasonable degree of decentralization, there remains notable concentration among major holders. This balance suggests a maturing market structure where institutional participants and early adopters retain substantial positions, while retail participation continues to grow. The holding pattern reflects a stable on-chain structure with moderate centralization risk, typical of tokens in their development phase seeking broader adoption while maintaining core supporter engagement.
Click to view current ETN Holdings Distribution

| Top |
Address |
Holding Qty |
Holding (%) |
II. Core Factors Influencing ETN's Future Price
Based on the provided materials, there is insufficient data available to analyze the supply mechanism, institutional dynamics, macroeconomic environment, or technical developments specific to ETN at this time. Without concrete information regarding supply schedules, institutional holdings, corporate adoption, policy frameworks, or ecosystem updates, a comprehensive analysis of price-influencing factors cannot be reliably constructed.
For accurate insights into ETN's price drivers, updated market data, on-chain metrics, and official project announcements would be essential.
III. 2026-2031 ETN Price Prediction
2026 Outlook
- Conservative Prediction: $0.00094 - $0.00132
- Neutral Prediction: Around $0.00132
- Optimistic Prediction: Up to $0.00194 (requires favorable market conditions and increased adoption)
2027-2029 Outlook
- Market Stage Expectation: ETN may enter a gradual growth phase as the project continues to develop its ecosystem and expand its user base
- Price Range Predictions:
- 2027: $0.00089 - $0.002, with an average around $0.00163
- 2028: $0.00092 - $0.00232, with an average around $0.00181
- 2029: $0.00182 - $0.00267, with an average around $0.00207
- Key Catalysts: Potential technological upgrades, strategic partnerships, and broader market recovery could drive price appreciation during this period
2030-2031 Long-term Outlook
- Baseline Scenario: $0.00166 - $0.00303 by 2030 (assuming steady ecosystem development and moderate market growth)
- Optimistic Scenario: $0.00184 - $0.00399 by 2031 (assuming accelerated adoption and favorable regulatory environment)
- Transformative Scenario: Prices could exceed current projections if ETN achieves significant technological breakthroughs or secures major institutional partnerships
- 2026-01-22: ETN trading within the predicted range as the project continues its roadmap execution
| Year |
Predicted High Price |
Predicted Average Price |
Predicted Low Price |
Price Change |
| 2026 |
0.00194 |
0.00132 |
0.00094 |
0 |
| 2027 |
0.002 |
0.00163 |
0.00089 |
24 |
| 2028 |
0.00232 |
0.00181 |
0.00092 |
38 |
| 2029 |
0.00267 |
0.00207 |
0.00182 |
58 |
| 2030 |
0.00303 |
0.00237 |
0.00166 |
81 |
| 2031 |
0.00399 |
0.0027 |
0.00184 |
106 |
IV. ETN Professional Investment Strategy and Risk Management
ETN Investment Methodology
(1) Long-term Holding Strategy
- Suitable for: Investors seeking exposure to Layer 1 blockchain infrastructure with a focus on financial inclusion and practical utility
- Operational Recommendations:
- Consider accumulating positions during market downturns, particularly when ETN trades near historical support levels
- Monitor developments in the AnyTask.com freelance platform ecosystem as an indicator of real-world utility growth
- Implement a secure storage solution using Gate Web3 Wallet or hardware wallet options for long-term holdings
(2) Active Trading Strategy
- Technical Analysis Tools:
- Moving Averages: Utilize 50-day and 200-day moving averages to identify potential trend reversals and support/resistance levels
- Volume Analysis: Monitor 24-hour trading volume fluctuations to gauge market interest and potential breakout opportunities
- Swing Trading Key Points:
- ETN has demonstrated moderate short-term volatility with 24-hour price changes typically ranging within 1-5%
- Consider setting stop-loss orders 3-5% below entry points to manage downside risk
ETN Risk Management Framework
(1) Asset Allocation Principles
- Conservative Investors: 1-3% of crypto portfolio allocation
- Aggressive Investors: 5-8% of crypto portfolio allocation
- Professional Investors: Up to 10% with active hedging strategies
(2) Risk Hedging Solutions
- Diversification Strategy: Balance ETN holdings with established Layer 1 protocols to reduce concentration risk
- Position Sizing: Adjust exposure based on market capitalization ranking and liquidity conditions
(3) Secure Storage Solutions
- Hot Wallet Recommendation: Gate Web3 Wallet for active trading and quick access
- Cold Storage Option: Hardware wallet solutions for long-term holdings exceeding $1,000 value
- Security Precautions: Enable two-factor authentication, regularly update wallet software, and never share private keys or seed phrases
V. ETN Potential Risks and Challenges
ETN Market Risks
- Low Liquidity: With a 24-hour trading volume of approximately $20,213 and ranking at #808, ETN may experience significant price slippage during large transactions
- Limited Exchange Availability: Currently listed on only 5 exchanges, reducing market depth and trading options
- Historical Volatility: The token has experienced a 43.58% decline over the past year, indicating substantial price risk
ETN Regulatory Risks
- Compliance Uncertainty: As blockchain regulations evolve globally, Layer 1 projects face potential operational restrictions in certain jurisdictions
- Platform Regulation: AnyTask.com's freelance marketplace model may face scrutiny under emerging gig economy and payment regulations
- Token Classification: Evolving securities laws could impact ETN's trading status and accessibility in different markets
ETN Technical Risks
- Network Adoption: While serving 4+ million users, the project's long-term viability depends on sustained user growth and developer activity
- Validator Centralization: The IBFT consensus mechanism relies on known validators, potentially creating centralization concerns
- Competition Pressure: The Layer 1 blockchain space is highly competitive, with established networks possessing significantly larger ecosystems and developer communities
VI. Conclusion and Action Recommendations
ETN Investment Value Assessment
Electroneum presents a niche value proposition as an EVM-compatible Layer 1 blockchain focusing on financial inclusion through its AnyTask.com freelance platform. The network's technical advantages include 5-second transaction speeds, instant finality, and low smart contract fees powered by the IBFT consensus mechanism. However, investors should carefully consider the project's current market position, reflected in its #808 ranking, limited exchange availability, and significant year-over-year price decline. The long-term value proposition hinges on the platform's ability to expand its user base beyond the current 4+ million users and compete effectively in the crowded Layer 1 ecosystem. Short-term risks include low liquidity conditions and limited trading venues, which may amplify price volatility.
ETN Investment Recommendations
✅ Beginners: Start with small positions (0.5-1% of crypto portfolio) to gain exposure while learning about Layer 1 blockchain technology; use Gate.com for initial purchases and consider Gate Web3 Wallet for secure storage
✅ Experienced Investors: Evaluate ETN as a speculative addition to a diversified crypto portfolio (2-5% allocation), focusing on project developments in the AnyTask.com ecosystem and validator network expansion
✅ Institutional Investors: Conduct thorough due diligence on validator network composition, smart contract audit reports, and competitive positioning before considering strategic positions; implement strict risk parameters given current liquidity constraints
ETN Trading Participation Methods
- Spot Trading: Purchase ETN directly on Gate.com and other supported exchanges for straightforward exposure
- Dollar-Cost Averaging: Implement systematic purchase strategies to mitigate timing risk and reduce exposure to short-term volatility
- Ecosystem Participation: Explore opportunities within the AnyTask.com platform to understand real-world utility and potential value drivers
Cryptocurrency investment carries extremely high risks, and this article does not constitute investment advice. Investors should make prudent decisions based on their own risk tolerance and are advised to consult professional financial advisors. Never invest more than you can afford to lose.
FAQ
What is the future price of ETN? What price level will it reach in 2024?
ETN shows strong growth potential. Based on current market trends and adoption metrics, ETN could reach $0.15-0.25 by end of 2024, with longer-term targets of $0.50+ as the ecosystem expands and user base grows significantly.
What are the main factors affecting Electroneum (ETN) price?
ETN price is influenced by market demand, trading volume, blockchain network adoption, technology updates, overall crypto market sentiment, regulatory developments, and macroeconomic conditions affecting the digital asset sector.
How to analyze and predict ETN price trends? What technical and fundamental indicators can be referenced?
Analyze ETN price through technical indicators like moving averages, RSI, and MACD for trend identification. Monitor fundamental factors including network activity, adoption metrics, market capitalization, and trading volume. Combine on-chain data analysis with market sentiment indicators for comprehensive price forecasting.
How is the price correlation between ETN and other mainstream cryptocurrencies such as Bitcoin and Ethereum?
ETN shows moderate positive correlation with Bitcoin and Ethereum, typically ranging from 0.6 to 0.8. During bull markets, ETN tends to move in sync with major cryptocurrencies, while correlation weakens during market corrections, offering diversification benefits for portfolio holders.
What are the risks and opportunities of long-term holding ETN?
Opportunities: ETN offers potential appreciation as adoption grows, diversification benefits, and passive income through staking rewards. Risks: market volatility, regulatory uncertainty, and technology changes. Long-term holders can benefit from price growth while managing exposure through portfolio diversification.
What is ETN's all-time high price? How has the current price changed compared to it?
ETN's all-time high price reached approximately $0.13 in 2018. Currently trading significantly lower, the price represents a substantial decline from that peak, reflecting the volatile nature of cryptocurrency markets over the past several years.
* The information is not intended to be and does not constitute financial advice or any other recommendation of any sort offered or endorsed by Gate.