This comprehensive analysis examines LAYER (Solayer), a Solana-based restaking platform currently trading at $0.1403, offering expert price forecasts and investment strategies for 2026-2031. The article evaluates LAYER's market position including its $29.46M market cap, 87.22% year-over-year decline from ATH, and extreme fear market sentiment. It presents three forecast scenarios: conservative ($0.09-$0.14), neutral ($0.1399), and optimistic ($0.1469) for 2026, with potential growth to $0.24866 by 2029. The analysis covers tokenomics, holder concentration risks, and ecosystem development factors. Investment strategies include dollar-cost averaging and active trading approaches suitable for different investor profiles. Risk management frameworks address market volatility, regulatory uncertainties, and technical vulnerabilities. Available on Gate for spot trading with comprehensive guidance for beginners, experienced, and institutional investors.
Introduction: LAYER's Market Position and Investment Value
Solayer (LAYER), as a restaking platform built on Solana aimed at enhancing security and yield, has been actively developing since its launch in 2025. As of January 2026, LAYER maintains a market capitalization of approximately $29.46 million with a circulating supply of around 210 million tokens, while its price hovers around $0.14. This asset, recognized as an innovative staking solution within the Solana ecosystem, is playing an increasingly important role in decentralized finance infrastructure optimization.
This article will comprehensively analyze LAYER's price trajectory from 2026 to 2031, combining historical patterns, market supply-demand dynamics, ecosystem development, and macroeconomic conditions to provide investors with professional price forecasts and practical investment strategies.
I. LAYER Price History Review and Market Status
LAYER Historical Price Evolution Trajectory
- 2025: Project launched in January with an initial price of $1, experiencing significant volatility throughout the year. The token reached its peak at $3.4159 in May before facing downward pressure.
- 2025: LAYER achieved its all-time high of $3.4159 on May 5, representing substantial growth from its launch price. However, this was followed by a correction period.
- 2025: Market experienced a challenging phase, with the price declining from the May peak of $3.4159 to an all-time low of $0.0794 recorded on October 10.
LAYER Current Market Status
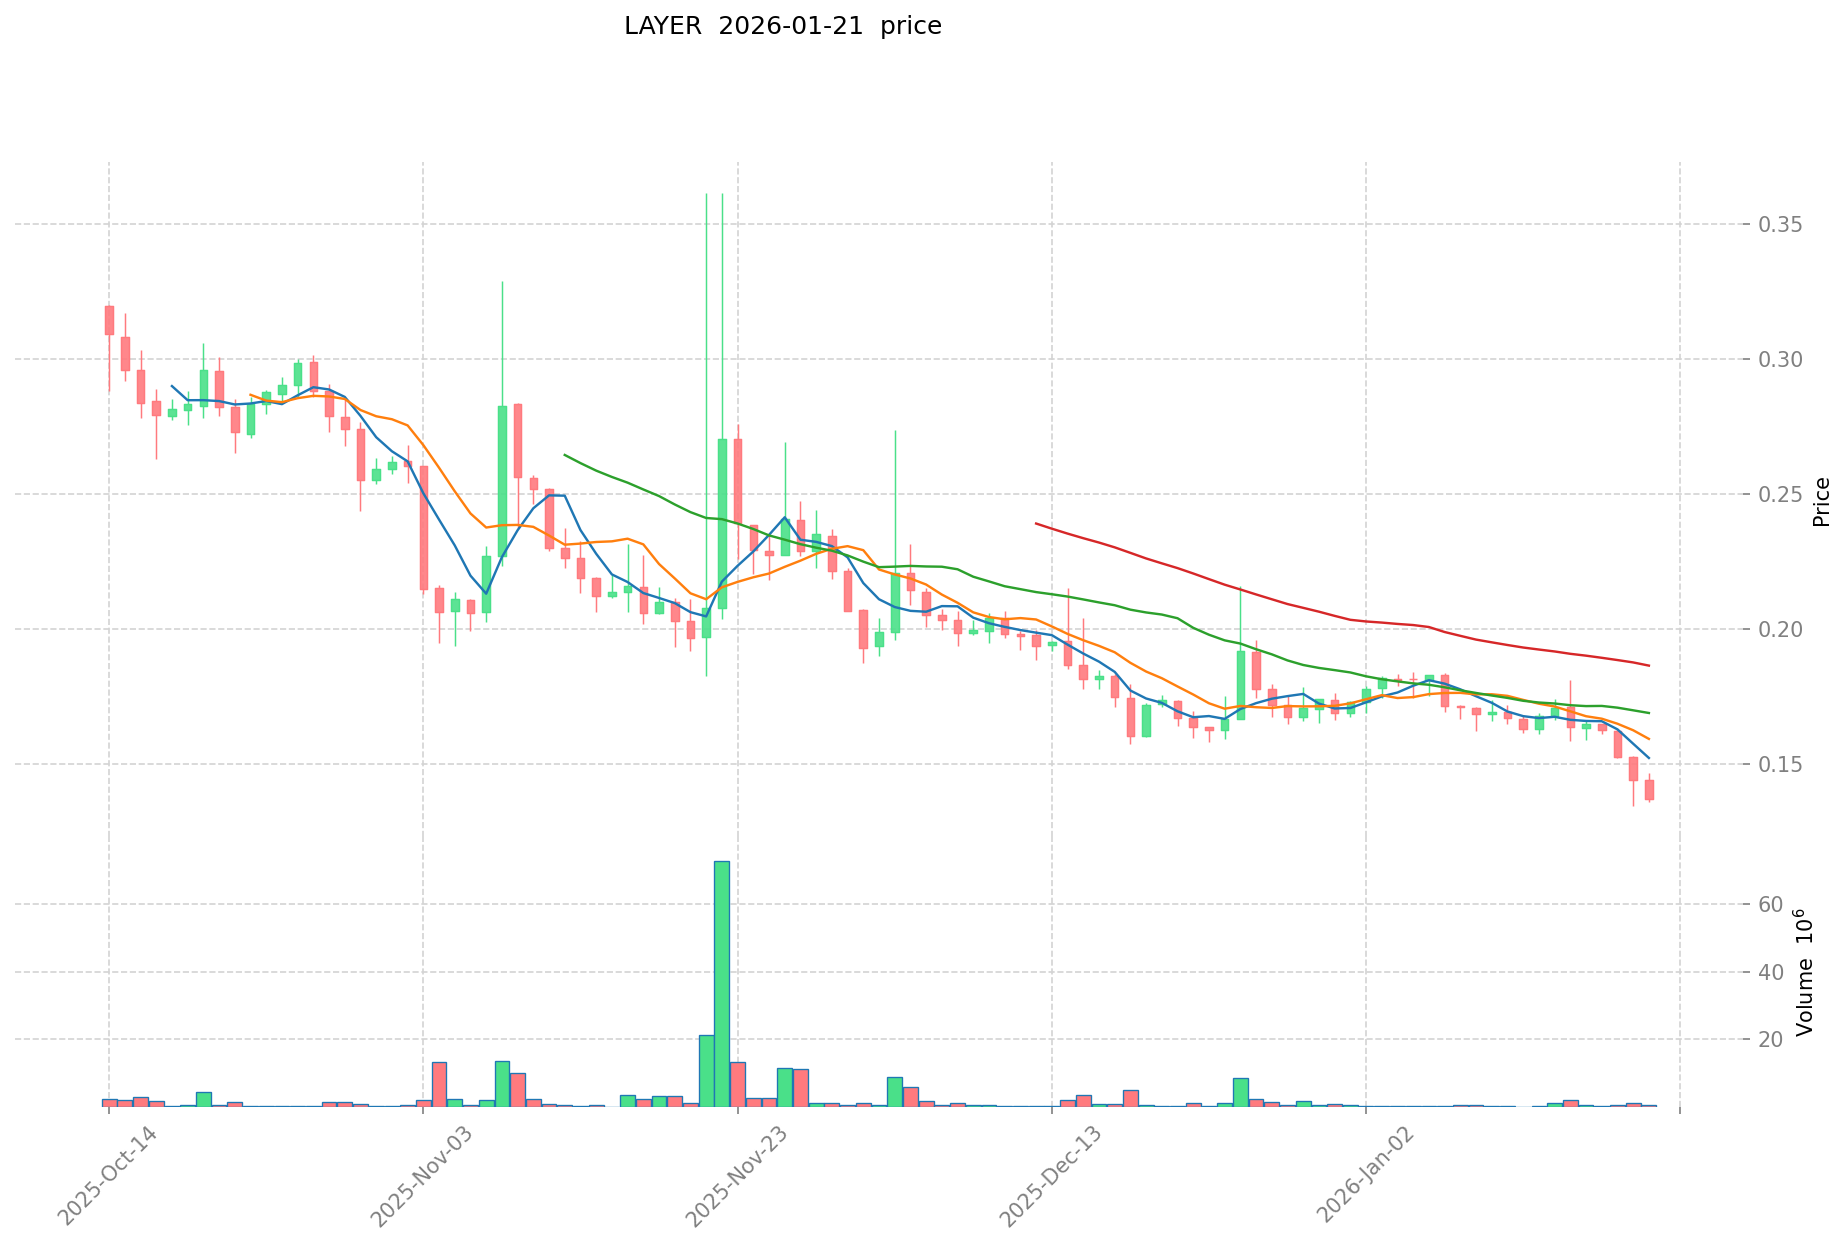
As of January 21, 2026, LAYER is trading at $0.1403, reflecting a notable decline from its historical peak. The token has experienced a decrease of 0.10% over the past hour, showing minimal short-term movement. However, broader trends indicate more substantial pressure, with a 17.080% decline over the past 7 days and a 15.37% decrease over the past 30 days. The year-over-year performance shows an 87.22% decline, indicating significant challenges in maintaining value momentum.
The 24-hour trading range demonstrates relatively narrow price action, with a high of $0.1423 and a low of $0.1358, suggesting limited volatility in the immediate term. The daily trading volume stands at $67,761.46, indicating moderate market activity.
LAYER currently holds a market capitalization of approximately $29.46 million, with a circulating supply of 210 million tokens representing 21% of the total supply of 1 billion tokens. The fully diluted market cap is calculated at $140.3 million. The token ranks 721st by market capitalization and holds a market dominance of 0.0044%. With 65,618 holders and availability on 41 exchanges, the token maintains a distributed presence across the cryptocurrency ecosystem.
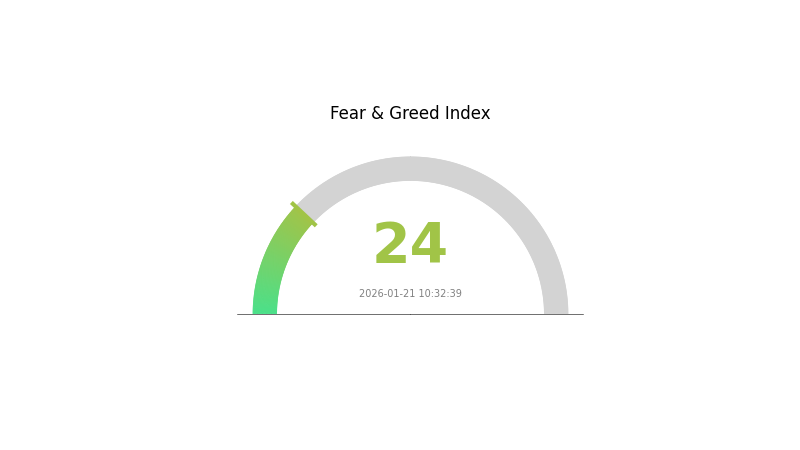
The market sentiment index currently registers at 24, reflecting an "Extreme Fear" condition in the broader market environment, which may be contributing to the recent price pressures.
Click to view the current LAYER market price
LAYER Market Sentiment Indicator
2026-01-21 Fear and Greed Index: 24 (Extreme Fear)
Click to view current Fear & Greed Index
The LAYER market is currently experiencing extreme fear, with the Fear and Greed Index registering at 24. This indicates heightened market anxiety and pessimism among investors. During periods of extreme fear, assets are often oversold, potentially creating opportunities for contrarian investors. However, extreme fear also signals elevated volatility and risk. Traders should exercise caution and conduct thorough due diligence before making investment decisions. Market sentiment can shift rapidly, so staying informed through reliable data sources like Gate.com is essential for navigating current conditions effectively.
LAYER Token Holder Distribution
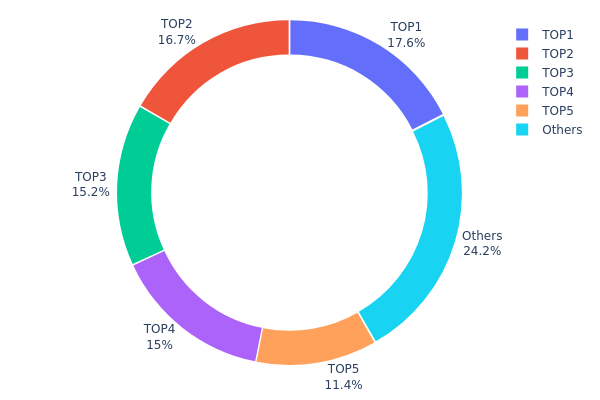
The token holder distribution chart provides critical insights into how LAYER tokens are allocated across different addresses on the blockchain. This metric serves as a key indicator of the project's decentralization level and potential market manipulation risks. By analyzing the concentration of tokens among top holders, investors can better assess the structural stability of the token economy and anticipate potential price volatility patterns.
According to the current data, LAYER exhibits a relatively high concentration pattern, with the top 5 addresses collectively holding approximately 75.79% of the total token supply. The largest holder controls 17.55% (175,551.09K tokens), while the remaining top four addresses each maintain holdings ranging from 11.37% to 16.66%. This concentration level suggests that a significant portion of the token supply is controlled by a relatively small number of entities, which could be attributed to team allocations, strategic partnerships, or early investor positions.
Such a concentrated distribution structure presents both opportunities and risks for the LAYER ecosystem. On one hand, if these large holders represent project team members or strategic partners with long-term vesting schedules, this could indicate strong commitment to the project's development. On the other hand, this concentration creates potential vulnerability to large-scale sell pressure, as coordinated or individual actions by top holders could significantly impact market liquidity and price stability. The "Others" category, comprising only 24.21% of the supply, suggests limited token circulation among retail participants, which may constrain market depth and organic trading activity in the near term.
Click to view current LAYER Token Holder Distribution
| Top |
Address |
Holding Qty |
Holding (%) |
| 1 |
Cyog5c...2VVquu |
175551.09K |
17.55% |
| 2 |
FPvyQn...Hkx5Ac |
166600.00K |
16.66% |
| 3 |
FUeWuw...C7SxHD |
152181.25K |
15.21% |
| 4 |
C8k3kp...7mNFe8 |
150000.00K |
15.00% |
| 5 |
J1FPXo...Kig9V8 |
113750.00K |
11.37% |
| - |
Others |
241916.47K |
24.21% |
II. Core Factors Influencing LAYER's Future Price
Based on the available information, there is currently insufficient data to provide a comprehensive analysis of the core factors that may influence LAYER's future price. The key areas that typically impact cryptocurrency valuations include supply mechanisms, institutional and whale dynamics, macroeconomic environment, and technological development with ecosystem building.
As more information becomes available regarding LAYER's tokenomics, adoption metrics, technical roadmap, and market dynamics, a more detailed analysis of these price-influencing factors can be conducted. Investors and observers should monitor official announcements, on-chain data, and ecosystem developments for insights into LAYER's potential price trajectory.
III. 2026-2031 LAYER Price Prediction
2026 Outlook
- Conservative Forecast: $0.09094 - $0.1399
- Neutral Forecast: approximately $0.1399
- Optimistic Forecast: up to $0.1469 (dependent on favorable market conditions and ecosystem development)
2027-2029 Mid-term Outlook
- Market Stage Expectation: gradual growth phase with potential market consolidation and ecosystem expansion
- Price Range Forecast:
- 2027: $0.08317 - $0.16347
- 2028: $0.08286 - $0.18719
- 2029: $0.08686 - $0.24866
- Key Catalysts: technological advancement, increased adoption rates, and broader cryptocurrency market trends
2030-2031 Long-term Outlook
- Baseline Scenario: $0.16759 - $0.23672 (assuming steady ecosystem growth and market stability)
- Optimistic Scenario: $0.20949 - $0.23203 (with enhanced network utility and increased institutional interest)
- Transformational Scenario: potential to reach $0.24866 (under exceptionally favorable market conditions with significant technological breakthroughs and mass adoption)
- 2026-01-21: LAYER shows a projected average price of $0.1399 (establishing initial valuation baseline)
| Year |
Predicted High Price |
Predicted Average Price |
Predicted Low Price |
Price Change |
| 2026 |
0.1469 |
0.1399 |
0.09094 |
0 |
| 2027 |
0.16347 |
0.1434 |
0.08317 |
2 |
| 2028 |
0.18719 |
0.15344 |
0.08286 |
9 |
| 2029 |
0.24866 |
0.17031 |
0.08686 |
21 |
| 2030 |
0.23672 |
0.20949 |
0.16759 |
49 |
| 2031 |
0.23203 |
0.2231 |
0.15394 |
59 |
IV. LAYER Professional Investment Strategies and Risk Management
LAYER Investment Methodology
(1) Long-term Holding Strategy
- Suitable for: Investors seeking exposure to Solana ecosystem infrastructure and restaking yield opportunities
- Operational recommendations:
- Consider dollar-cost averaging (DCA) to mitigate entry price volatility, particularly given LAYER's 87.22% decline over the past year
- Monitor Solayer platform development milestones and Total Value Locked (TVL) growth as indicators of fundamental strength
- Utilize Gate Web3 Wallet for secure long-term storage with self-custody control
(2) Active Trading Strategy
- Technical analysis tools:
- Moving averages: Observe 50-day and 200-day moving averages to identify potential trend reversals; current price shows short-term weakness with -17.08% over 7 days
- Volume analysis: Monitor 24-hour trading volume ($67,761) relative to market cap ($29.46M) to assess liquidity and trading interest
- Swing trading considerations:
- Establish clear stop-loss levels given high volatility (24-hour range: $0.1358-$0.1423)
- Track Solana network activity and broader restaking sector trends for correlation insights
LAYER Risk Management Framework
(1) Asset Allocation Principles
- Conservative investors: 1-3% of crypto portfolio allocation
- Aggressive investors: 5-10% of crypto portfolio allocation
- Professional investors: Up to 15% with active hedging strategies
(2) Risk Hedging Solutions
- Portfolio diversification: Combine LAYER with established assets like BTC or ETH to reduce concentration risk
- Position sizing: Limit individual position size based on personal risk tolerance and LAYER's current volatility profile
(3) Secure Storage Solutions
- Hot wallet recommendation: Gate Web3 Wallet for convenient trading access and platform integration
- Cold storage approach: Hardware wallet solutions for long-term holdings exceeding immediate trading needs
- Security precautions: Enable two-factor authentication, verify contract addresses (LAYER4xPpTCb3QL8S9u41EAhAX7mhBn8Q6xMTwY2Yzc on Solana), and never share private keys
V. LAYER Potential Risks and Challenges
LAYER Market Risks
- Price volatility: LAYER has experienced significant price decline from ATH of $3.4159 (May 2025) to current $0.1403, reflecting sector-wide restaking narrative weakness
- Liquidity concerns: With 21% circulating supply (210M/1B tokens), potential future unlocks may create selling pressure
- Correlation risk: As a Solana-based project, LAYER performance may closely track SOL ecosystem sentiment and network activity
LAYER Regulatory Risks
- Staking classification uncertainty: Evolving regulatory frameworks may impact restaking protocols' operational models
- Securities law considerations: Token distribution mechanisms and yield generation features may face regulatory scrutiny in certain jurisdictions
- Compliance requirements: Changes in crypto asset reporting or taxation rules could affect investor participation
LAYER Technical Risks
- Smart contract vulnerabilities: Restaking protocols involve complex contract interactions that may contain undiscovered security flaws
- Network dependency: Platform security and performance rely entirely on Solana blockchain stability and uptime
- Competition intensity: Multiple restaking solutions exist within Solana ecosystem, creating differentiation and adoption challenges
VI. Conclusion and Action Recommendations
LAYER Investment Value Assessment
LAYER represents exposure to Solana's restaking infrastructure, a growing sector within DeFi. The project's value proposition centers on enhancing network security while generating yield for participants. However, the token's 87.22% decline from ATH and low circulating ratio (21%) present significant near-term risks. Long-term value depends on Solayer platform adoption, TVL growth, and broader acceptance of restaking mechanisms within the Solana ecosystem.
LAYER Investment Recommendations
✅ Beginners: Consider waiting for clearer trend establishment and improved market conditions; if participating, limit allocation to <2% of crypto portfolio and use DCA approach
✅ Experienced investors: May explore strategic positions during consolidation phases with strict risk management; monitor platform metrics and Solana ecosystem developments
✅ Institutional investors: Conduct thorough due diligence on Solayer protocol mechanics, team credentials, and competitive positioning before material allocation
LAYER Trading Participation Methods
- Spot trading: Available on Gate.com with 41 total exchange listings providing reasonable liquidity
- Staking participation: Engage directly with Solayer platform (app.solayer.org) for restaking yield opportunities
- Portfolio rebalancing: Periodically adjust LAYER exposure based on risk appetite and sector performance relative to broader crypto markets
Cryptocurrency investment carries extremely high risk, and this article does not constitute investment advice. Investors should make cautious decisions based on their own risk tolerance and are advised to consult professional financial advisors. Never invest more than you can afford to lose.
FAQ
What is the historical price trend of LAYER tokens?
LAYER has demonstrated strong growth momentum since launch, experiencing multiple rally phases driven by ecosystem expansion and increasing adoption. The token has shown resilience through market cycles, with key support levels established during corrections. Price discovery continues as the network develops, attracting sustained institutional and retail interest in the project's long-term fundamentals.
What are the main factors affecting LAYER price?
LAYER price is primarily influenced by market demand and trading volume, network adoption and utility growth, macroeconomic conditions, overall crypto market sentiment, technological developments and upgrades, and competitive positioning within the layer solution ecosystem.
What is the future price prediction for LAYER by professional analysts?
Professional analysts project LAYER could experience significant growth driven by increasing Layer 2 adoption and network expansion. Long-term forecasts suggest potential upside as the ecosystem matures, though price movements depend on market conditions and technological developments.
LAYER demonstrates strong competitive positioning with superior transaction efficiency and lower fees. Its innovative architecture outperforms comparable Layer 2 solutions in scalability metrics and ecosystem growth, positioning it as a leading choice for DeFi applications.
What price could LAYER reach in 2024-2025?
Based on market momentum and development progress, LAYER could potentially reach $0.50-$1.50 during 2024-2025, depending on ecosystem adoption and broader market conditions.
How to evaluate LAYER token's technical fundamentals and application prospects?
LAYER demonstrates solid technical architecture with strong layer-2 scaling solutions. Its ecosystem expansion and developer adoption show promising growth potential. The token's utility in governance and transaction fees positions it well for long-term value appreciation in the Web3 infrastructure sector.
* The information is not intended to be and does not constitute financial advice or any other recommendation of any sort offered or endorsed by Gate.