This comprehensive article provides expert analysis of METIS token, a leading Layer 2 scaling solution featuring dual-chain architecture with Andromeda and Hyperion networks. As of January 2026, METIS trades at $5.06 with a $36.93M market cap, having declined 86.22% over the past year. The article delivers detailed price forecasts spanning 2026-2031, projecting conservative ($2.74-$5.07) to optimistic ($9.43-$11.40) scenarios based on ecosystem development and macroeconomic factors. Key sections cover historical price evolution, current market sentiment analysis, holding distribution patterns revealing 64.96% concentration in a single address, and three investment strategies: long-term holding with dollar-cost averaging, active trading with technical indicators, and risk management frameworks. Professional investment recommendations cater to beginners, experienced, and institutional investors, while addressing critical risks including market volatility, regulatory uncertainty, and technical vulnerabilities in
Introduction: METIS Market Position and Investment Value
Metis Token (METIS), as a pioneering force in the Layer 2 scaling solution ecosystem, has been evolving since its launch in 2021 and has established itself as a key infrastructure provider for decentralized applications. As of January 2026, METIS maintains a market capitalization of approximately $36.93 million, with a circulating supply of around 7.30 million tokens, and the price hovering near $5.06. This asset, recognized as a "multi-network ecosystem powered by revolutionary MetisSDK," is playing an increasingly vital role in DeFi, gaming, DEPIN, and AI sectors through its innovative dual-chain architecture comprising Andromeda and Hyperion networks.
This article will comprehensively analyze METIS price trends from 2026 to 2031, combining historical patterns, market supply-demand dynamics, ecosystem development, and macroeconomic factors to provide investors with professional price forecasts and practical investment strategies.
I. METIS Price History Review and Market Status
METIS Historical Price Evolution Trajectory
- 2021: Token launched on May 12, with initial price movements establishing a baseline around $3.45
- 2022: Project reached a significant milestone on January 17, with price advancing to elevated levels during the broader crypto market expansion
- 2023-2024: Market cycle transition phase, with price adjustments reflecting ecosystem development and market conditions
- 2025: Throughout the year, price experienced contraction, declining from previous levels as part of the broader market correction
METIS Current Market Situation
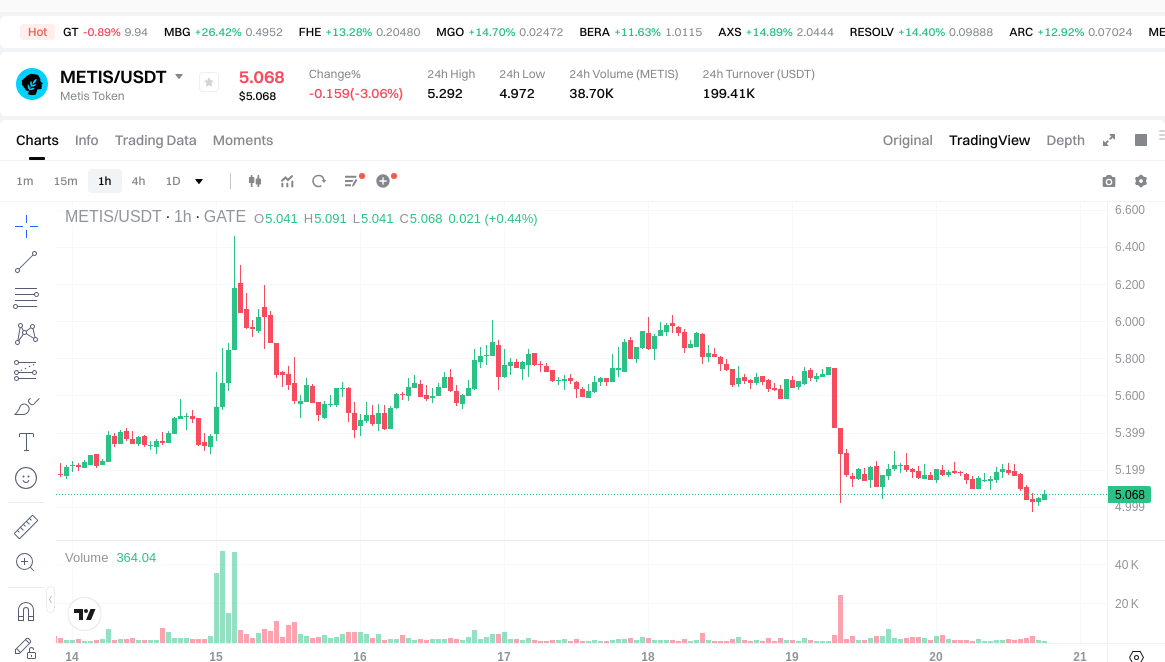
As of January 20, 2026, METIS is trading at $5.06, representing a decline of 2.55% over the past 24 hours. The token has experienced modest volatility, with the 24-hour trading range spanning from $4.972 to $5.292.
The current market capitalization stands at approximately $36.93 million, with a fully diluted valuation of $50.6 million. The circulating supply comprises 7,299,234 tokens, accounting for 72.99% of the maximum supply of 10 million tokens. Trading volume over the past 24 hours reached $200,590, indicating moderate market activity.
Short-term price movements show a 0.74% increase over the past hour, while the 7-day trend reflects a 1.9% decrease. The 30-day performance indicates a 7.77% decline, and the one-year trend shows an 86.22% contraction from previous levels.
The token maintains a market dominance of 0.0015% within the broader cryptocurrency ecosystem. METIS is currently available for trading on 31 exchanges, with a holder base of 24,224 addresses. Market sentiment analysis indicates a fear index reading of 32.
Metis operates as a multi-network ecosystem powered by MetisSDK, featuring a dual-network architecture. The Andromeda network serves general-purpose decentralized applications, while the Hyperion network provides high-performance, AI-optimized execution capabilities. Both chains facilitate interoperability, enabling developers to deploy scalable applications across sectors including DeFi, gaming, DEPIN, and AI.
Click to view current METIS market price
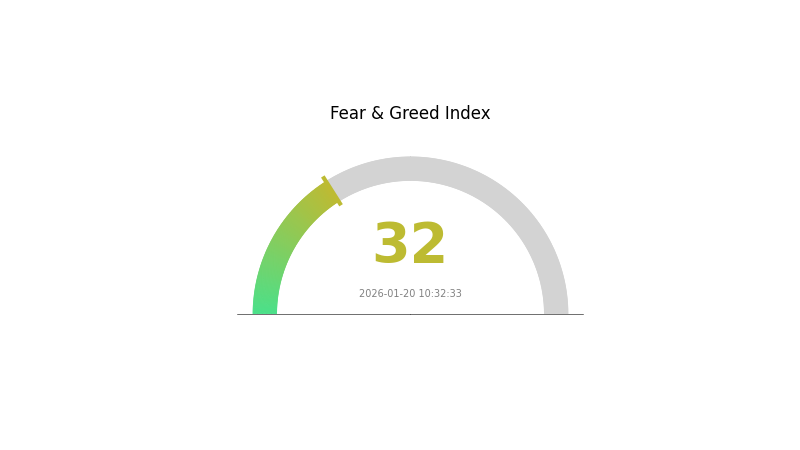
METIS Market Sentiment Indicator
2026-01-20 Fear and Greed Index: 32 (Fear)
Click to view current Fear & Greed Index
The METIS market is currently experiencing a fear sentiment with an index reading of 32. This indicates heightened risk aversion among investors, suggesting cautious market conditions. During periods of fear, market participants typically adopt defensive strategies and reduce risk exposure. For traders, this environment may present opportunities to accumulate assets at lower valuations, though vigilance remains essential. Monitoring market developments and maintaining proper risk management is crucial during such sentiment phases. Consider diversifying your portfolio and conducting thorough research before making investment decisions on Gate.com.
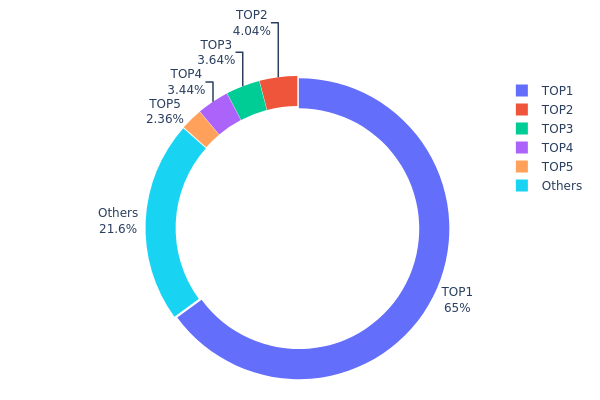
METIS Holding Distribution
The holding distribution chart reflects the percentage of total circulating supply held by different wallet addresses, serving as a key indicator of token concentration and decentralization level. By analyzing the distribution pattern across major holders, we can assess potential market manipulation risks, liquidity conditions, and the overall health of the token's on-chain structure.
Current data reveals a highly concentrated holding pattern for METIS. The top address controls 6,496.81K tokens, representing 64.96% of the total supply—an extraordinarily high concentration level. The second through fifth largest addresses hold 4.03%, 3.63%, 3.43%, and 2.35% respectively, with all other addresses collectively accounting for only 21.6%. This distribution structure indicates significant centralization, with nearly two-thirds of the circulating supply concentrated in a single address.
Such extreme concentration presents multiple implications for market dynamics. First, the dominant position of the top holder creates substantial systemic risk, as large-scale selling could trigger severe price volatility and liquidity crises. Second, this distribution pattern suggests limited token circulation in the open market, potentially resulting in reduced trading depth and increased susceptibility to price manipulation. From a decentralization perspective, this holding structure deviates significantly from the ideal distribution model, reflecting a relatively immature on-chain ecosystem that may require enhanced attention to governance transparency and the risk management strategies of major holders.
Click to view current METIS Holding Distribution
| Top |
Address |
Holding Qty |
Holding (%) |
| 1 |
0x3980...e9c04b |
6496.81K |
64.96% |
| 2 |
0x0fe3...af5b48 |
403.70K |
4.03% |
| 3 |
0x3365...051fc1 |
363.98K |
3.63% |
| 4 |
0xac3e...135d61 |
343.90K |
3.43% |
| 5 |
0x13bf...ac5b0e |
235.77K |
2.35% |
| - |
Others |
2155.84K |
21.6% |
II. Core Factors Influencing METIS Future Price
Based on the available materials, there is insufficient data to provide a comprehensive analysis of the core factors affecting METIS price movements. The provided resources do not contain specific information regarding supply mechanisms, institutional holdings, macroeconomic correlations, or technical developments for this asset.
For accurate price analysis and forecasting, investors should conduct independent research through official project channels and verified data sources, while carefully evaluating market risks before making investment decisions.
III. 2026-2031 METIS Price Prediction
2026 Outlook
- Conservative Prediction: $2.74 - $5.07
- Neutral Prediction: $5.07
- Optimistic Prediction: $6.23 (requires favorable market conditions and sustained ecosystem growth)
2027-2029 Outlook
- Market Stage Expectation: The period is anticipated to witness gradual appreciation as the Layer 2 scaling solutions sector matures, with potential increased adoption of Metis' decentralized sequencer technology driving fundamental value.
- Price Range Predictions:
- 2027: $3.45 - $5.82
- 2028: $3.50 - $8.03
- 2029: $3.58 - $9.91
- Key Catalysts: Technical innovations in decentralized infrastructure, broader institutional recognition of Layer 2 solutions, and expanding DeFi ecosystem integrations could serve as primary price drivers during this phase.
2030-2031 Long-term Outlook
- Baseline Scenario: $4.37 - $8.40 (assuming steady ecosystem development and maintained competitive positioning)
- Optimistic Scenario: $8.40 - $11.25 (contingent upon substantial network effect expansion and increased protocol revenue)
- Transformative Scenario: $9.43 - $11.40 (requires breakthrough adoption milestones and favorable macroeconomic conditions for digital assets)
- 2026-01-20: METIS exhibits a projected annual price change range establishing foundational valuation metrics for subsequent years
| Year |
Predicted High Price |
Predicted Average Price |
Predicted Low Price |
Price Change |
| 2026 |
6.23364 |
5.068 |
2.73672 |
0 |
| 2027 |
5.82034 |
5.65082 |
3.447 |
11 |
| 2028 |
8.02982 |
5.73558 |
3.49871 |
13 |
| 2029 |
9.91109 |
6.8827 |
3.579 |
36 |
| 2030 |
11.25184 |
8.39689 |
4.36638 |
65 |
| 2031 |
11.39626 |
9.82436 |
9.43139 |
94 |
IV. METIS Professional Investment Strategy and Risk Management
METIS Investment Methodology
(1) Long-term Holding Strategy
- Target investors: Investors who believe in the long-term potential of Layer 2 scaling solutions and multi-network ecosystems, with a holding period of 1-3 years or longer
- Operational recommendations:
- Consider accumulating positions during market corrections, particularly when METIS trades below its historical average price levels
- Monitor key ecosystem developments including Andromeda and Hyperion network upgrades, new dApp deployments, and partnerships
- Implement a dollar-cost averaging approach to mitigate short-term volatility, given the token's 86.22% decline over the past year
- Storage solution: Use Gate Web3 Wallet for secure self-custody, supporting ETH network where METIS token is deployed
(2) Active Trading Strategy
- Technical analysis tools:
- Moving Averages: Monitor 50-day and 200-day moving averages to identify trend reversals; current price volatility (24h range: $4.972-$5.292) suggests active trading opportunities
- RSI (Relative Strength Index): Use to identify overbought/oversold conditions, particularly useful given recent -7.77% monthly performance
- Volume Analysis: Track 24-hour trading volume ($200,590.61) against historical averages to confirm price movements
- Swing trading key points:
- Establish clear entry and exit points based on support ($4.97) and resistance ($5.29) levels identified in recent 24-hour trading
- Set stop-loss orders at 5-8% below entry price to limit downside risk
- Consider taking partial profits during short-term rallies, given the token's current bearish momentum across multiple timeframes
METIS Risk Management Framework
(1) Asset Allocation Principles
- Conservative investors: 1-3% of crypto portfolio allocation, focusing on established Layer 2 solutions with proven track records
- Aggressive investors: 5-10% allocation, suitable for those seeking exposure to emerging multi-network ecosystems and AI-optimized infrastructure
- Professional investors: Up to 15% allocation with active hedging strategies, appropriate for those with deep understanding of Layer 2 technology and market dynamics
(2) Risk Hedging Solutions
- Portfolio diversification: Allocate across multiple Layer 2 projects and blockchain infrastructure tokens to reduce concentration risk
- Position sizing: Limit single trade exposure to 2-5% of total portfolio value, accounting for METIS's relatively low market cap ($36.93M) and high volatility
- Periodic rebalancing: Adjust positions quarterly based on market conditions and project development milestones
(3) Secure Storage Solutions
- Hot wallet recommendation: Gate Web3 Wallet for active traders requiring frequent access and trading flexibility on ETH network
- Cold storage solution: Hardware wallet storage for long-term holdings exceeding $10,000 in value
- Security considerations:
- Never share private keys or seed phrases with anyone
- Enable two-factor authentication on all exchange and wallet accounts
- Verify contract address (0x9e32b13ce7f2e80a01932b42553652e053d6ed8e) before any transactions
- Be cautious of phishing attempts targeting METIS holders across social media platforms
V. METIS Potential Risks and Challenges
METIS Market Risks
- Price volatility: METIS has experienced an 86.22% decline over the past year, reflecting significant market volatility and downward pressure that may continue in the near term
- Liquidity concerns: With a 24-hour trading volume of approximately $200,591 and market cap of $36.93M, METIS has relatively limited liquidity compared to larger Layer 2 projects, potentially leading to slippage during large trades
- Market sentiment: Current negative momentum across 24H (-2.55%), 7D (-1.9%), and 30D (-7.77%) timeframes indicates bearish market sentiment that could persist
- Competitive pressure: Intense competition from established Layer 2 solutions may impact METIS's market share and valuation
METIS Regulatory Risks
- Securities classification uncertainty: Evolving regulatory frameworks regarding Layer 2 tokens and their classification may impact METIS trading and usage
- Cross-border compliance: Multi-network ecosystem operations may face varying regulatory requirements across different jurisdictions
- DeFi regulations: Increasing regulatory scrutiny of decentralized finance applications built on METIS infrastructure could affect ecosystem growth
METIS Technical Risks
- Network security: As a dual-chain architecture, any vulnerabilities in Andromeda or Hyperion networks could compromise user funds and ecosystem integrity
- Smart contract risks: Potential bugs or exploits in deployed dApps and the MetisSDK could negatively impact token value and user confidence
- Scalability challenges: While positioned as a high-performance solution, network congestion or technical limitations could hinder adoption
- Interoperability complexity: Seamless operation between Andromeda and Hyperion chains depends on sophisticated infrastructure that may encounter technical difficulties
- Dependency on Ethereum: As an Ethereum Layer 2 solution, METIS's performance and security are partially dependent on Ethereum mainnet stability
VI. Conclusion and Action Recommendations
METIS Investment Value Assessment
METIS presents a compelling long-term value proposition as a multi-network ecosystem leveraging dual-chain architecture for diverse Web3 applications spanning DeFi, gaming, DEPIN, and AI sectors. The project's innovative MetisSDK and interoperable Andromeda-Hyperion network design position it uniquely in the competitive Layer 2 landscape. However, short-term risks are considerable, evidenced by the 86.22% annual decline and persistent negative momentum across all timeframes. The relatively low market cap ($36.93M) and limited circulating supply (72.99% of max supply) suggest both growth potential and volatility risk. With 24,224 holders and listing on 31 exchanges, METIS demonstrates reasonable adoption but faces significant challenges in a crowded market. The gap between current price ($5.06) and all-time high ($323.54) indicates substantial distance from peak valuations, requiring careful risk assessment.
METIS Investment Recommendations
✅ Beginners: Start with small position sizes (0.5-1% of portfolio) to gain exposure while learning about Layer 2 technology; use Gate Web3 Wallet for secure storage; avoid leveraged trading given high volatility; focus on understanding the Andromeda and Hyperion network fundamentals before increasing allocation
✅ Experienced investors: Consider 3-7% portfolio allocation with dollar-cost averaging during market dips; implement technical analysis using support/resistance levels; monitor ecosystem developments and dApp deployment metrics; utilize stop-loss orders and periodic profit-taking strategies; evaluate METIS against competing Layer 2 solutions for comparative positioning
✅ Institutional investors: Conduct thorough due diligence on MetisSDK adoption rates and network activity metrics; consider strategic allocation of 5-10% within Layer 2 infrastructure segment; implement sophisticated hedging strategies; engage with project development team to understand roadmap and technical architecture; assess regulatory implications across operating jurisdictions
METIS Trading Participation Methods
- Spot trading on Gate.com: Direct purchase and sale of METIS tokens with immediate settlement, suitable for all investor types seeking straightforward exposure
- Gate Web3 Wallet integration: Self-custody solution enabling secure storage while maintaining trading flexibility; supports ETH network where METIS operates
- Portfolio diversification approach: Combine METIS with other Layer 2 and infrastructure tokens to create balanced exposure to blockchain scaling solutions
Cryptocurrency investment carries extremely high risk, and this article does not constitute investment advice. Investors should make cautious decisions based on their own risk tolerance and are advised to consult professional financial advisors. Never invest more than you can afford to lose.
FAQ
Metis has shown strong growth since launch, reaching significant highs during bull markets. The layer 2 scaling solution has demonstrated resilience with increasing adoption. Looking ahead, price could continue rising as ecosystem expands and transaction volume grows, driven by enhanced scalability and DeFi opportunities on the network.
What are Metis's advantages as a Layer 2 solution and what impact does this have on its price?
Metis offers high throughput, low fees, and fast transactions through optimized rollup technology. These advantages enhance scalability and user experience, driving increased adoption and demand, which typically supports positive price momentum for METIS tokens.
How is Metis's competitiveness compared to other Layer 2 projects like Arbitrum and Optimism?
Metis excels with lower transaction costs, faster finality, and unique Sequencer design. Its innovative rollup technology and strong developer ecosystem position it competitively, offering superior scalability and user experience advantages over traditional Layer 2 solutions.
What are the main factors affecting Metis price?
Metis price is influenced by network adoption and transaction volume, layer 2 scaling demand, market sentiment, Bitcoin and Ethereum trends, ecosystem development progress, token supply dynamics, and macroeconomic conditions in crypto markets.
What are the risks I should consider when investing in Metis?
Metis investments carry market volatility risk, liquidity risk, technology risk, and regulatory uncertainty. Price fluctuations can be significant. Conduct thorough research and only invest what you can afford to lose.
What is the current state of Metis ecosystem development and what is the future roadmap?
Metis has established a robust Layer 2 scaling solution with growing dApp ecosystem and DeFi applications. Future roadmap includes enhanced interoperability, expanded developer tools, increased transaction throughput optimization, and strategic partnerships to drive ecosystem expansion and adoption across Web3 applications.
* The information is not intended to be and does not constitute financial advice or any other recommendation of any sort offered or endorsed by Gate.