This comprehensive analysis examines Space and Time (SXT) token's price dynamics from 2026 through 2031, providing professional forecasts for this Web3 decentralized data infrastructure asset. Currently trading at $0.0265 with a $37.1 million market cap, SXT serves gaming, DeFi analytics, and enterprise applications requiring tamper-proof solutions. The article evaluates historical price trends, market positioning with 1.4 billion circulating tokens, and holding distribution patterns across 24,838 holders. It presents conservative to optimistic price scenarios, predicting potential appreciation ranging from 13% to 70% through 2031, driven by ecosystem expansion and technological advancement. Detailed investment methodologies, risk management frameworks, and security recommendations equip both experienced and beginner investors with actionable strategies. The analysis highlights market volatility, liquidity considerations, and regulatory risks while positioning SXT within the decentralized data infrastructure
Introduction: SXT's Market Position and Investment Value
Space and Time (SXT), as a web3-native decentralized data platform supporting low-latency querying and tamper-proof analytics across Web3, has been making strides in the blockchain data infrastructure space since its inception. As of January 2026, SXT maintains a market capitalization of approximately $37.1 million, with a circulating supply of around 1.4 billion tokens, and a price hovering around $0.0265. This asset, recognized for its innovative approach to blockchain-interoperable data processing, is playing an increasingly important role in gaming, DeFi data analytics, and enterprise-scale decentralized applications that require verifiable tamper-proof and blockchain-secure solutions.
This article will comprehensively analyze SXT's price trends from 2026 to 2031, combining historical patterns, market supply and demand dynamics, ecosystem development, and macroeconomic environment factors to provide investors with professional price forecasts and practical investment strategies.
I. SXT Price History Review and Market Status
SXT Historical Price Evolution Trajectory
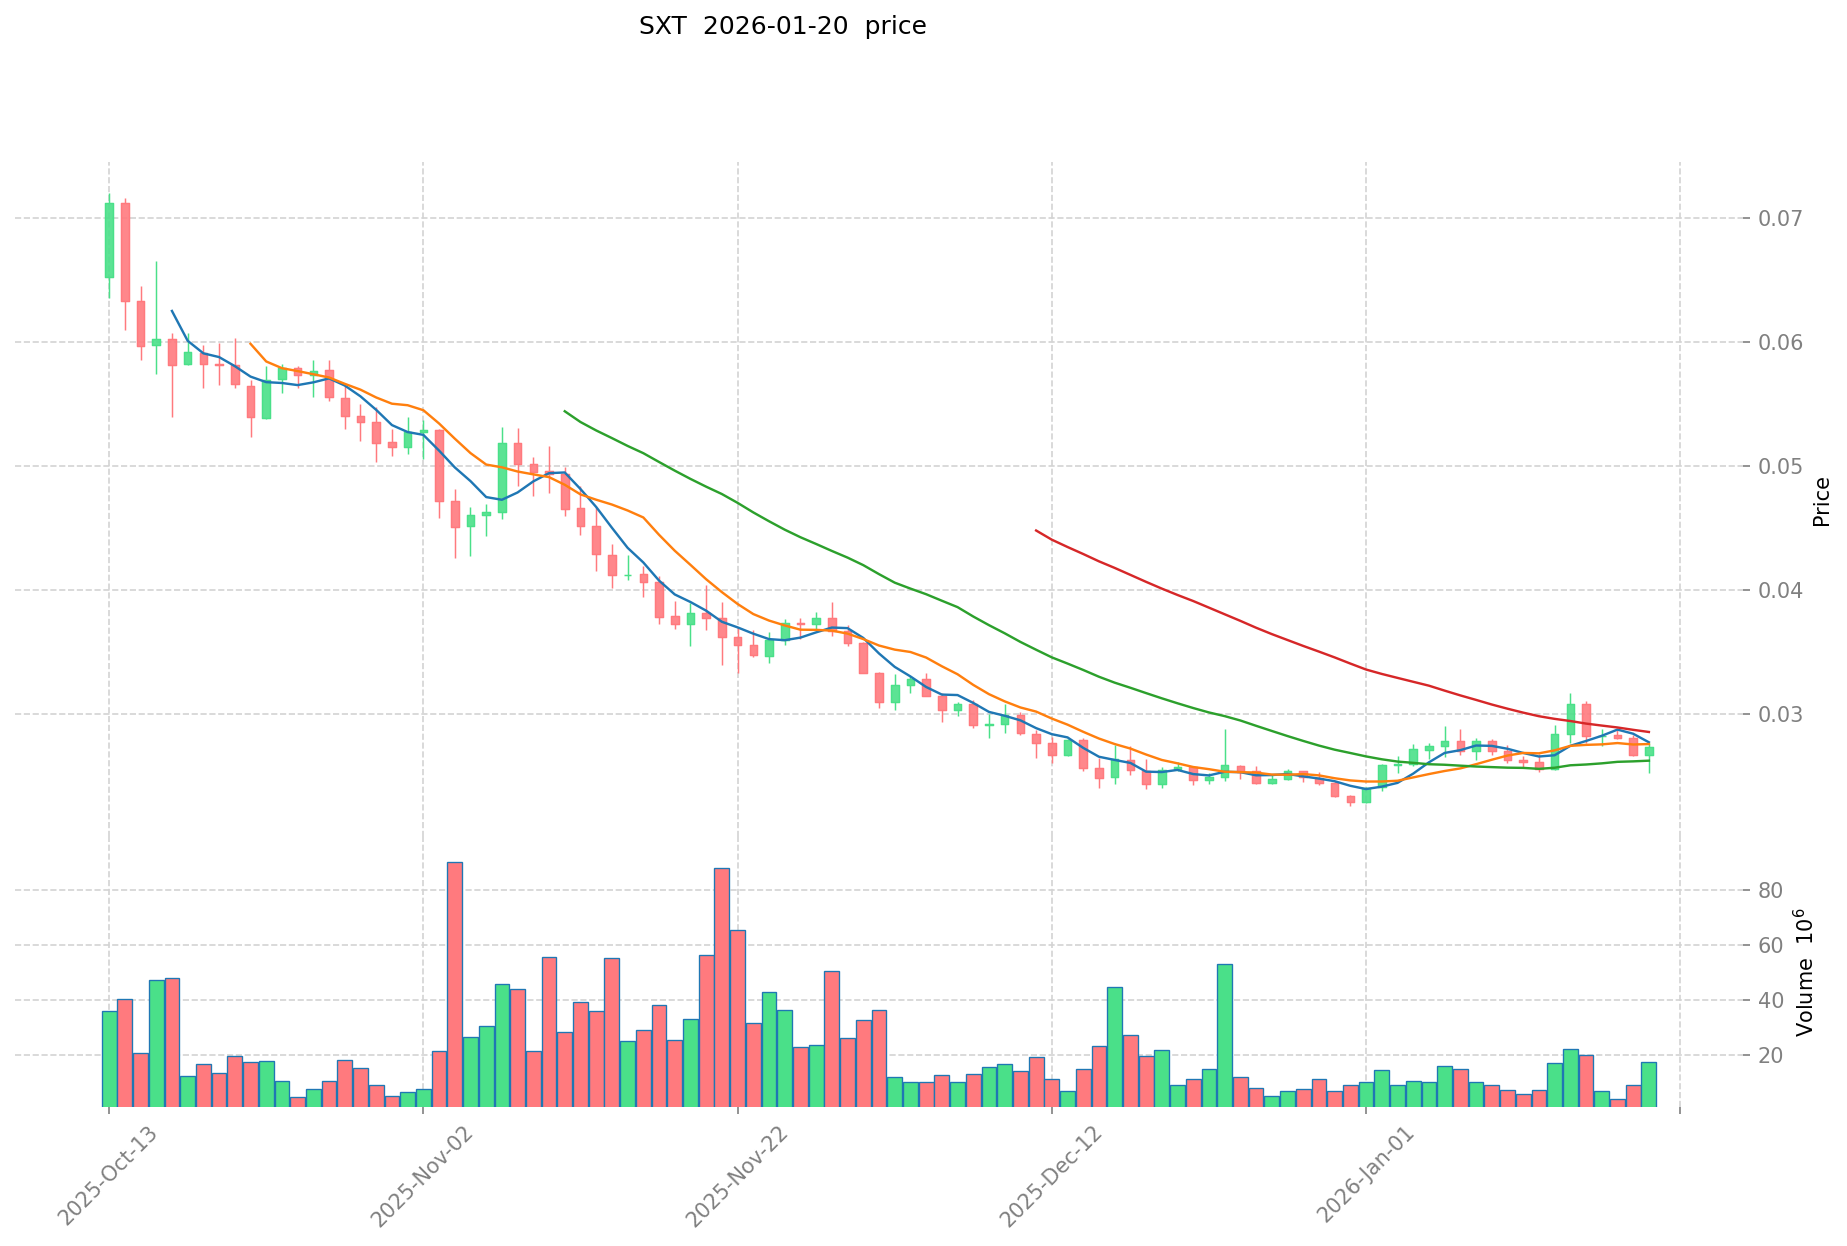
Space and Time (SXT) is a relatively new cryptocurrency in the market. Based on available data, the token experienced its peak price of $0.178 on May 8, 2025, representing a significant milestone in its early trading history. Subsequently, the price underwent a correction phase, reaching its lowest recorded level of $0.02256 on December 31, 2025.
SXT Current Market Status
As of January 20, 2026, SXT is trading at $0.0265, with a market capitalization of approximately $37.1 million and a ranking of 628 among cryptocurrencies. The token demonstrates a circulating supply of 1.4 billion tokens out of a maximum supply of 5 billion, representing 28% of total supply in circulation.
Recent price action shows mixed performance across different timeframes. Over the past hour, SXT has gained 0.27%, while the 24-hour period reflects a decline of 2.93%. The 7-day performance shows a modest increase of 1.069%, and the 30-day period indicates a gain of 4.01%. The 24-hour trading volume stands at approximately $248,050, with price fluctuating between $0.02626 and $0.02765.
The token maintains a fully diluted market cap of $132.5 million, with a market cap to FDV ratio of 28%, suggesting substantial token supply yet to enter circulation. Currently, SXT holds approximately 0.0041% market dominance in the cryptocurrency space. The project has attracted 24,838 holders and is listed on 35 exchanges.
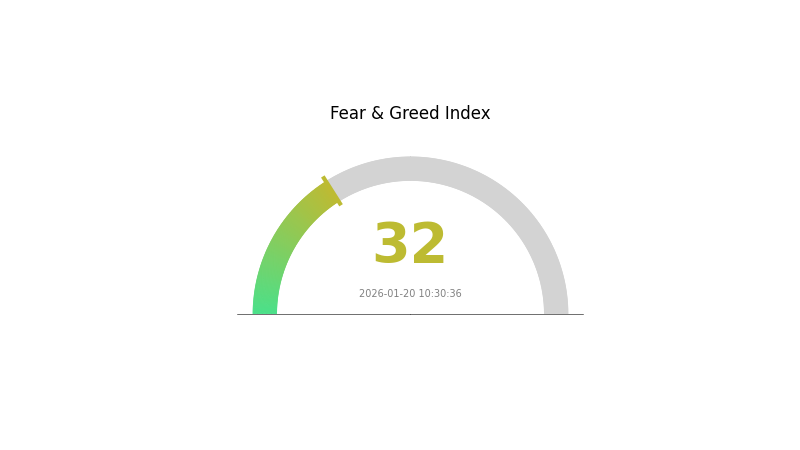
Market sentiment analysis indicates a fear level with a VIX reading of 32, reflecting cautious investor sentiment in the broader market environment.
Click to view current SXT market price
SXT Market Sentiment Indicator
2026-01-20 Fear & Greed Index: 32 (Fear)
Click to view current Fear & Greed Index
The cryptocurrency market is currently experiencing significant fear sentiment with an index reading of 32. This fear-driven environment typically indicates heightened market anxiety and risk-averse investor behavior. Such conditions often create both challenges and opportunities for traders. During periods of fear, volatility tends to increase as market participants reassess positions and valuations. Savvy investors may view this as a potential accumulation phase, while others may prefer to reduce exposure. Understanding this sentiment metric can help inform trading strategies and risk management decisions on Gate.com's comprehensive market data platform.
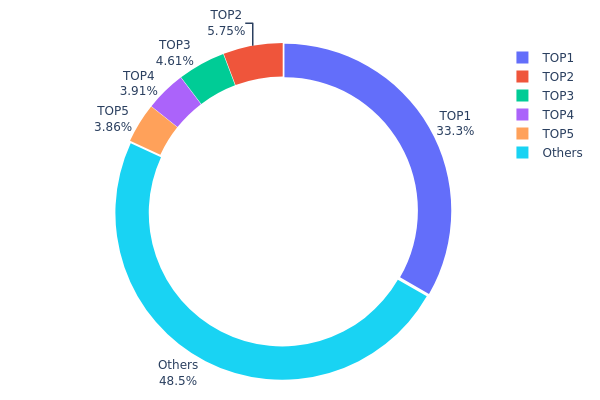
SXT 持仓分布
According to on-chain data analysis, SXT's address holding distribution reveals a moderate concentration pattern in its current market structure. The top holder controls approximately 33.32% of the total supply with 1.67 billion tokens, while the second through fifth largest addresses hold 5.75%, 4.61%, 3.91%, and 3.85% respectively. Combined, the top five addresses account for 51.44% of the total supply, with the remaining 48.56% distributed among other addresses.
This distribution pattern indicates a relatively balanced yet notable concentration level. While the dominant position of the largest holder at one-third of total supply presents potential centralization concerns, the gradual decline in holding percentages among subsequent top addresses (from 5.75% to 3.85%) suggests a more distributed secondary tier. The fact that nearly half of the supply resides outside the top five addresses demonstrates some degree of decentralization, though market participants should remain cognizant of the influence wielded by major holders.
From a market dynamics perspective, this concentration structure may amplify price volatility during significant market movements. Large holders possess substantial power to impact liquidity and price action through their trading decisions. However, the presence of a considerable "Others" category holding 48.56% provides a counterbalance, potentially mitigating excessive manipulation risks. This holding pattern reflects a typical early-stage tokenomics structure where project-related addresses and early participants maintain significant positions, while the token gradually distributes across a broader user base through market circulation.
Click to view current SXT Holding Distribution
| Top |
Address |
Holding Qty |
Holding (%) |
| 1 |
0xf334...72eeed |
1666169.40K |
33.32% |
| 2 |
0x5317...88b32f |
287500.00K |
5.75% |
| 3 |
0x6d91...db1ce2 |
230690.15K |
4.61% |
| 4 |
0xce1e...e0c833 |
195747.62K |
3.91% |
| 5 |
0xf977...41acec |
192806.62K |
3.85% |
| - |
Others |
2427086.21K |
48.56% |
II. Core Factors Influencing SXT's Future Price
Based on the available information, specific details regarding SXT's supply mechanisms, institutional dynamics, macroeconomic environment impact, and technical developments are currently limited. As more data becomes available about this cryptocurrency, a comprehensive analysis of these factors will be essential for understanding its price trajectory.
Investors and analysts should monitor official announcements from the project team, on-chain data analytics, and broader market conditions to better assess SXT's potential price movements. Key areas to watch include any upcoming protocol upgrades, partnership announcements, and changes in market sentiment within the cryptocurrency sector.
III. 2026-2031 SXT Price Prediction
2026 Outlook
- Conservative Forecast: $0.01853 - $0.02647
- Neutral Forecast: Around $0.02647
- Optimistic Forecast: Up to $0.03362 (requires favorable market conditions and ecosystem development)
2027-2029 Mid-term Outlook
- Market Stage Expectation: The token may experience gradual appreciation as the project matures and gains broader market recognition. Price volatility could moderate compared to early stages.
- Price Range Forecast:
- 2027: $0.02464 - $0.03155 (approximately 13% average increase from 2026)
- 2028: $0.02464 - $0.04034 (approximately 16% average increase from 2026)
- 2029: $0.03272 - $0.04766 (approximately 34% average increase from 2026)
- Key Catalysts: Ecosystem expansion, technological upgrades, strategic partnerships, and broader cryptocurrency market trends could serve as primary drivers for price appreciation during this period.
2030-2031 Long-term Outlook
- Baseline Scenario: $0.02996 - $0.04869 in 2030 (assuming steady project development and stable market conditions, representing approximately 57% average increase from 2026)
- Optimistic Scenario: $0.03793 - $0.04786 in 2031 (assuming successful implementation of roadmap milestones and favorable regulatory environment, representing approximately 70% average increase from 2026)
- Transformational Scenario: Potential to reach upper range limits if the project achieves significant mainstream adoption and demonstrates exceptional utility within the blockchain ecosystem
| Year |
Predicted High Price |
Predicted Average Price |
Predicted Low Price |
Price Change |
| 2026 |
0.03362 |
0.02647 |
0.01853 |
0 |
| 2027 |
0.03155 |
0.03004 |
0.02464 |
13 |
| 2028 |
0.04034 |
0.03079 |
0.02464 |
16 |
| 2029 |
0.04766 |
0.03557 |
0.03272 |
34 |
| 2030 |
0.04869 |
0.04161 |
0.02996 |
57 |
| 2031 |
0.04786 |
0.04515 |
0.03793 |
70 |
IV. SXT Professional Investment Strategies and Risk Management
SXT Investment Methodology
(I) Long-term Holding Strategy
- Suitable for: Investors focused on decentralized data infrastructure and Web3 ecosystem development
- Operational Recommendations:
- Consider accumulating positions during periods of consolidation, particularly when trading near established support levels
- Monitor project development milestones, partnerships, and adoption metrics as indicators of long-term value
- Implement secure storage solutions to protect holdings over extended timeframes
(II) Active Trading Strategy
- Technical Analysis Tools:
- Volume analysis: Monitor 24-hour trading volume ($248,050) relative to market capitalization to identify liquidity patterns
- Price range identification: Track recent trading boundaries (24H high: $0.02765, 24H low: $0.02626) for potential entry and exit points
- Swing Trading Considerations:
- Observe short-term price movements (1H: +0.27%, 7D: +1.069%) to identify momentum shifts
- Set appropriate stop-loss levels to manage downside exposure in volatile market conditions
SXT Risk Management Framework
(I) Asset Allocation Principles
- Conservative investors: 1-3% of crypto portfolio allocation
- Moderate investors: 3-5% of crypto portfolio allocation
- Experienced investors: 5-10% of crypto portfolio allocation, with position sizing based on individual risk tolerance
(II) Risk Hedging Approaches
- Portfolio diversification: Balance SXT holdings with other asset classes and established cryptocurrencies
- Position scaling: Gradually build positions rather than committing full allocation immediately
(III) Secure Storage Solutions
- Hot wallet recommendation: Gate Web3 Wallet for active trading and convenient access
- Cold storage approach: Consider hardware wallet solutions for long-term holdings exceeding trading needs
- Security precautions: Enable two-factor authentication, regularly update security protocols, and maintain backup recovery phrases in secure offline locations
V. SXT Potential Risks and Challenges
SXT Market Risks
- Volatility exposure: Recent 24-hour decline of 2.93% demonstrates susceptibility to market fluctuations
- Liquidity considerations: Trading volume of approximately $248,050 may limit execution capacity for larger positions
- Market capitalization positioning: Current ranking at 628 with 0.0041% market dominance indicates exposure to broader market sentiment shifts
SXT Regulatory Risks
- Evolving regulatory frameworks: Decentralized data platforms may face scrutiny as global authorities develop Web3 oversight mechanisms
- Compliance requirements: Cross-jurisdictional operations could encounter varying regulatory standards affecting operational flexibility
- Tokenomics scrutiny: Token utility and distribution models may attract regulatory attention in certain jurisdictions
SXT Technical Risks
- Platform dependency: Project success relies on continued adoption and integration by decentralized applications
- Competition exposure: Emerging alternative data infrastructure solutions could challenge market positioning
- Technology execution: Delivery of low-latency querying and tamper-proof analytics at scale requires sustained technical development
VI. Conclusion and Action Recommendations
SXT Investment Value Assessment
Space and Time presents an opportunity within the decentralized data infrastructure sector, targeting interoperability for gaming, DeFi, and enterprise-scale applications. With 28% of maximum supply in circulation (1.4 billion of 5 billion tokens) and deployment on ETH and BASEEVM networks, the project maintains operational presence across established blockchain ecosystems. However, current market volatility, moderate liquidity levels, and competitive pressures within the Web3 data sector necessitate careful consideration of both growth potential and associated risks.
SXT Investment Recommendations
✅ Beginners: Consider small exploratory positions only after thorough research into decentralized data platforms; prioritize understanding project fundamentals before committing capital
✅ Experienced Investors: Evaluate positioning within broader portfolio context; monitor development progress, partnership announcements, and adoption metrics before adjusting exposure
✅ Institutional Investors: Assess alignment with Web3 infrastructure investment thesis; conduct comprehensive due diligence on technology capabilities, competitive positioning, and tokenomics structure
SXT Trading Participation Methods
- Spot trading: Direct acquisition through cryptocurrency exchanges supporting SXT trading pairs
- Dollar-cost averaging: Systematic periodic purchases to mitigate timing risk and reduce impact of short-term volatility
- Gate.com platform: Access trading functionality, market data, and secure storage options including Gate Web3 Wallet integration
Cryptocurrency investments carry substantial risk, and this content does not constitute investment advice. Investors should make decisions based on individual risk tolerance and consider consulting professional financial advisors. Never invest more than you can afford to lose.
FAQ
SXT has demonstrated significant growth since launch, with price appreciation driven by increasing adoption and platform development. The token experienced notable volatility typical of emerging cryptocurrencies, with peaks during bull market cycles and corrections during market downturns. Long-term holders have seen substantial returns as the project expanded its ecosystem and user base.
What are the main factors affecting SXT price?
SXT price is primarily influenced by market demand, transaction volume, network adoption, overall crypto market sentiment, regulatory developments, and technological updates to the Sixant platform.
What is the SXT price prediction for 2024-2025?
Based on market analysis, SXT showed strong growth potential during 2024-2025, with analysts projecting prices between $0.80-$1.50 range, driven by increased adoption and network expansion. However, market conditions remain volatile.
What advantages does SXT have compared to other mining tokens?
SXT offers superior transaction efficiency, lower mining barriers, and stronger ecosystem utility. It features faster confirmation times, reduced operational costs, and integrated DeFi applications. The token provides better rewards distribution and transparent governance, making it more accessible for miners seeking sustainable long-term value.
What are the risks to pay attention to when investing in SXT?
SXT investment risks include market volatility, liquidity fluctuations, regulatory uncertainty, and technology development delays. Monitor trading volume, project updates, and market conditions closely. Diversify your portfolio and only invest capital you can afford to lose.
What are the circulating supply and total supply of SXT?
SXT's circulating supply is approximately 350 million tokens, with a total supply of 5 billion tokens. These figures represent the current token distribution as of 2026, reflecting the project's tokenomics and long-term allocation strategy.
* The information is not intended to be and does not constitute financial advice or any other recommendation of any sort offered or endorsed by Gate.