This comprehensive analysis examines VARA token's price trajectory from 2026 to 2031, providing investors with professional forecasts and practical strategies. The article reviews VARA's historical performance since its 2023 launch, current market status at $0.001248, and critical factors influencing future valuations. It projects conservative forecasts for 2026 at $0.00079-$0.00125, with growth potential reaching $0.00297 by 2031 under favorable conditions. The guide covers long-term holding and active trading strategies on Gate.com, asset allocation frameworks, and comprehensive risk management approaches. Additionally, it addresses regulatory challenges, technical dependencies, and liquidity constraints that investors should carefully consider. Suitable for beginners and experienced cryptocurrency investors seeking Web3 infrastructure exposure.
Introduction: VARA's Market Position and Investment Value
VaraNetwork (VARA), as a cutting-edge Web3 infrastructure platform designed for decentralized application development, has been advancing the blockchain ecosystem since its launch in 2023. As of 2026, VARA maintains a market capitalization of approximately $6.06 million, with a circulating supply of around 4.86 billion tokens, and its price hovering near $0.001248. This asset, recognized as an innovative platform integrating the Actor Model and Persistent Memory architecture, is playing an increasingly vital role in the development of next-generation decentralized applications.
This article will comprehensively analyze VARA's price trajectory from 2026 to 2031, combining historical patterns, market supply and demand dynamics, ecosystem development, and macroeconomic conditions to provide investors with professional price forecasts and practical investment strategies.
I. VARA Price History Review and Market Status
VARA Historical Price Evolution Trajectory
- 2023: VARA launched on September 20, 2023, with a publish price of $0.25, marking its entry into the cryptocurrency market
- 2024: On January 17, 2024, VARA reached a notable price level of $0.2, representing a significant phase in its early trading history
- 2025: The token experienced substantial volatility throughout the year, with price declining to $0.0008251 by December 31, 2025
VARA Current Market Situation
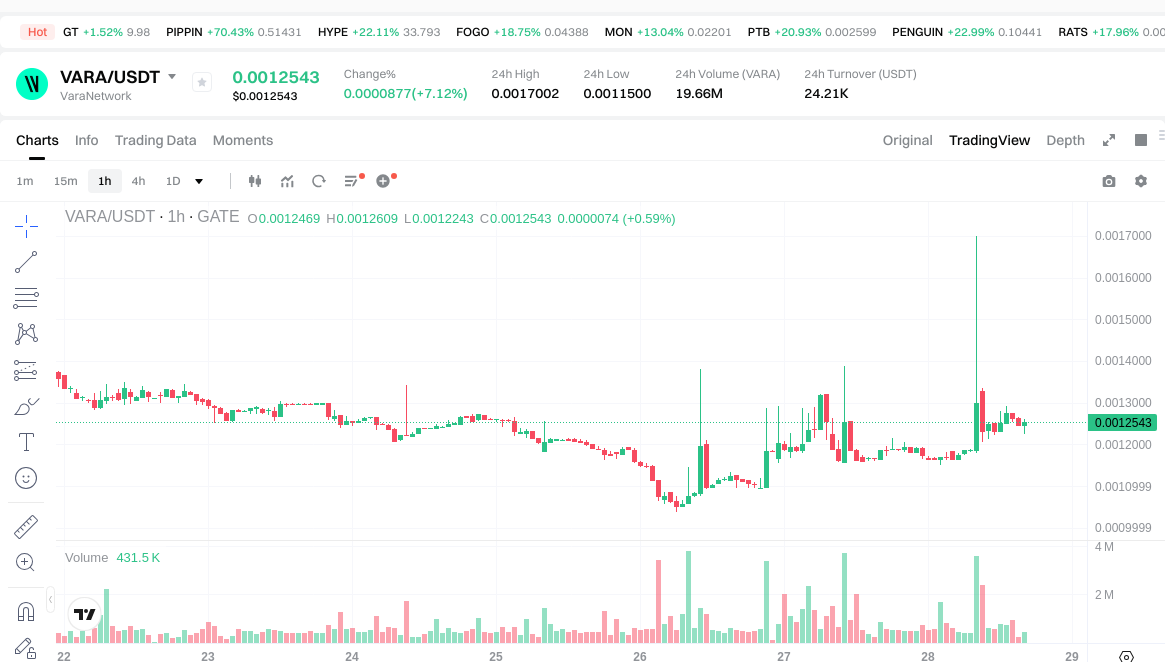
As of January 28, 2026, VARA is trading at $0.0012482, showing a 24-hour increase of 7.75%. The token's 24-hour trading range spans from $0.00115 to $0.0017002, reflecting active price movement within the day.
From a short-term perspective, VARA demonstrates mixed performance across different timeframes. The 1-hour price change stands at -0.75%, while the 7-day trend shows a decline of 2.88%. However, the 30-day performance presents a contrasting picture with a gain of 33.11%, indicating recent positive momentum in the monthly timeframe.
The token's market capitalization is approximately $6.06 million, with a circulating supply of 4.86 billion VARA tokens out of a maximum supply of 10 billion tokens. This represents a circulation ratio of 48.57%. The fully diluted market capitalization stands at $12.48 million, and the token holds a market share of 0.00039%.
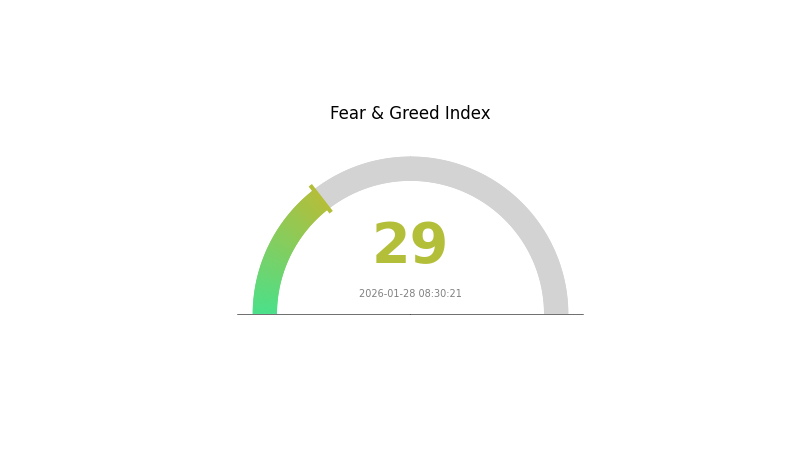
VARA's 24-hour trading volume reaches $24,373.13, suggesting moderate trading activity in the current market environment. The token is listed on 2 exchanges, with Gate.com being one of the trading platforms. The current market sentiment index indicates a "Fear" level at 29, reflecting cautious investor sentiment in the broader cryptocurrency market.
Comparing the current price to historical levels, VARA is trading significantly below its previous price points from 2023-2024, while showing recovery from the December 2025 level. The year-to-date performance shows a decline of 92.60% from the previous year's comparable period.
Click to view current VARA market price
VARA Market Sentiment Index
2026-01-28 Fear and Greed Index: 29 (Fear)
Click to view current Fear & Greed Index
Market Analysis:
The VARA market is currently experiencing a fear sentiment with an index reading of 29, indicating heightened market anxiety. This low index suggests investors are expressing caution and concern about price movements. During fear periods, market participants often adopt defensive strategies, with increased selling pressure and reduced speculative activity. Such conditions may present opportunities for value-oriented investors, as assets trade at discounted levels. It is recommended to monitor market developments closely and consider the broader macroeconomic environment before making investment decisions. Risk management remains paramount during periods of elevated market uncertainty.
VARA Holdings Distribution
The holdings distribution chart illustrates the concentration of VARA tokens across different wallet addresses, providing crucial insights into the decentralization level and potential market manipulation risks. By analyzing the proportion of tokens held by top addresses, we can assess whether the token distribution follows a healthy pattern or exhibits excessive concentration that might threaten market stability.
Based on the current data, VARA demonstrates a relatively balanced distribution structure. The top holder controls approximately 8.45% of the total supply, while the combined holdings of the top 10 addresses account for roughly 34.67% of all tokens. This concentration level falls within a moderate range compared to industry standards, suggesting that no single entity possesses overwhelming market control. The gradual decline in holdings from the top address to the tenth address indicates a natural distribution curve, which typically reflects organic market participation rather than artificial accumulation patterns.
From a market structure perspective, this distribution pattern presents both advantages and considerations. The moderate concentration provides sufficient liquidity depth from major holders while maintaining reasonable decentralization to prevent single-party market manipulation. However, the top 10 addresses collectively holding over one-third of the supply means that coordinated actions among these entities could still create significant price volatility. The relatively dispersed nature of holdings beyond the top addresses suggests a growing retail and institutional participation base, which generally contributes to market maturity and price stability over time.
Click to view current VARA Holdings Distribution

| Top |
Address |
Holding Qty |
Holding (%) |
II. Core Factors Influencing VARA's Future Price
Supply Mechanism
Based on the available reference materials, specific details regarding VARA's supply mechanism cannot be accurately determined. Market demand, production costs, and company performance are general factors that may influence pricing dynamics in traditional business contexts. However, for a comprehensive understanding of VARA's tokenomics, detailed information about emission schedules, burning mechanisms, or vesting periods would be necessary.
Institutional and Major Holder Dynamics
The provided materials do not contain concrete information about institutional holdings, corporate adoption patterns, or national policy frameworks specifically related to VARA. Market analysis suggests that institutional behavior and regulatory developments typically play significant roles in asset price movements, though specific data for VARA remains unavailable in the current reference materials.
Macroeconomic Environment
Monetary Policy Impact: Economic trends and macroeconomic conditions represent important contextual factors for market performance. According to industry observations, liquidity policies and broader economic indicators continue to influence market dynamics. However, specific correlations between central bank policies and VARA's price behavior require further detailed analysis.
Inflation Hedge Characteristics: While digital assets have been discussed as potential inflation hedges in various market conditions, the specific performance characteristics of VARA in inflationary environments are not documented in the available materials.
Geopolitical Factors: Regulatory changes can impact pricing strategies across financial markets. The relationship between international regulatory developments and VARA's market position would benefit from more targeted research and analysis.
Technical Development and Ecosystem Building
The reference materials do not provide specific information about VARA's technical upgrades, protocol improvements, or ecosystem applications. Industry competition and technological advancement remain relevant factors in the broader digital asset landscape, though their specific application to VARA's development roadmap requires additional documentation.
For investors and analysts interested in VARA, conducting thorough due diligence through official project channels, technical documentation, and verified data sources would be essential for forming well-informed perspectives on the asset's future trajectory.
III. 2026-2031 VARA Price Prediction
2026 Outlook
- Conservative forecast: $0.00079 - $0.00125
- Neutral forecast: Around $0.00125
- Optimistic forecast: Up to $0.00142 (requires favorable market conditions)
2027-2029 Mid-term Outlook
- Market stage expectation: Gradual growth phase with moderate volatility
- Price range forecast:
- 2027: $0.00102 - $0.00155 (7% increase)
- 2028: $0.00124 - $0.00172 (15% increase)
- 2029: $0.00117 - $0.0021 (26% increase)
- Key catalysts: Sustained market adoption and ecosystem development
2030-2031 Long-term Outlook
- Baseline scenario: $0.00153 - $0.00269 (assuming steady market conditions)
- Optimistic scenario: $0.00183 - $0.00297 (with enhanced adoption and positive market sentiment)
- Transformative scenario: Potential to exceed $0.00297 (under exceptionally favorable conditions including significant technological breakthroughs and widespread institutional adoption)
- 2028-01-28: VARA projected at $0.00144 (mid-range estimate)
| Year |
Predicted High Price |
Predicted Average Price |
Predicted Low Price |
Price Change |
| 2026 |
0.00142 |
0.00125 |
0.00079 |
0 |
| 2027 |
0.00155 |
0.00134 |
0.00102 |
7 |
| 2028 |
0.00172 |
0.00144 |
0.00124 |
15 |
| 2029 |
0.0021 |
0.00158 |
0.00117 |
26 |
| 2030 |
0.00269 |
0.00184 |
0.00153 |
47 |
| 2031 |
0.00297 |
0.00226 |
0.00183 |
81 |
IV. VARA Professional Investment Strategy and Risk Management
VARA Investment Methodology
(1) Long-term Holding Strategy
- Suitable for: Investors seeking exposure to emerging Web3 infrastructure projects with a multi-year investment horizon
- Operational Recommendations:
- Consider dollar-cost averaging (DCA) during periods of market volatility to minimize timing risk
- Monitor network development milestones, including dApp ecosystem growth and technical upgrades
- Implement portfolio rebalancing strategies when VARA allocation exceeds predetermined thresholds
- Storage Solution: Utilize Gate Web3 Wallet for secure custody with multi-signature protection and hardware wallet integration options
(2) Active Trading Strategy
- Technical Analysis Tools:
- Moving Averages (MA): Track 50-day and 200-day MAs to identify trend reversals and momentum shifts; current 24H volume of $24,373 suggests moderate liquidity for short-term positioning
- Relative Strength Index (RSI): Monitor overbought/oversold conditions, particularly relevant given VARA's 7.75% 24H price increase and historical volatility range between $0.0008251 and $0.20
- Swing Trading Considerations:
- Establish entry and exit parameters based on support levels near recent lows and resistance at previous highs
- Implement trailing stop-loss orders to protect gains during periods of elevated volatility
VARA Risk Management Framework
(1) Asset Allocation Principles
- Conservative Investors: 1-3% of cryptocurrency portfolio allocation, prioritizing capital preservation
- Aggressive Investors: 5-10% allocation for higher risk tolerance profiles seeking growth exposure
- Professional Investors: 10-15% with active portfolio hedging strategies and derivatives usage
(2) Risk Hedging Solutions
- Diversification Approach: Balance VARA exposure with established blockchain infrastructure tokens and stablecoins to reduce concentration risk
- Position Sizing: Limit individual trade sizes to 1-2% of total portfolio value to manage drawdown potential
(3) Security Storage Solutions
- Non-custodial Wallet Recommendation: Gate Web3 Wallet provides decentralized asset control with multi-chain support and enhanced security features
- Cold Storage Option: Consider hardware wallet integration for holdings exceeding $10,000 equivalent value
- Security Precautions: Enable two-factor authentication (2FA), regularly update wallet software, never share private keys or seed phrases, and verify contract addresses before transactions
V. VARA Potential Risks and Challenges
VARA Market Risks
- High Volatility: VARA has experienced significant price fluctuations with a 92.60% decline over one year, indicating substantial market risk for short-term holders
- Limited Liquidity: With a market capitalization of approximately $6.06 million and 24-hour trading volume of $24,373, liquidity constraints may impact large order execution and price stability
- Market Share Concentration: Current market dominance of 0.00039% suggests limited institutional adoption and potential vulnerability to broader market downturns
VARA Regulatory Risks
- Evolving Regulatory Landscape: Web3 infrastructure projects may face increased scrutiny from global financial regulators regarding compliance frameworks and operational standards
- Cross-border Compliance: As a decentralized network, VARA may encounter varying regulatory interpretations across different jurisdictions affecting operational flexibility
- Token Classification Uncertainty: Ongoing debates regarding digital asset classifications could impact VARA's trading status and accessibility on centralized exchanges
VARA Technical Risks
- Network Development Dependencies: Project success relies heavily on continued technical innovation and successful implementation of the Actor Model and Persistent Memory architecture
- Competitive Pressure: Emergence of alternative Layer 1 and Layer 2 solutions may dilute VARA's market positioning in the dApp development ecosystem
- Adoption Challenges: With only 48.57% of tokens currently circulating, future token releases could create selling pressure and impact price dynamics
VI. Conclusion and Action Recommendations
VARA Investment Value Assessment
VARA represents an early-stage Web3 infrastructure project with innovative architectural approaches combining Actor Model and Persistent Memory. While the technology demonstrates potential for next-generation dApp development, investors should carefully weigh the substantial risks reflected in the 92.60% annual decline and limited current market adoption. The project's long-term value proposition depends on successful ecosystem development, developer adoption, and competitive differentiation in a crowded blockchain infrastructure market. Short-term risks include high volatility, limited liquidity, and ongoing token distribution dynamics.
VARA Investment Recommendations
✅ Beginners: Consider minimal allocation (0.5-1% of crypto portfolio) only after thoroughly researching the project fundamentals and understanding blockchain technology basics; prioritize education over speculation
✅ Experienced Investors: Evaluate VARA as a speculative position within a diversified Web3 infrastructure portfolio allocation; implement strict risk management protocols and position sizing discipline
✅ Institutional Investors: Conduct comprehensive due diligence on technical architecture, team credentials, and competitive landscape before considering strategic positions; assess liquidity constraints for portfolio integration
VARA Trading Participation Methods
- Spot Trading: Access VARA through Gate.com with immediate settlement and full ownership; suitable for long-term accumulation strategies
- Portfolio Integration: Incorporate VARA as part of a broader Web3 infrastructure theme alongside complementary blockchain protocols
- Research-Driven Approach: Monitor project development milestones, partnership announcements, and ecosystem growth metrics before adjusting position sizes
Cryptocurrency investment carries extremely high risk, and this article does not constitute investment advice. Investors should make prudent decisions based on their own risk tolerance and are advised to consult professional financial advisors. Never invest more than you can afford to lose.
FAQ
What is VARA token? What is its project background and use case?
VARA is the native token of Vara Network, used for transaction fees, staking, and governance. It plays a key role in maintaining network operations and security. VARA has a limited total supply.
What is VARA's historical price trend? What were the past price changes?
VARA launched in January 2024 at a peak of $0.2. Throughout 2025, the market experienced significant corrections, reaching a historic low of $0.001118 in November. Current price momentum depends on network adoption and market sentiment recovery.
What are the main factors affecting VARA price?
VARA price is primarily driven by market demand, technological advancements, strategic partnerships, and regulatory environment. Successful product launches and ecosystem collaborations also significantly impact price movements.
What are expert predictions for VARA's future price?
Experts predict VARA's minimum price at US$0.0018211 and maximum at US$0.003353 by 2029 based on technical analysis. These forecasts reflect market trends and historical data patterns in the crypto market.
What are the advantages and disadvantages of VARA compared to other Layer-1 blockchain tokens?
VARA's advantages include low transaction costs, high scalability, and fast transaction speed. Disadvantages are lower market recognition and a less mature ecosystem compared to established Layer-1 blockchains.
What are the main risks of investing in VARA tokens?
Main risks include market volatility affecting token value, regulatory changes impacting legal status, liquidity constraints during market stress, and technology vulnerabilities. Investors should assess their risk tolerance carefully.
What is the VARA price prediction target for the next 3-5 years?
Based on current predictions, VARA is expected to reach a high of $0.067447 by 2032-2037, with a low estimate of $0.007396. This represents potential growth of over 3,200% from current levels.
* The information is not intended to be and does not constitute financial advice or any other recommendation of any sort offered or endorsed by Gate.