This comprehensive comparison examines AVA versus SOL as two distinct blockchain investment opportunities in 2024-2026. AVA operates as a utility token for Travala.com's travel booking platform, while SOL serves as the native token of a high-performance layer-1 blockchain protocol. The analysis covers historical price trends, tokenomics, market liquidity, institutional adoption, and technical ecosystems, with AVA priced at $0.3478 and SOL at $130.39 as of January 2026. Price forecasts through 2031 project SOL's baseline range at $177-$247, while AVA anticipates $0.31-$0.49. Key differences include SOL's significantly higher trading volume ($102.6M daily) and broader infrastructure applications versus AVA's niche use-case positioning. The article addresses critical investment considerations for conservative, aggressive, and institutional investors, emphasizing thorough risk assessment given extreme market fear sentiment (index: 20) and the cryptocurrency market's inherent volatility.
Introduction: Investment Comparison Between AVA and SOL
In the cryptocurrency market, the comparison between AVA vs SOL remains a key consideration for investors. These two assets differ significantly in market cap ranking, use cases, and price performance, representing distinct positions within the crypto ecosystem.
AVA: Operating as the native token of Travala.com, a travel booking platform launched in 2017, AVA serves as a payment and rewards mechanism within its ecosystem. It provides discounts when cryptocurrency is used for travel-related transactions.
SOL (Solana): Founded in late 2017 by former engineers from Qualcomm, Intel, and Dropbox, Solana is a high-performance blockchain protocol designed to provide scalability without compromising decentralization or security. It has established itself as one of the prominent layer-1 blockchain platforms.
This article will examine the investment value comparison of AVA vs SOL across multiple dimensions including historical price trends, supply mechanisms, institutional adoption, technical ecosystem, and future outlook, aiming to address the question investors frequently ask:
"Which is the better buy right now?"
I. Historical Price Comparison and Current Market Status
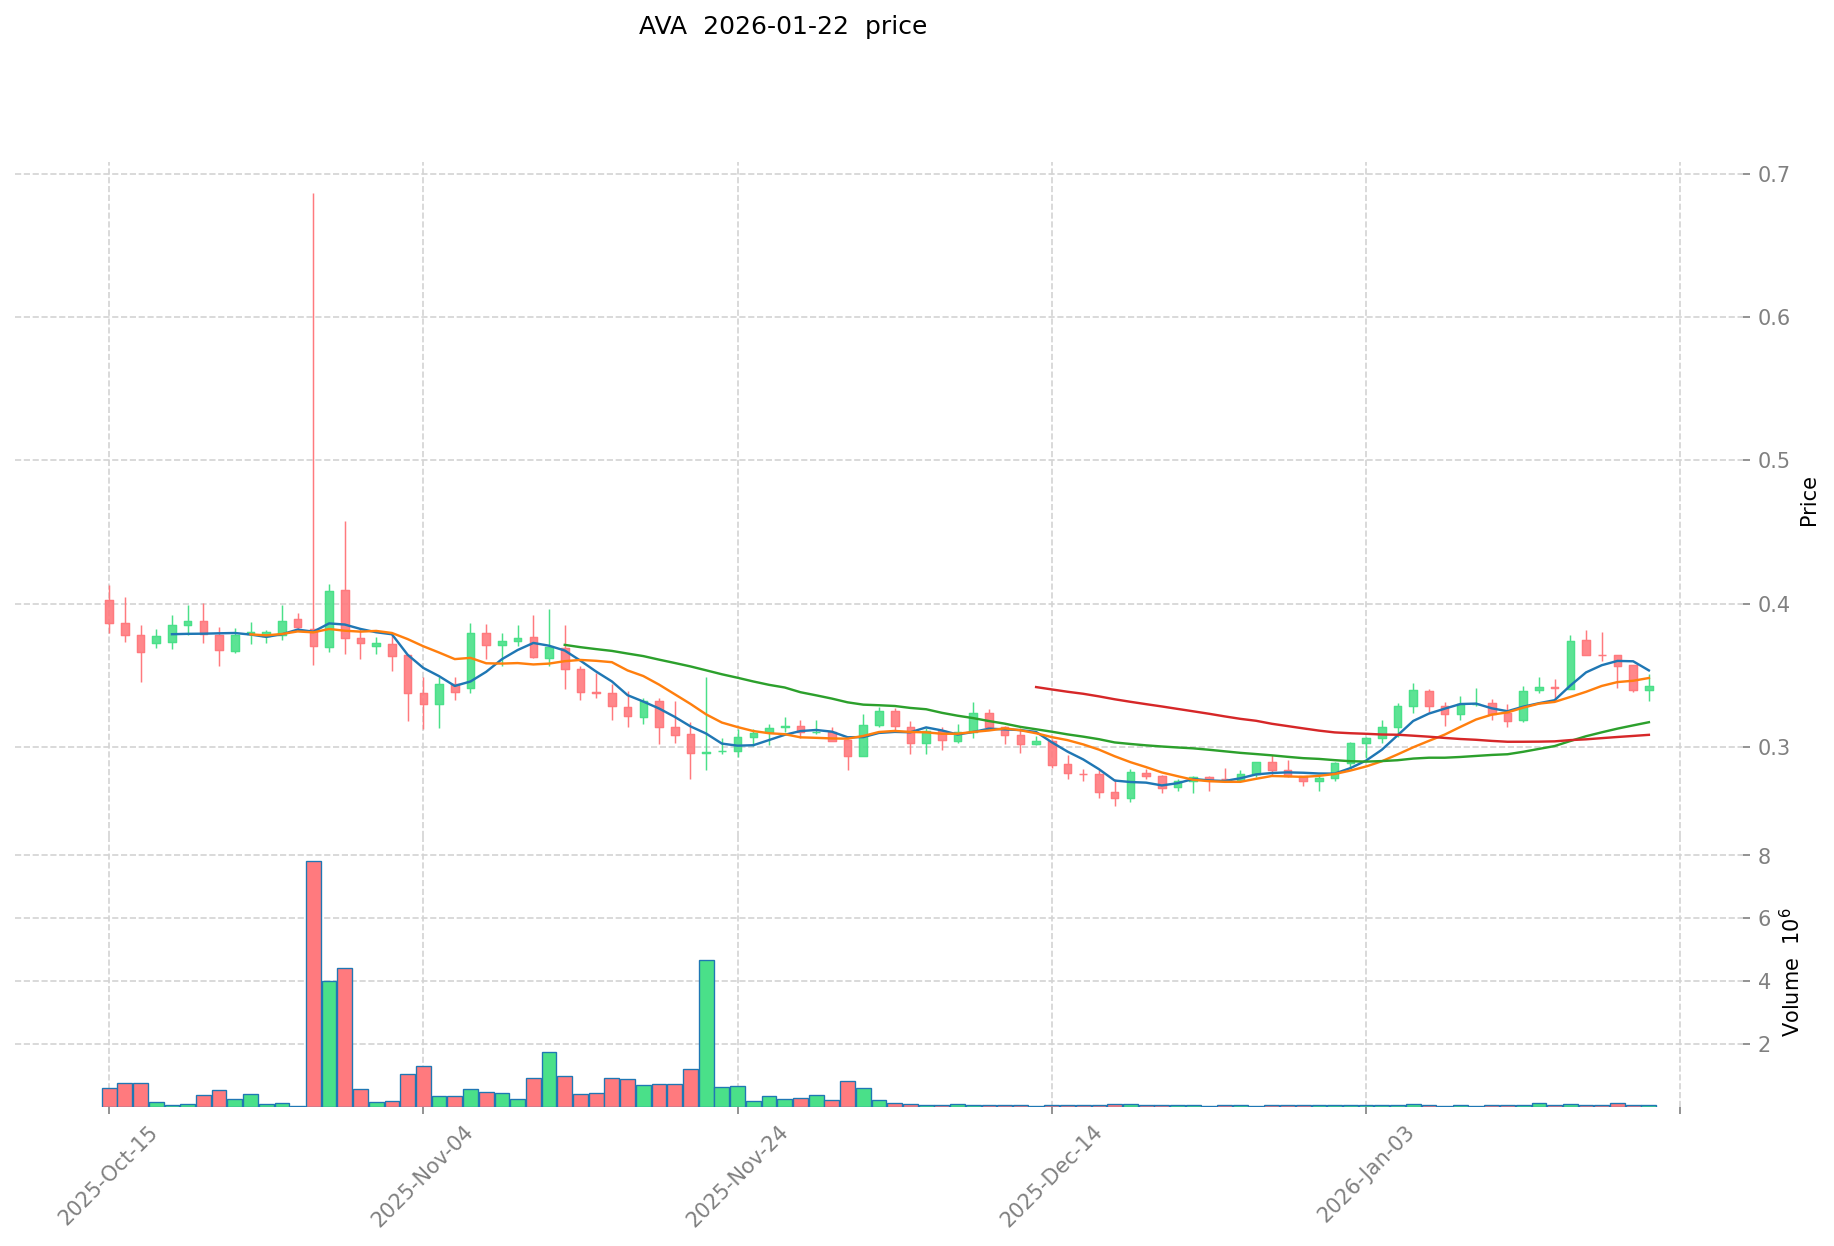
Historical Price Trends of AVA (Coin A) and SOL (Coin B)
- 2021: AVA reached a notable price level of $6.45 on April 14, 2021, representing a significant milestone in its trading history.
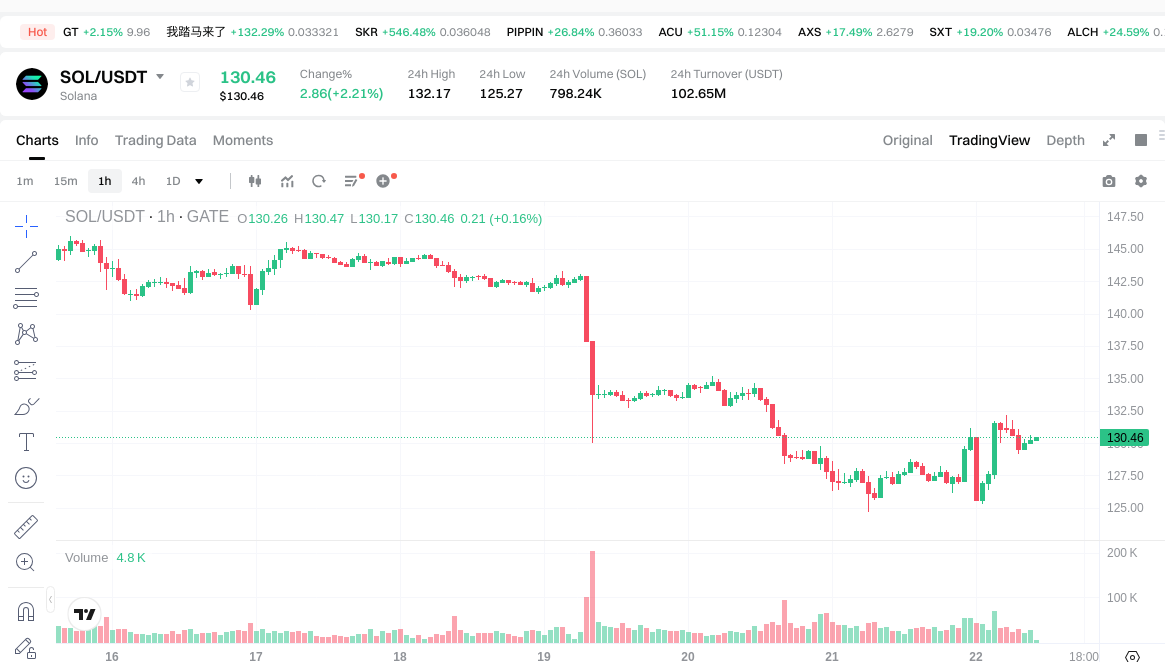
- 2025: SOL recorded a peak price of $293.31 on January 19, 2025, marking a substantial valuation point in its market trajectory.
- Comparative Analysis: During the market cycle, AVA experienced a decline from its historical high of $6.45 to its historical low of $0.01218947 (recorded on February 27, 2019), while SOL demonstrated a different pattern, moving from its all-time high of $293.31 to its historical low of $0.500801 (recorded on May 12, 2020).
Current Market Situation (January 22, 2026)
- AVA current price: $0.3478
- SOL current price: $130.39
- 24-hour trading volume: AVA $25,615.49 vs SOL $102,590,615.02
- Market Sentiment Index (Fear & Greed Index): 20 (Extreme Fear)
Click to view real-time prices:
II. Core Factors Affecting AVA vs SOL Investment Value
Supply Mechanism Comparison (Tokenomics)
Due to limited available data on the specific supply mechanisms of AVA and SOL, a detailed comparison cannot be provided at this time. General considerations for evaluating tokenomics include understanding whether a project employs fixed supply models, inflationary mechanisms, or deflationary burn models, and how these structures may influence long-term price dynamics.
Institutional Adoption and Market Application
- Institutional Holdings: Information regarding institutional preference between AVA and SOL is not available in the provided materials.
- Enterprise Adoption: Specific use cases for AVA and SOL in cross-border payments, settlement systems, or investment portfolios are not documented in the current reference materials.
- National Policies: Data on regulatory attitudes toward AVA and SOL across different jurisdictions is not available.
Technological Development and Ecosystem Building
- AVA Technical Upgrades: Details on recent or upcoming technical developments for AVA are not provided in the reference materials.
- SOL Technical Development: Information on SOL's technological roadmap and recent upgrades is not available.
- Ecosystem Comparison: Comparative data on the deployment and performance of DeFi protocols, NFT marketplaces, payment solutions, and smart contract implementations for AVA and SOL is not documented.
Macroeconomic Environment and Market Cycles
- Performance in Inflationary Environments: Analysis of which asset demonstrates stronger anti-inflation characteristics is not supported by the provided materials.
- Macroeconomic Monetary Policy: The specific impact of interest rates, US dollar index fluctuations, and other monetary policy variables on AVA and SOL is not available.
- Geopolitical Factors: Information regarding how cross-border transaction demand and international political situations affect these two assets is not documented in the reference materials.
III. 2026-2031 Price Forecast: AVA vs SOL
Short-term Forecast (2026)
- AVA: Conservative $0.19-$0.35 | Optimistic $0.35-$0.41
- SOL: Conservative $100-$130 | Optimistic $130-$178
Mid-term Forecast (2028-2029)
- AVA may enter a consolidation phase with anticipated price range of $0.28-$0.45 in 2028, potentially reaching $0.37-$0.54 by 2029
- SOL may enter an expansion phase with anticipated price range of $129-$229 in 2028, potentially reaching $126-$293 by 2029
- Key drivers: institutional capital inflows, ETF developments, ecosystem expansion
Long-term Forecast (2030-2031)
- AVA: Baseline scenario $0.31-$0.49 | Optimistic scenario $0.49-$0.63
- SOL: Baseline scenario $177-$247 | Optimistic scenario $247-$352
View detailed price predictions for AVA and SOL
Disclaimer
AVA:
| Year |
Predicted High Price |
Predicted Average Price |
Predicted Low Price |
Price Change |
| 2026 |
0.406926 |
0.3478 |
0.19129 |
0 |
| 2027 |
0.45660923 |
0.377363 |
0.23019143 |
8 |
| 2028 |
0.45451486535 |
0.416986115 |
0.2835505582 |
19 |
| 2029 |
0.53597310291525 |
0.435750490175 |
0.3747454215505 |
25 |
| 2030 |
0.626761717543211 |
0.485861796545125 |
0.31095154978888 |
39 |
| 2031 |
0.606379815178143 |
0.556311757044168 |
0.36716575964915 |
59 |
SOL:
| Year |
Predicted High Price |
Predicted Average Price |
Predicted Low Price |
Price Change |
| 2026 |
178.4836 |
130.28 |
100.3156 |
0 |
| 2027 |
189.889614 |
154.3818 |
81.822354 |
18 |
| 2028 |
228.94049031 |
172.135707 |
129.10178025 |
32 |
| 2029 |
292.7856240363 |
200.538098655 |
126.33900215265 |
53 |
| 2030 |
291.060996387867 |
246.66186134565 |
236.795386891824 |
89 |
| 2031 |
352.208471815453635 |
268.8614288667585 |
177.44854305206061 |
106 |
IV. Investment Strategy Comparison: AVA vs SOL
Long-term vs Short-term Investment Strategies
- AVA: May appeal to investors focusing on niche applications within the travel and tourism sector, particularly those interested in specific use-case tokens with utility in defined ecosystems
- SOL: May appeal to investors seeking exposure to established layer-1 blockchain infrastructure with broader ecosystem applications and demonstrated market presence
Risk Management and Asset Allocation
- Conservative Investors: Consider a balanced approach with careful evaluation of risk tolerance and market conditions before allocation
- Aggressive Investors: May explore higher allocations based on individual risk appetite and investment objectives
- Hedging Tools: Stablecoin positioning, options strategies, and cross-asset portfolio diversification
V. Potential Risk Comparison
Market Risk
- AVA: Faces exposure to market volatility with a 24-hour trading volume of $25,615.49, which may present liquidity considerations during periods of market stress
- SOL: Experiences market fluctuations with a 24-hour trading volume of $102,590,615.02, demonstrating relatively higher liquidity levels that may facilitate larger position adjustments
Technical Risk
- AVA: Scalability considerations and network stability factors require ongoing monitoring
- SOL: Network infrastructure resilience and security considerations remain areas of attention for investors
Regulatory Risk
- Global regulatory frameworks continue to evolve, potentially affecting both assets differently based on their specific use cases and jurisdictional classifications
VI. Conclusion: Which Is the Better Buy?
📌 Investment Value Summary:
- AVA Characteristics: Positioned as a utility token within the travel booking sector, currently priced at $0.3478 with forecasted ranges suggesting potential volatility
- SOL Characteristics: Established layer-1 blockchain platform currently priced at $130.39, with price forecasts indicating potential for continued market presence
✅ Investment Considerations:
- New Investors: Should prioritize thorough research, understanding of both projects' fundamentals, and careful consideration of risk tolerance before making allocation decisions
- Experienced Investors: May evaluate portfolio diversification strategies that account for different risk-return profiles and correlation patterns between assets
- Institutional Investors: Should conduct comprehensive due diligence on liquidity profiles, regulatory compliance frameworks, and alignment with investment mandates
⚠️ Risk Disclosure: The cryptocurrency market exhibits high volatility. This content does not constitute investment advice. Current market sentiment stands at 20 (Extreme Fear) on the Fear & Greed Index as of January 22, 2026. Investors should conduct independent research and consider consulting with qualified financial professionals before making investment decisions.
VII. FAQ
Q1: What are the main differences between AVA and SOL in terms of their core use cases?
AVA serves as a utility token for Travala.com's travel booking platform, providing payment discounts and rewards within a specific ecosystem focused on travel-related transactions. SOL, on the other hand, functions as the native token of a high-performance layer-1 blockchain protocol designed for broad-scale decentralized applications, supporting DeFi, NFTs, and smart contracts across multiple sectors. The fundamental distinction lies in AVA's niche application versus SOL's infrastructure-level positioning.
Q2: How do the liquidity levels of AVA and SOL compare, and why does this matter for investors?
SOL demonstrates significantly higher liquidity with a 24-hour trading volume of $102,590,615.02 compared to AVA's $25,615.49 as of January 22, 2026. This substantial difference matters because higher liquidity typically allows investors to enter and exit positions more easily without significantly impacting price, reduces slippage on larger trades, and generally indicates broader market participation and confidence in the asset.
Q3: Based on the price forecasts provided, which asset shows greater potential upside by 2031?
According to the baseline projections, SOL exhibits greater absolute price appreciation potential, with forecasts ranging from $177-$247 in the baseline scenario and up to $352 in optimistic scenarios by 2031. AVA's projections range from $0.31-$0.49 in baseline scenarios and up to $0.63 in optimistic scenarios. However, percentage-based returns should be calculated individually based on current entry prices, and higher potential returns typically correlate with higher risk levels.
Q4: What does the current Fear & Greed Index of 20 (Extreme Fear) indicate for potential investors in AVA or SOL?
The Fear & Greed Index reading of 20 indicates extreme fear in the cryptocurrency market as of January 22, 2026. Historically, such extreme fear conditions have sometimes presented accumulation opportunities for long-term investors, as assets may be undervalued due to panic selling. However, extreme fear can also signal legitimate concerns about market conditions, technological issues, or macroeconomic factors. Investors should conduct thorough analysis rather than relying solely on sentiment indicators when making allocation decisions.
Q5: Which asset is more suitable for conservative versus aggressive investors?
Conservative investors may find SOL's established infrastructure position, higher liquidity, and broader ecosystem adoption more aligned with risk-averse strategies, though all cryptocurrency investments carry substantial risk. Aggressive investors seeking higher risk-return profiles might consider AVA's niche positioning and lower market cap as offering greater percentage appreciation potential, albeit with correspondingly higher volatility and liquidity risks. Both investor types should ensure allocations align with overall portfolio risk management frameworks.
Q6: What are the primary risk factors that differentiate AVA from SOL?
AVA's primary risks center on its narrow use-case dependency on the travel booking sector and lower liquidity levels ($25,615.49 daily volume), which may limit exit options during market stress. SOL faces risks related to network infrastructure stability, broader market adoption challenges common to layer-1 platforms, and competition from other blockchain protocols. Both assets face regulatory uncertainty, though their different classifications (utility token versus infrastructure token) may result in varying regulatory treatments across jurisdictions.
Q7: How should investors approach diversification between AVA and SOL?
Diversification between AVA and SOL depends on individual investment objectives and risk tolerance. These assets represent different market segments—niche utility versus broad infrastructure—which may provide portfolio diversification benefits. However, both remain cryptocurrency assets subject to correlated market movements during systemic events. Investors should consider their correlation patterns, liquidity requirements, time horizons, and overall portfolio composition when determining appropriate allocation percentages. Professional financial consultation is recommended before making specific allocation decisions.
* The information is not intended to be and does not constitute financial advice or any other recommendation of any sort offered or endorsed by Gate.