Explore the investment potential of Berachain (BERA) vs TRON (TRX), two prominent cryptocurrencies with unique features. This article provides a detailed analysis of price trends, supply mechanisms, institutional adoption, and technical ecosystems, addressing the investment question: "Which is the better buy right now?" Designed for investors seeking to understand the nuances between a newer blockchain system with DeFi focus and an established entertainment platform, it offers insights into market risks, prediction analytics, and strategic investment advice. Optimize your portfolio with informed choices between these crypto assets.
Introduction: Investment Comparison between BERA and TRX
In the cryptocurrency market, the comparison between BERA vs TRX has always been an unavoidable topic for investors. The two not only have significant differences in market cap ranking, application scenarios, and price performance, but also represent different positions in crypto assets.
Berachain (BERA): Since its launch, it has gained market recognition for its high-performance EVM-Identical Layer1 blockchain utilizing Proof-of-Liquidity consensus.
TRON (TRX): Launched in 2017, it has been hailed as a decentralized platform for content entertainment, and is one of the cryptocurrencies with the highest global transaction volume and market capitalization.
This article will comprehensively analyze the investment value comparison between BERA vs TRX, focusing on historical price trends, supply mechanisms, institutional adoption, technical ecosystems, and future predictions, and attempt to answer the question investors care most about:
"Which is the better buy right now?"
I. Price History Comparison and Current Market Status
BERA and TRX Historical Price Trends
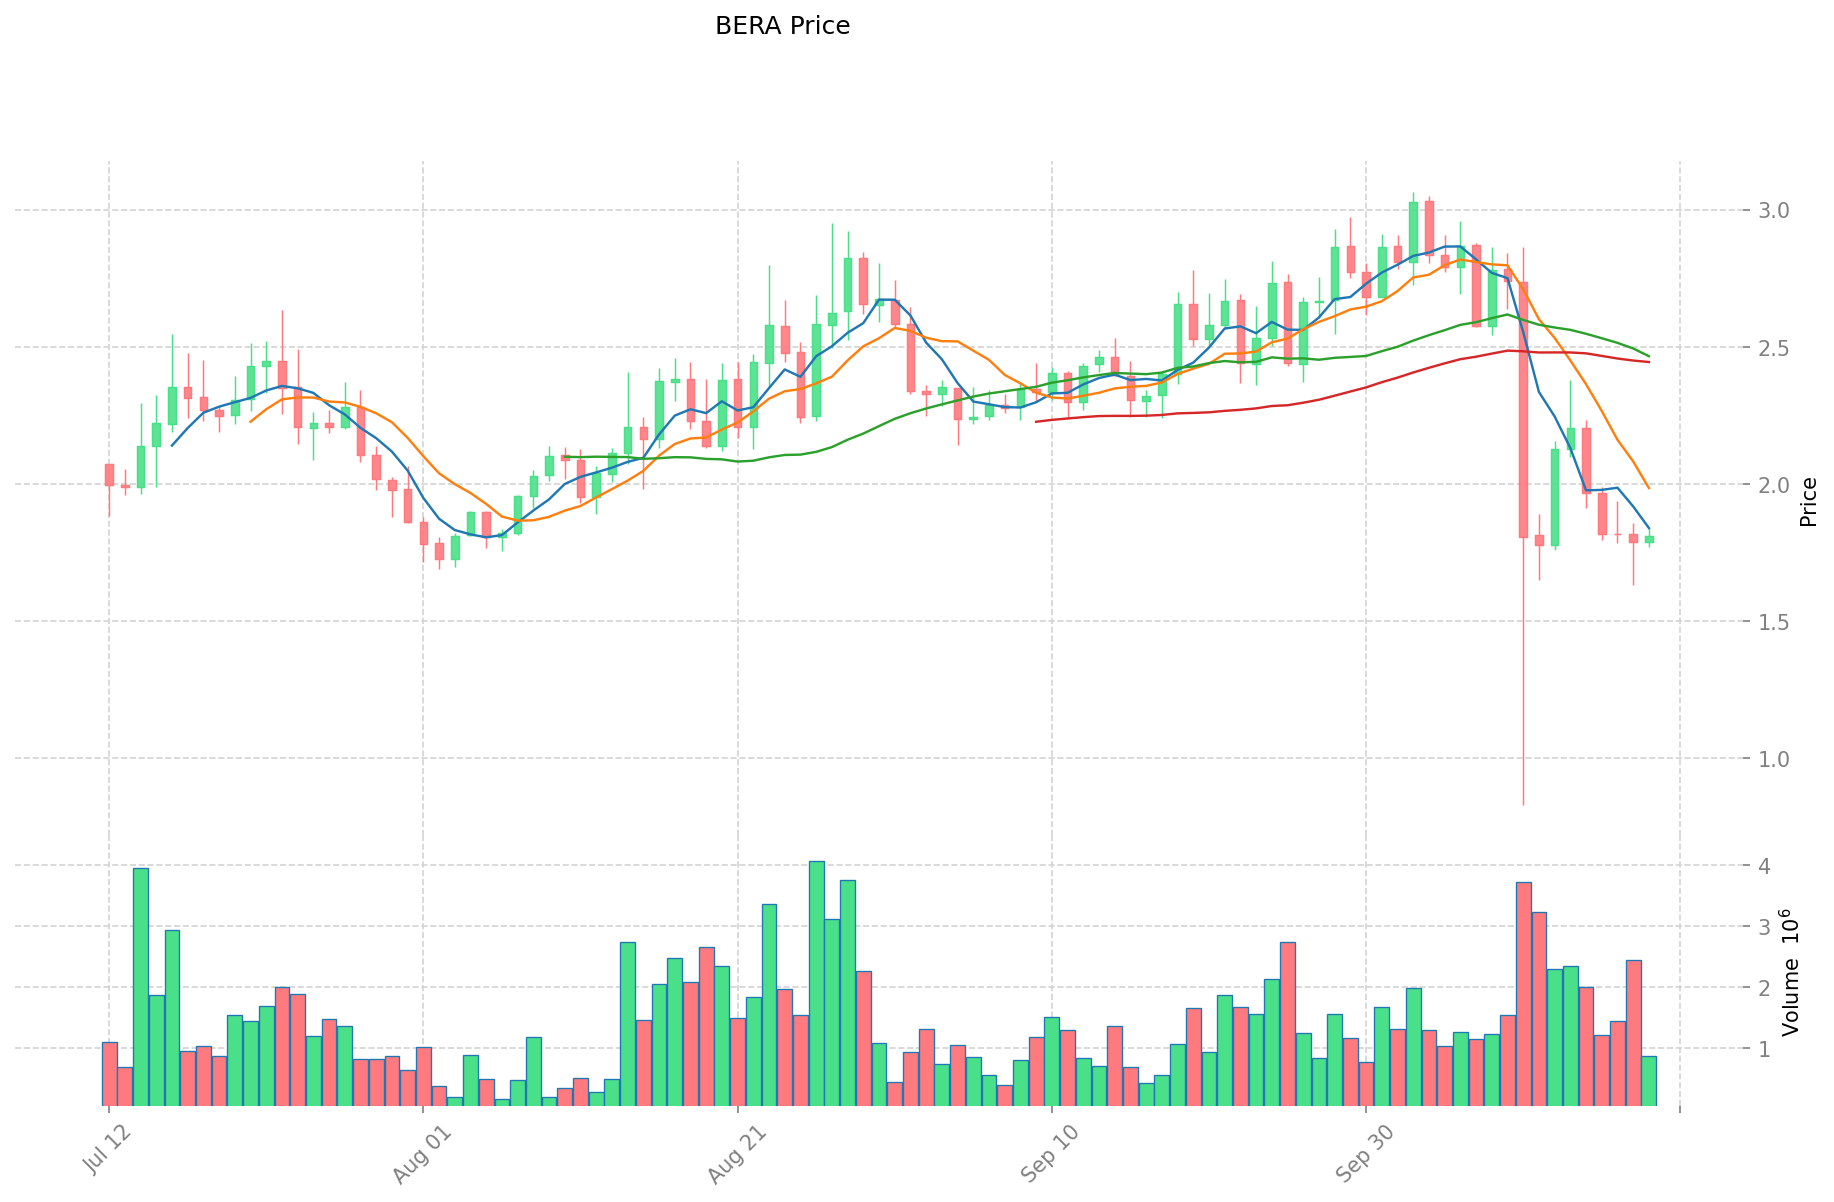
- 2025: BERA reached its all-time high of $15.2 on February 6, 2025, but later dropped to its all-time low of $0.8257 on October 10, 2025.
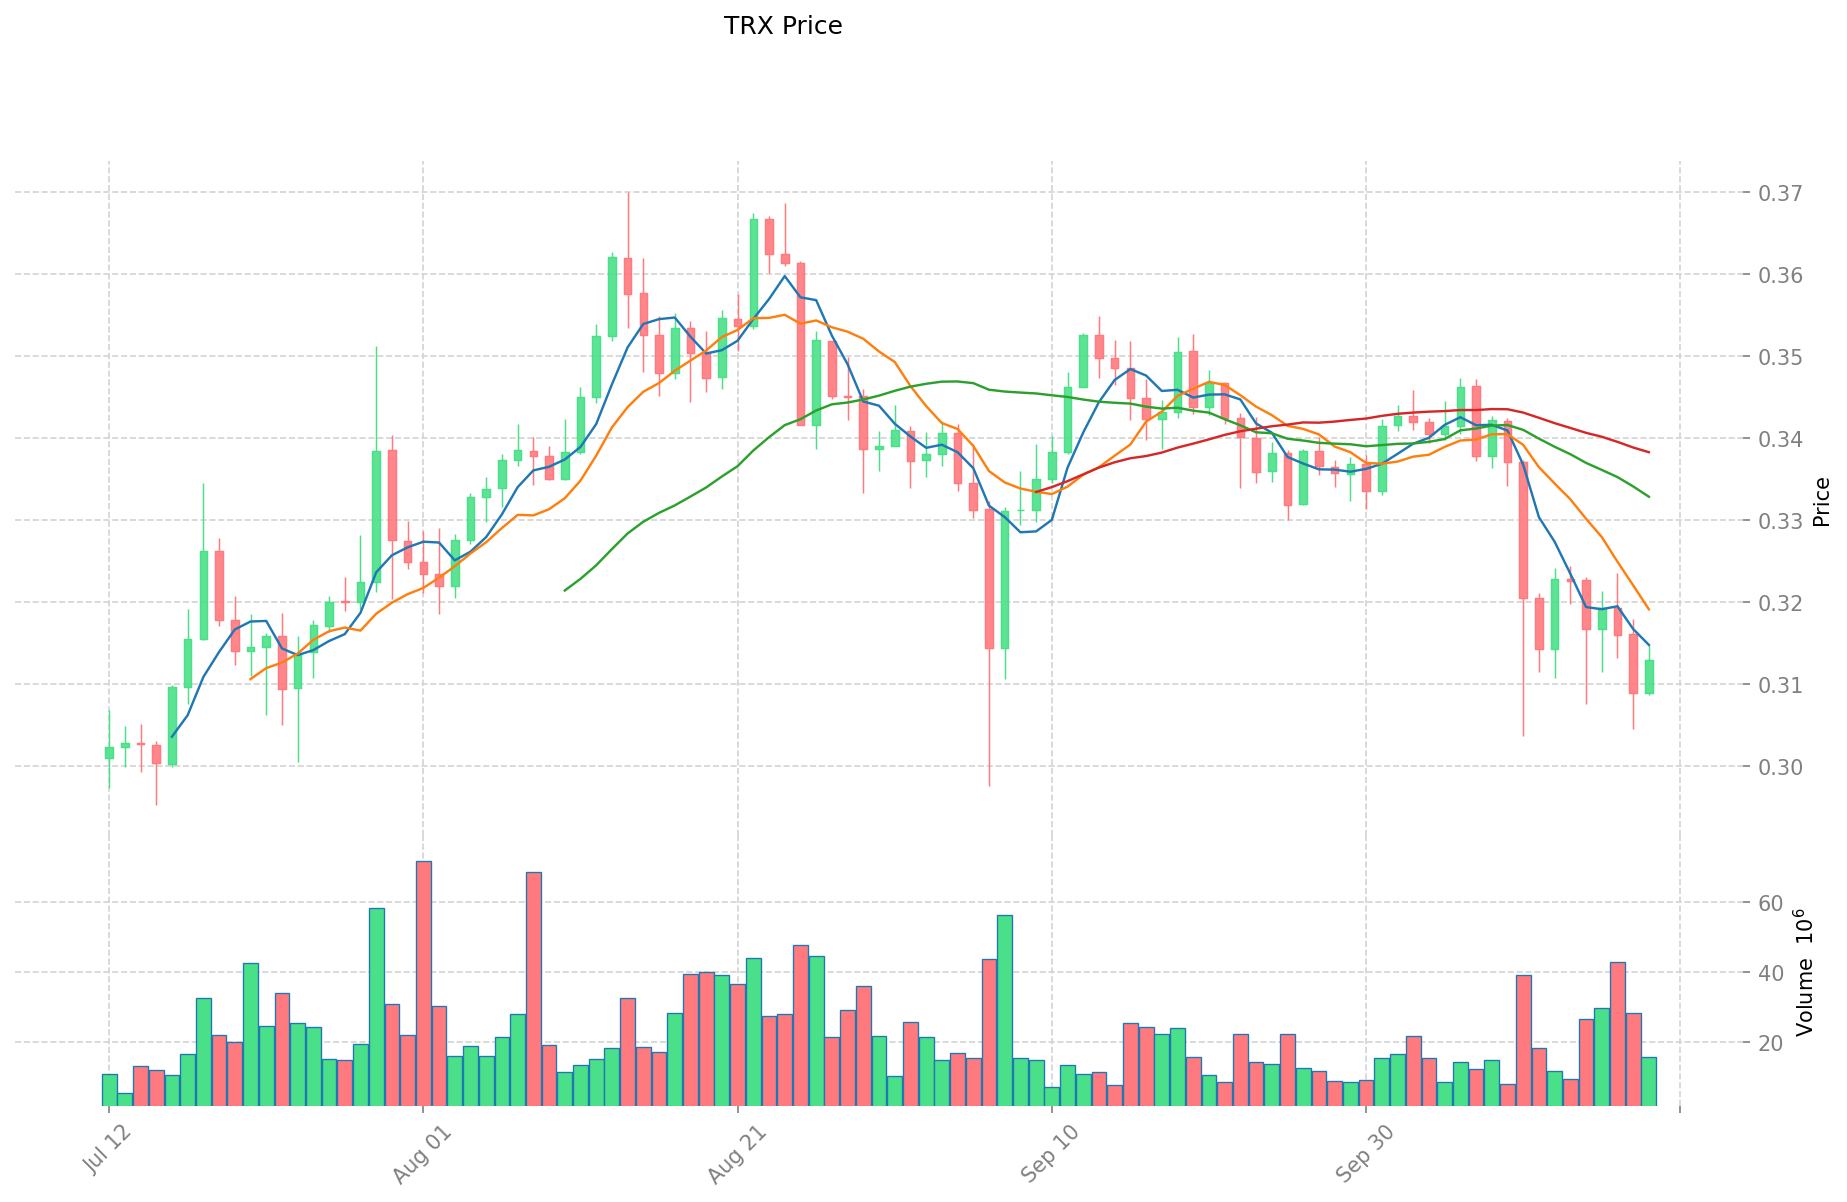
- 2024: TRX hit its all-time high of $0.431288 on December 4, 2024, showing significant growth from its previous levels.
- Comparative analysis: In the recent market cycle, BERA experienced a substantial decline from its peak of $15.2 to its low of $0.8257, while TRX has maintained a relatively stronger position, currently trading at $0.31307.
Current Market Situation (2025-10-19)
- BERA current price: $1.8067
- TRX current price: $0.31307
- 24-hour trading volume: BERA $1,585,470.56 vs TRX $4,900,372.14
- Market Sentiment Index (Fear & Greed Index): 23 (Extreme Fear)
Click to view real-time prices:
- View BERA current price Market Price
- View TRX current price Market Price
II. Core Factors Affecting the Investment Value of BERA vs TRX
Supply Mechanisms Comparison (Tokenomics)
- BERA: Fixed maximum supply of 10 billion BERA, with initial token distribution focused on the airdrop (8.5% of tokens), bear market investors (8.2%), and the Berachain Foundation (29.9%)
- TRX: Total supply of 89.3 billion TRX with an inflationary model based on block rewards for validators
- 📌 Historical pattern: Fixed supply tokens like BERA typically demonstrate higher price volatility and potential upside during bull markets compared to inflationary models like TRX's.
Institutional Adoption and Market Applications
- Institutional holdings: TRX has gained more institutional recognition over its longer history, while BERA is still in early adoption phases following its recent launch
- Enterprise adoption: TRX has established applications in gaming, entertainment, and USDD stablecoin ecosystem, whereas BERA focuses on DeFi applications and its Honey incentive system
- Regulatory attitudes: TRX has faced regulatory scrutiny in certain jurisdictions including the US, while BERA's regulatory status is still developing as a newer protocol
Technical Development and Ecosystem Building
- BERA technical development: Utilizes the Berachain Foundation's "proof-of-liquidity" consensus mechanism, combining EVM compatibility with novel validator incentive structures
- TRX technical development: Implements a delegated proof-of-stake consensus mechanism with a super representative governance system
- Ecosystem comparison: TRX has a mature ecosystem with diverse applications across DeFi, NFTs, and gaming, while BERA is establishing its ecosystem primarily in DeFi with its Honey liquidity incentive mechanism
Macroeconomic and Market Cycles
- Performance in inflationary environments: TRX has demonstrated resilience during previous market downturns due to its established use cases, while BERA's inflation resistance remains untested
- Macroeconomic monetary policies: Interest rate changes likely affect both assets similarly as speculative crypto investments
- Geopolitical factors: TRX has stronger adoption in Asian markets, particularly China, while BERA's geographic distribution is still developing
III. 2025-2030 Price Prediction: BERA vs TRX
Short-term Prediction (2025)
- BERA: Conservative $1.56 - $1.81 | Optimistic $1.81 - $2.01
- TRX: Conservative $0.23 - $0.31 | Optimistic $0.31 - $0.32
Mid-term Prediction (2027)
- BERA may enter a growth phase, with prices expected between $1.80 - $2.99
- TRX may enter a consolidation phase, with prices expected between $0.27 - $0.47
- Key drivers: Institutional capital inflow, ETF, ecosystem development
Long-term Prediction (2030)
- BERA: Base scenario $3.69 - $3.87 | Optimistic scenario $3.87 - $5.05
- TRX: Base scenario $0.64 - $0.68 | Optimistic scenario $0.68 - $0.78
View detailed price predictions for BERA and TRX
Disclaimer: This analysis is for informational purposes only and should not be considered as financial advice. Cryptocurrency markets are highly volatile and unpredictable. Always conduct your own research before making any investment decisions.
BERA:
| 年份 |
预测最高价 |
预测平均价格 |
预测最低价 |
涨跌幅 |
| 2025 |
2.007324 |
1.8084 |
1.555224 |
0 |
| 2026 |
2.7663999 |
1.907862 |
1.64076132 |
5 |
| 2027 |
2.991527616 |
2.33713095 |
1.7995908315 |
29 |
| 2028 |
3.88992075318 |
2.664329283 |
1.91831708376 |
47 |
| 2029 |
4.0964062726125 |
3.27712501809 |
1.966275010854 |
81 |
| 2030 |
5.050868934131212 |
3.68676564535125 |
3.207486111455587 |
104 |
TRX:
| 年份 |
预测最高价 |
预测平均价格 |
预测最低价 |
涨跌幅 |
| 2025 |
0.3223179 |
0.31293 |
0.2284389 |
0 |
| 2026 |
0.4732596855 |
0.31762395 |
0.2064555675 |
1 |
| 2027 |
0.4705757631225 |
0.39544181775 |
0.26890043607 |
26 |
| 2028 |
0.610542394515112 |
0.43300879043625 |
0.307436241209737 |
38 |
| 2029 |
0.756574609089737 |
0.521775592475681 |
0.427855985830058 |
66 |
| 2030 |
0.779793622954905 |
0.639175100782709 |
0.479381325587032 |
104 |
IV. Investment Strategy Comparison: BERA vs TRX
Long-term vs Short-term Investment Strategies
- BERA: Suitable for investors focused on DeFi potential and novel consensus mechanisms
- TRX: Suitable for investors seeking established ecosystems and wider market adoption
Risk Management and Asset Allocation
- Conservative investors: BERA: 20% vs TRX: 80%
- Aggressive investors: BERA: 60% vs TRX: 40%
- Hedging tools: Stablecoin allocation, options, cross-currency portfolios
V. Potential Risk Comparison
Market Risks
- BERA: Higher volatility due to newer market status and lower liquidity
- TRX: Exposure to broader market sentiment and established correlation patterns
Technical Risks
- BERA: Scalability, network stability, and unproven long-term performance of Proof-of-Liquidity
- TRX: Centralization concerns, potential security vulnerabilities in DPoS system
Regulatory Risks
- Global regulatory policies may impact both differently, with TRX facing more immediate scrutiny in some jurisdictions
VI. Conclusion: Which Is the Better Buy?
📌 Investment Value Summary:
- BERA advantages: Novel consensus mechanism, potential for high growth in DeFi sector
- TRX advantages: Established ecosystem, wider adoption, and proven resilience in market cycles
✅ Investment Advice:
- New investors: Consider a small allocation to BERA for potential growth, larger allocation to TRX for stability
- Experienced investors: Balanced portfolio with both assets, adjusting based on risk tolerance
- Institutional investors: Evaluate BERA for potential early-stage opportunities, maintain TRX for established market exposure
⚠️ Risk Warning: Cryptocurrency markets are highly volatile. This article does not constitute investment advice.
None
VII. FAQ
Q1: What are the main differences between BERA and TRX?
A: BERA is a newer cryptocurrency with a fixed supply of 10 billion tokens, focusing on DeFi applications and using a Proof-of-Liquidity consensus mechanism. TRX, launched in 2017, has an inflationary supply model, a more established ecosystem across various applications, and uses a Delegated Proof-of-Stake consensus mechanism.
Q2: Which cryptocurrency has shown better price performance recently?
A: As of October 19, 2025, TRX has shown relatively stronger price performance, trading at $0.31307, while BERA has experienced a significant decline from its all-time high of $15.2 to its current price of $1.8067.
Q3: How do the supply mechanisms of BERA and TRX differ?
A: BERA has a fixed maximum supply of 10 billion tokens, while TRX has an inflationary model with a total supply of 89.3 billion tokens that increases through block rewards for validators.
Q4: Which cryptocurrency is considered more suitable for long-term investment?
A: Both cryptocurrencies have potential for long-term investment, but they suit different investor profiles. BERA may be more suitable for investors focused on DeFi potential and novel consensus mechanisms, while TRX may be better for those seeking established ecosystems and wider market adoption.
Q5: What are the main risks associated with investing in BERA and TRX?
A: BERA faces higher volatility due to its newer market status and lower liquidity, as well as potential technical risks related to its unproven long-term performance. TRX faces regulatory scrutiny in some jurisdictions and potential centralization concerns with its DPoS system.
Q6: How do analysts predict the prices of BERA and TRX will change by 2030?
A: By 2030, analysts predict BERA could reach between $3.69 - $5.05 in optimistic scenarios, while TRX is expected to reach between $0.64 - $0.78. However, these predictions are speculative and subject to market conditions.
* The information is not intended to be and does not constitute financial advice or any other recommendation of any sort offered or endorsed by Gate.


