Explore the dynamic comparison between BRIC and QNT as emerging investment strategies in digital assets. This article analyzes key differences in price history, market positioning, and investment potential, addressing investor concerns about the preferable choice. Delve into core factors like tokenomics, technological ecosystems, and regulatory impacts. Comprehensive insights guide varied investment strategies for both short-term and long-term horizons, focusing on risk management and asset allocation. Ideal for investors seeking to understand the nuances of investing in AI-driven platforms vs. interoperability solutions in the cryptocurrency space.
Introduction: Investment Comparison between BRIC and QNT
In the cryptocurrency market, the comparison between Redbrick (BRIC) vs Quant (QNT) has always been an unavoidable topic for investors. The two not only have significant differences in market cap ranking, application scenarios, and price performance, but also represent different crypto asset positioning.
Redbrick (BRIC): Since its launch, it has gained market recognition for its AI-powered Web3 content platform that enables users to create, publish, and monetize games and applications.
Quant (QNT): Introduced in 2018, it has been hailed as a technology provider enabling trusted digital interaction, recognized for solving interoperability through its global blockchain operating system, Overledger.
This article will provide a comprehensive analysis of the investment value comparison between BRIC and QNT, focusing on historical price trends, supply mechanisms, institutional adoption, technological ecosystems, and future predictions, attempting to answer the question investors are most concerned about:
"Which is the better buy right now?"
I. Price History Comparison and Current Market Status
BRIC (Redbrick) and QNT (Quant) Historical Price Trends
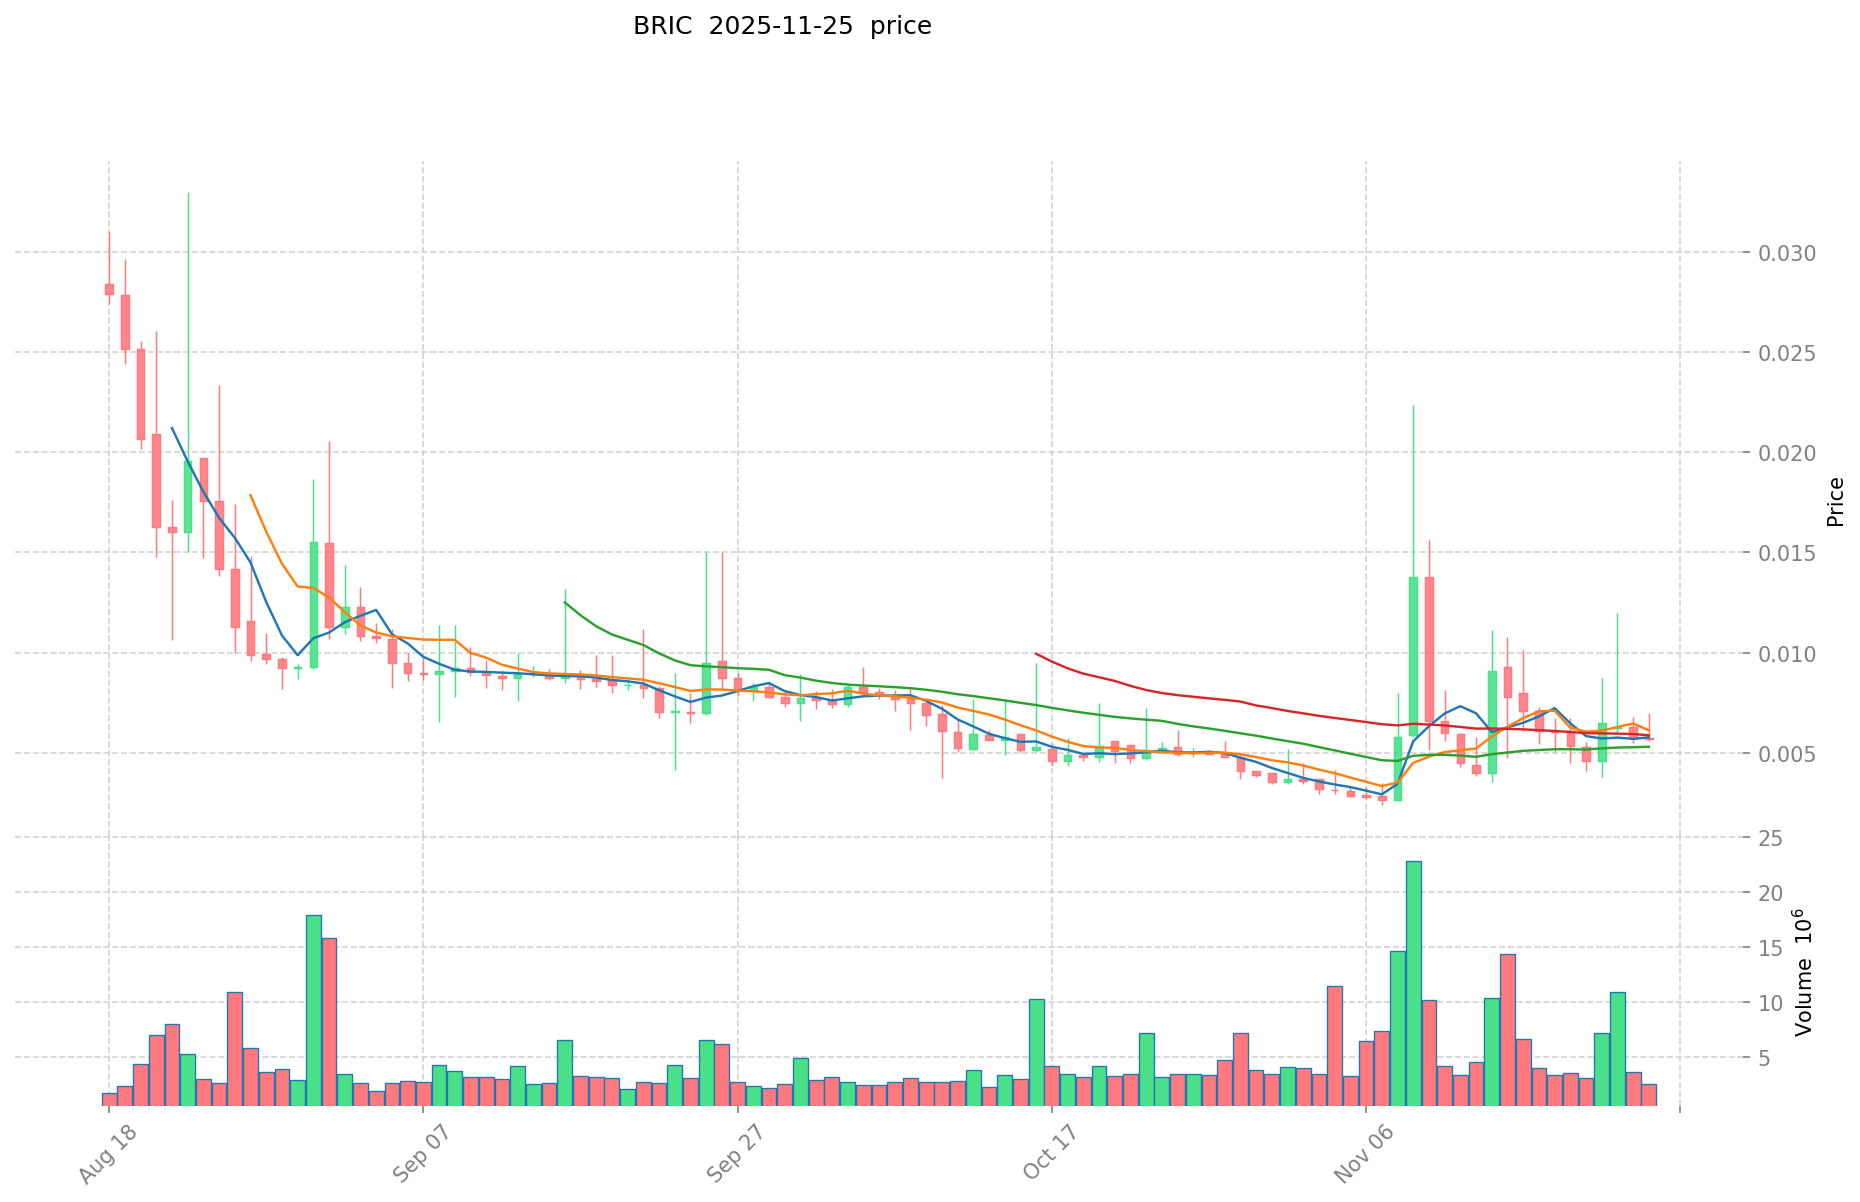
- 2025: BRIC reached its all-time high of $0.092295 on July 18, 2025.
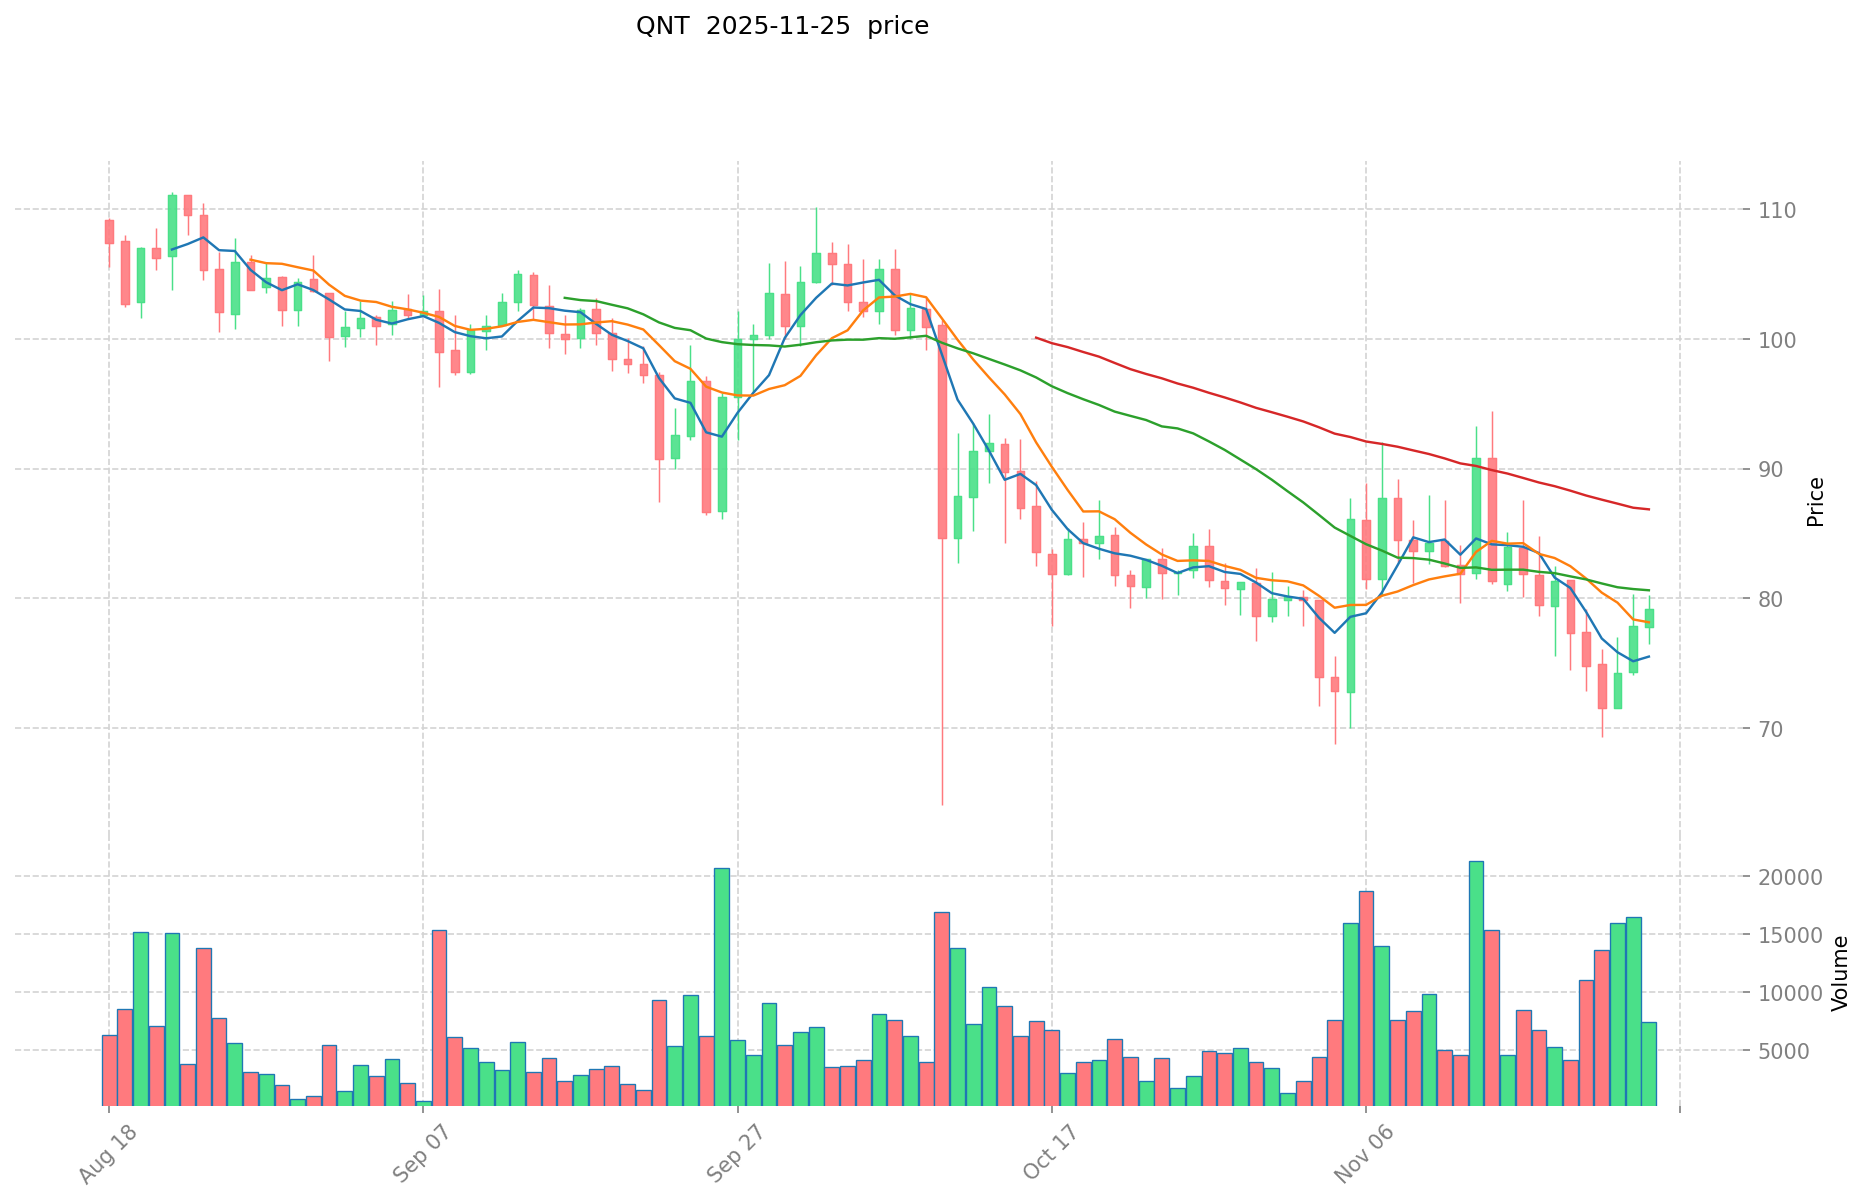
- 2025: QNT experienced significant price fluctuations, with its all-time high of $427.42 recorded on September 11, 2021.
- Comparative analysis: In the recent market cycle, BRIC dropped from its high of $0.092295 to a low of $0.002381, while QNT has shown more stability, currently trading at $80.41.
Current Market Situation (2025-11-25)
- BRIC current price: $0.005732
- QNT current price: $80.41
- 24-hour trading volume: BRIC $12,501.00 vs QNT $394,116.91
- Market Sentiment Index (Fear & Greed Index): 20 (Extreme Fear)
Click to view real-time prices:
- View BRIC current price Market Price
- View QNT current price Market Price
II. Core Factors Affecting BRIC vs QNT Investment Value
Supply Mechanism Comparison (Tokenomics)
- Quant (QNT): Forecast price prediction of $4,659.43, with potential to reach new highs of $13,253.36 by 2026
- BRIC: Limited information available in the provided materials
- 📌 Historical Pattern: Market cap ranking appears significant for value projection, with QNT currently ranked at 69
Institutional Adoption and Market Applications
- Institutional Holdings: Information not provided in the reference materials
- Enterprise Adoption: Limited information available in the provided references
- Regulatory Attitudes: No specific regulatory information provided in the materials
Technical Development and Ecosystem Building
- QNT Technical Development: Limited specific information provided
- BRIC Technical Development: No specific details available in the provided materials
- Ecosystem Comparison: Insufficient information available for comparison
Macroeconomic Factors and Market Cycles
- Performance During Inflation: Information not provided in the reference materials
- Macroeconomic Monetary Policies: No specific details available in the provided materials
- Geopolitical Factors: No information available in the provided references
III. 2025-2030 Price Prediction: BRIC vs QNT
Short-term Forecast (2025)
- BRIC: Conservative $0.00550272 - $0.005732 | Optimistic $0.005732 - $0.00739428
- QNT: Conservative $52.234 - $80.36 | Optimistic $80.36 - $117.3256
Mid-term Forecast (2027)
- BRIC may enter a growth phase, with expected price range of $0.00544412463 - $0.011121568887
- QNT may enter a steady growth phase, with expected price range of $92.01276252 - $129.02939112
- Key drivers: Institutional capital inflow, ETF, ecosystem development
Long-term Forecast (2030)
- BRIC: Base scenario $0.01365681023233 - $0.01488592315324 | Optimistic scenario $0.01488592315324+
- QNT: Base scenario $150.172443281952 - $160.68451431168864 | Optimistic scenario $160.68451431168864+
View detailed price predictions for BRIC and QNT
Disclaimer: This forecast is for informational purposes only and should not be considered as financial advice. Cryptocurrency markets are highly volatile and unpredictable. Always conduct your own research before making any investment decisions.
BRIC:
| 年份 |
预测最高价 |
预测平均价格 |
预测最低价 |
涨跌幅 |
| 2025 |
0.00739428 |
0.005732 |
0.00550272 |
0 |
| 2026 |
0.0089915018 |
0.00656314 |
0.0046598294 |
14 |
| 2027 |
0.011121568887 |
0.0077773209 |
0.00544412463 |
35 |
| 2028 |
0.012756750606225 |
0.0094494448935 |
0.005575172487165 |
64 |
| 2029 |
0.016210522714799 |
0.011103097749862 |
0.00965969504238 |
93 |
| 2030 |
0.01488592315324 |
0.01365681023233 |
0.011881424902127 |
138 |
QNT:
| 年份 |
预测最高价 |
预测平均价格 |
预测最低价 |
涨跌幅 |
| 2025 |
117.3256 |
80.36 |
52.234 |
0 |
| 2026 |
112.680792 |
98.8428 |
54.36354 |
23 |
| 2027 |
129.02939112 |
105.761796 |
92.01276252 |
32 |
| 2028 |
171.3975665976 |
117.39559356 |
63.3936205224 |
47 |
| 2029 |
155.948306485104 |
144.3965800788 |
98.189674453584 |
81 |
| 2030 |
160.68451431168864 |
150.172443281952 |
111.12760802864448 |
88 |
IV. Investment Strategy Comparison: BRIC vs QNT
Long-term vs Short-term Investment Strategies
- BRIC: Suitable for investors focused on AI-powered Web3 content platforms and ecosystem potential
- QNT: Suitable for investors seeking interoperability solutions and blockchain operating systems
Risk Management and Asset Allocation
- Conservative investors: BRIC: 20% vs QNT: 80%
- Aggressive investors: BRIC: 40% vs QNT: 60%
- Hedging tools: Stablecoin allocation, options, cross-currency combinations
V. Potential Risk Comparison
Market Risks
- BRIC: Higher volatility, lower market cap, and potentially less liquidity
- QNT: Market sentiment changes, competition in the interoperability sector
Technical Risks
- BRIC: Scalability, network stability
- QNT: Centralization concerns, potential security vulnerabilities
Regulatory Risks
- Global regulatory policies may have different impacts on both tokens
VI. Conclusion: Which Is the Better Buy?
📌 Investment Value Summary:
- BRIC advantages: AI-powered Web3 content platform, potential for growth in the gaming and application sector
- QNT advantages: Established interoperability solution, higher market cap, more stable price history
✅ Investment Advice:
- New investors: Consider a smaller allocation to BRIC due to higher volatility, larger allocation to QNT for stability
- Experienced investors: Balanced approach, potentially higher allocation to BRIC for growth potential
- Institutional investors: Focus on QNT for its established position and potential for enterprise adoption
⚠️ Risk Warning: The cryptocurrency market is highly volatile. This article does not constitute investment advice.
None
VII. FAQ
Q1: What are the main differences between BRIC and QNT?
A: BRIC is an AI-powered Web3 content platform focused on gaming and applications, while QNT is a blockchain interoperability solution. BRIC has a lower market cap and higher volatility, whereas QNT has a higher market cap and more price stability.
Q2: Which token has shown better price performance historically?
A: QNT has demonstrated better historical price performance, reaching an all-time high of $427.42 in September 2021. BRIC's all-time high was $0.092295 in July 2025, but it has experienced more significant price drops since then.
Q3: What are the price predictions for BRIC and QNT by 2030?
A: By 2030, BRIC is predicted to reach a base scenario of $0.01365681023233 - $0.01488592315324, with an optimistic scenario above $0.01488592315324. QNT is forecasted to reach a base scenario of $150.172443281952 - $160.68451431168864, with an optimistic scenario above $160.68451431168864.
Q4: How should investors allocate their portfolio between BRIC and QNT?
A: Conservative investors might consider allocating 20% to BRIC and 80% to QNT, while aggressive investors could allocate 40% to BRIC and 60% to QNT. The exact allocation should depend on individual risk tolerance and investment goals.
Q5: What are the main risks associated with investing in BRIC and QNT?
A: For BRIC, the main risks include higher volatility, lower market cap, and potential liquidity issues. For QNT, risks include market sentiment changes and competition in the interoperability sector. Both face technical risks such as scalability and security vulnerabilities, as well as potential regulatory risks.
Q6: Which token is better suited for long-term investment?
A: QNT may be better suited for long-term investment due to its more established position, higher market cap, and more stable price history. However, BRIC could offer higher growth potential for investors willing to take on more risk.
* The information is not intended to be and does not constitute financial advice or any other recommendation of any sort offered or endorsed by Gate.


