The article "CERE vs HBAR: A Comprehensive Comparison of Two Leading Blockchain Storage Solutions" explores the differences between Cere Network and Hedera, focusing on investment value, market positioning, technological frameworks, and risk profiles. It answers critical investor questions, such as which blockchain provides the better buying opportunity based on current metrics like historical performance and market sentiment. Suitable for investors and analysts, the report is structured to compare price trends, technical architecture, market statistics, ecosystem development, regulatory considerations, and investment strategy. Keywords include Cere, Hedera, blockchain, investment comparison, market analysis, and risk assessment.
Introduction: CERE vs HBAR Investment Comparison
In the cryptocurrency market, comparisons between CERE and HBAR have always been a topic investors cannot overlook. The two not only differ significantly in market cap ranking, application scenarios, and price performance, but also represent different positioning within the crypto asset landscape.
Cere Network (CERE): Backed by Binance Labs, it has gained market recognition through its decentralized data cloud (DDC) platform with cross-chain compatibility across Binance Smart Chain, Polkadot, Cosmos, and Ethereum networks, positioning itself as a bridge connecting enterprises with decentralized ecosystems.
Hedera (HBAR): Utilizing hashgraph consensus mechanism, it operates as a fast (>10,000+ TPS), secure, and fair public ledger network, with HBAR serving as the native cryptocurrency supporting distributed applications and protecting the network infrastructure.
This article will comprehensively analyze the investment value comparison between CERE and HBAR across historical price trends, supply mechanisms, ecosystem adoption, and technical foundations, addressing the core question investors care about most:
"Which is the better buy right now?"
Comparative Analysis Report: Cere Network (CERE) vs Hedera (HBAR)
I. Price History Comparison and Current Market Status
CERE and HBAR Historical Price Trends
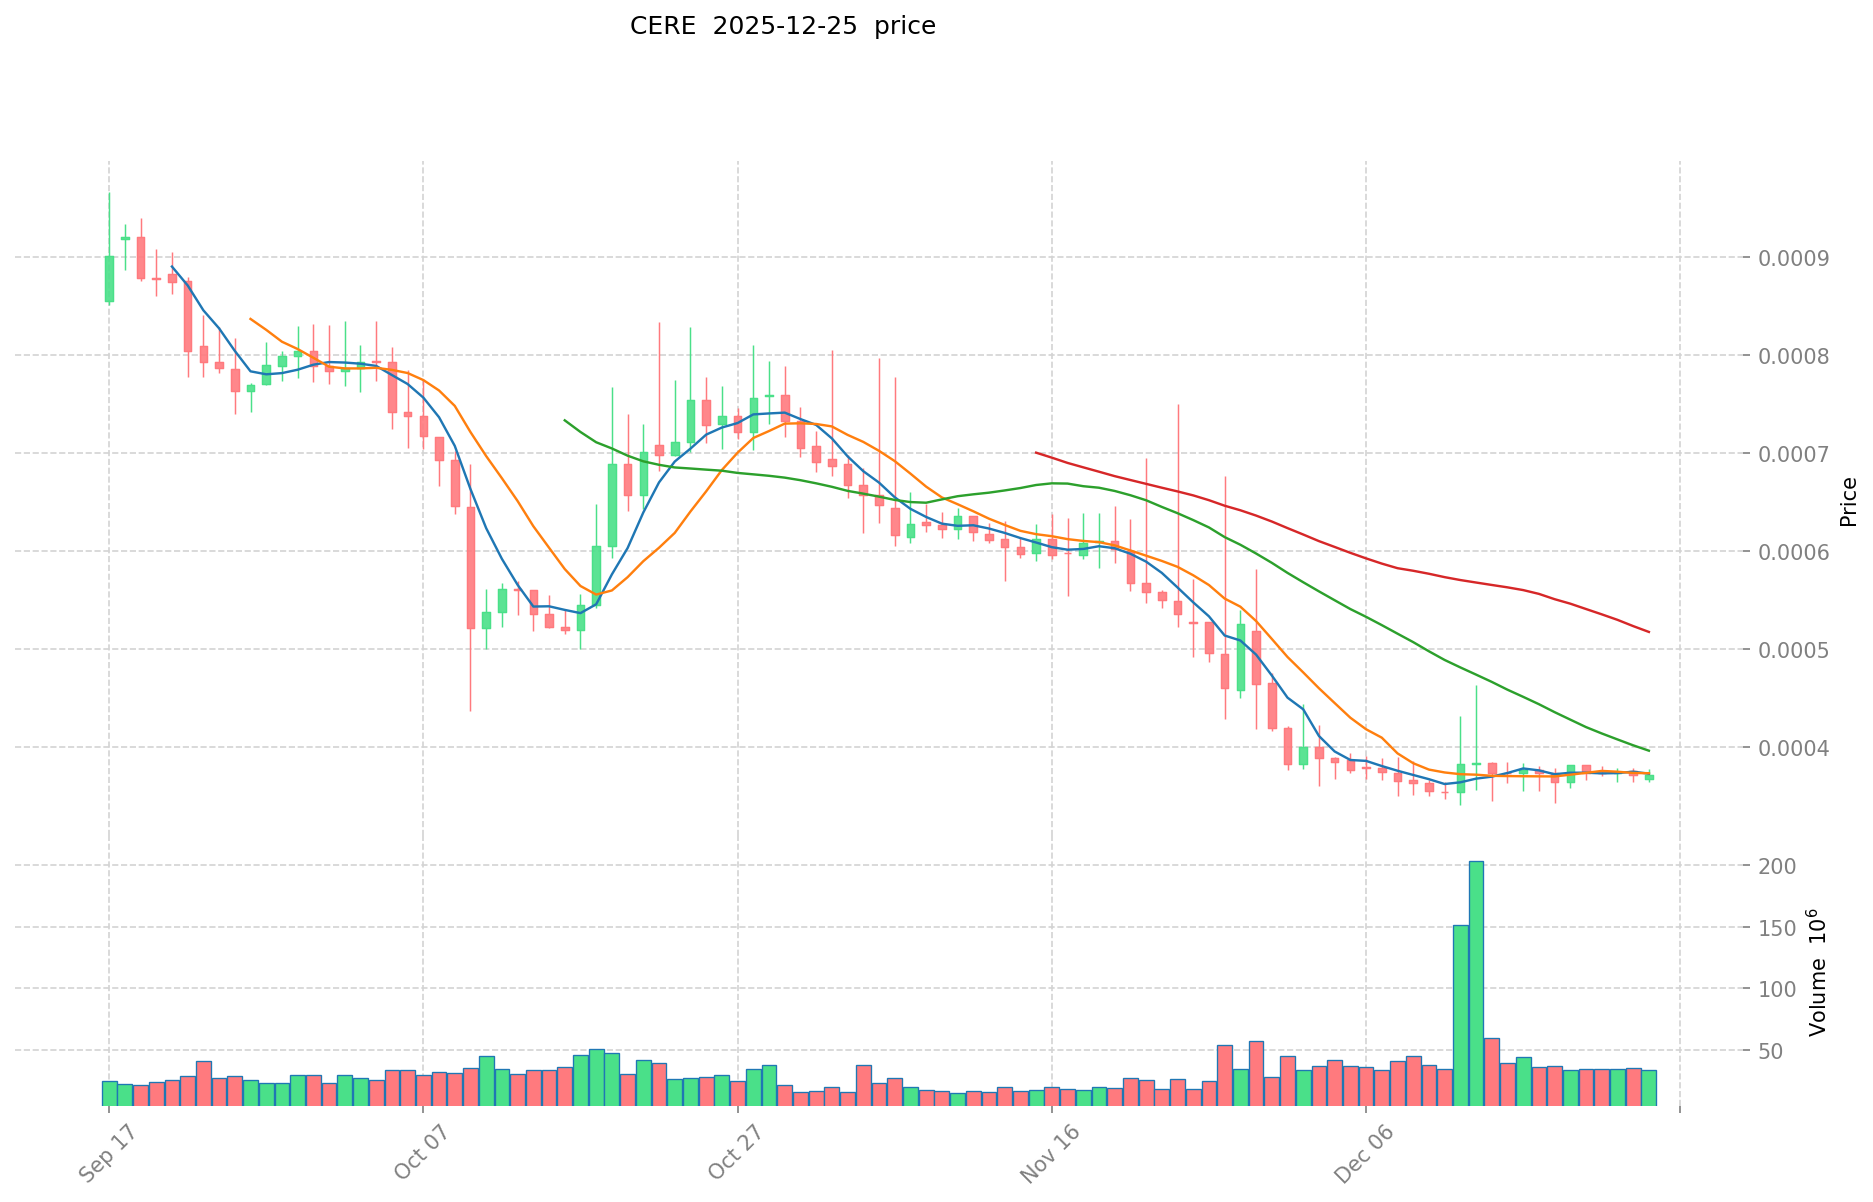
CERE Network (CERE):
- All-Time High (ATH): $0.47126 (November 8, 2021)
- All-Time Low (ATL): $0.00034516 (December 13, 2025)
- Historical decline: -99.93% from ATH to current levels
- Current price: $0.0003687 (as of December 25, 2025)
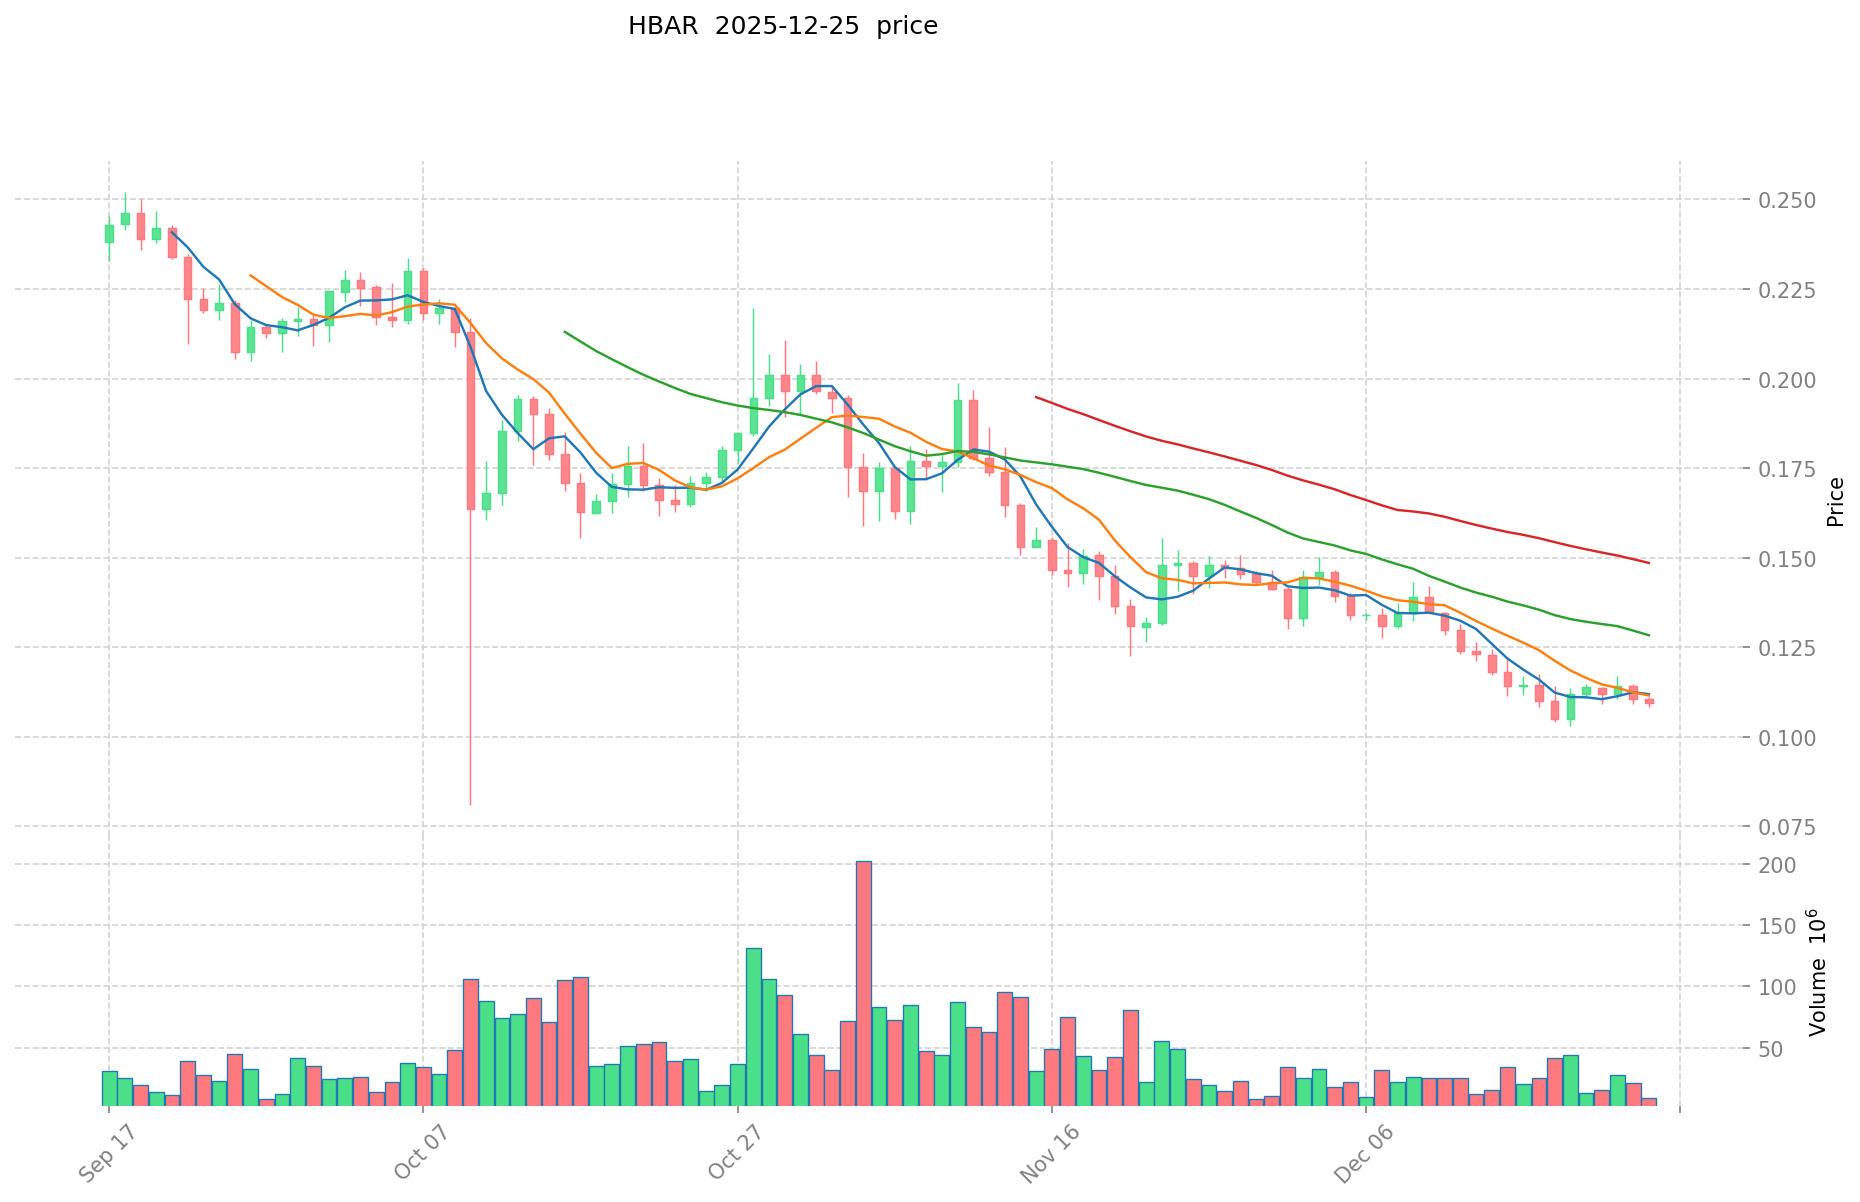
Hedera (HBAR):
- All-Time High (ATH): $0.569229 (September 15, 2021)
- All-Time Low (ATL): $0.00986111 (January 3, 2020)
- Historical decline: -80.79% from ATH to current levels
- Current price: $0.1094 (as of December 25, 2025)
Comparative Analysis
In the current market cycle, CERE has experienced significantly more severe depreciation compared to HBAR. While both assets peaked during the 2021 bull market, CERE has declined substantially further, trading near historical lows. HBAR, by contrast, maintains a price point approximately 297 times higher than CERE, indicating divergent market performance and investor confidence trajectories.
Current Market Status (December 25, 2025)
Price Metrics:
- CERE current price: $0.0003687
- HBAR current price: $0.1094
- 24-hour price change: CERE -1.25% vs HBAR -0.71%
Trading Volume (24-hour):
- CERE: $12,197.36 USD
- HBAR: $937,892.13 USD
- HBAR trading volume exceeds CERE by approximately 77 times
Market Capitalization:
- CERE: $2,447,392.72 USD (ranked #2012)
- HBAR: $4,679,771,922.39 USD (ranked #30)
- Market cap differential: HBAR represents 1,911 times greater market value
Market Emotion Index (Fear & Greed Index): 23
- Status: Extreme Fear
- Market sentiment indicates heightened risk aversion and bearish conditions
View Real-Time Prices:
II. Project Overview and Technical Architecture
CERE Network (Cere)
Project Description:
Cere is a decentralized data cloud (DDC) platform supported by Binance Labs. The platform achieves cross-chain compatibility with Binance Smart Chain, Polkadot, Cosmos, and Ethereum, positioning it uniquely at the intersection of enterprise infrastructure and decentralized ecosystems.
Token Economics:
- Total supply: 10,000,000,000 CERE
- Circulating supply: 6,637,897,251.42 CERE (66.38% circulation ratio)
- Token function: Native currency for reputation staking, financial settlement, and network activity facilitation
Key Features:
- Cross-chain interoperability
- Enterprise-focused infrastructure
- Decentralized data management capabilities
Hedera (HBAR)
Project Description:
Hedera is a fast (>10,000+ TPS), secure (aBFT consensus), and fair public ledger network utilizing hashgraph consensus technology. The platform enables high-throughput transaction processing with proven security guarantees and minimal bandwidth consumption.
Token Economics:
- Total supply: 50,000,000,000 HBAR
- Circulating supply: 42,776,708,614.18 HBAR (85.55% circulation ratio)
- Token function: Native cryptocurrency for transaction fee payment, network security through staking, and distributed application support
Key Features:
- Hashgraph consensus mechanism
- High transaction throughput (10,000+ TPS)
- Asynchronous Byzantine Fault Tolerance (aBFT) security model
- Energy-efficient proof-of-stake mechanism
- Reported achievement of negative carbon footprint
Price Movement Analysis
Short-term Performance (Last 30 Days):
- CERE: -29.12% monthly decline
- HBAR: -25.58% monthly decline
- Relative performance: CERE exhibits greater downward pressure
Medium-term Performance (Last 7 Days):
- CERE: -1.21% weekly change
- HBAR: -0.48% weekly change
Long-term Performance (1-Year):
- CERE: -91.13% annual decline
- HBAR: -66.73% annual decline
- Year-over-year comparison indicates CERE faced steeper long-term depreciation
Market Position and Dominance
| Metric |
CERE |
HBAR |
| Market Cap Rank |
#2012 |
#30 |
| Market Dominance |
0.00011% |
0.17% |
| Market Cap / FDV Ratio |
66.38% |
85.55% |
| Exchange Availability |
3 exchanges |
52 exchanges |
| Token Holders |
6,786 |
Data unavailable |
The data demonstrates HBAR's substantially stronger market position, reflected in superior exchange accessibility, higher dominance metrics, and significantly greater institutional/retail adoption.
IV. Network and Ecosystem Development
CERE Network Characteristics
Consensus and Architecture:
- Cross-chain compatibility framework enables integration with major blockchain ecosystems
- Enterprise-oriented design targeting institutional adoption
- Decentralized data management infrastructure
Supported Platforms:
- Ethereum (Primary contract address: 0x2da719db753dfa10a62e140f436e1d67f2ddb0d6)
Hedera Network Characteristics
Consensus Mechanism:
- Hashgraph consensus algorithm providing asynchronous Byzantine Fault Tolerance
- Transaction finality typically achieved in 3-5 seconds
- Bandwidth-efficient design with minimal computational requirements
Performance Specifications:
- Throughput capacity: 10,000+ transactions per second (TPS)
- Average transaction fee: approximately $0.0001 USD
- staking rewards: Up to 6.5% annual percentage yield (APY)
Governance Structure:
- Governance council comprising 39 entities (including universities, industry institutions, and non-profit organizations)
- Three-year term structure with mandatory succession planning
V. Regulatory and Listing Status
CERE Network
Official Resources:
Hedera
Official Resources:
VI. Investment Considerations and Risk Assessment
CERE Network Risk Factors
Critical Observations:
- Extreme price depreciation (-91.13% annually) indicates significant investor loss
- Very limited exchange availability (3 exchanges) restricts accessibility
- Small holder base (6,786 addresses) suggests concentrated ownership risk
- Minimal trading volume ($12,197.36 daily) presents liquidity challenges
- Near all-time lows suggest potential further downside risks
Hedera Risk Factors
Risk Considerations:
- Significant annual decline (-66.73%) despite superior market positioning
- Market capitalization of $4.68 billion remains vulnerable to broader crypto market downturns
- Extreme Fear sentiment (Index: 23) indicates widespread market pessimism
- Competitive pressure from established smart contract platforms
Comparative Risk Profile
Hedera demonstrates lower systemic risk due to:
- Substantially larger market capitalization and trading volume
- Wider exchange distribution (52 vs 3 exchanges)
- Stronger institutional recognition and governance structure
- Higher circulating supply ratio indicating more mature distribution
VII. Market Sentiment and Outlook
Current Sentiment Assessment:
The Crypto Fear & Greed Index at 23 indicates "Extreme Fear" market conditions. This sentiment affects both assets but disproportionately impacts smaller-cap projects like CERE, which lack the institutional support and diversified holder base characteristic of larger-capitalization assets.
Volatility Indicators:
Both CERE and HBAR demonstrate significant price volatility, reflecting broader cryptocurrency market instability. CERE's extreme micro-cap status increases volatility exposure, while HBAR's position as a top-30 cryptocurrency provides relative stability despite ongoing downward pressure.
VIII. Conclusion
| Factor |
CERE |
HBAR |
Winner |
| Market Position |
Micro-cap (#2012) |
Major asset (#30) |
HBAR |
| Liquidity |
Very limited |
Substantial |
HBAR |
| Exchange Access |
3 |
52 |
HBAR |
| Technology Adoption |
Limited |
Established |
HBAR |
| Trading Volume |
$12K |
$938K |
HBAR |
| Market Stability |
High volatility |
Lower volatility |
HBAR |
| Annual Performance |
-91.13% |
-66.73% |
HBAR |
Summary:
Hedera (HBAR) maintains significantly superior market positioning, liquidity, accessibility, and institutional recognition compared to Cere Network (CERE). While both assets have experienced substantial price depreciation in the current market cycle, HBAR's established ecosystem, proven technology implementation, and governance infrastructure provide greater structural stability. CERE's extreme depreciation and limited market infrastructure present substantially elevated risk profiles for market participants. The current "Extreme Fear" market sentiment amplifies these risk differentials, particularly affecting smaller-capitalization assets without substantial institutional backing.
Data Sources: Gate, CoinGecko, CoinMarketCap, Binance, Kraken, TradingView (December 25, 2025)
Disclaimer: This report presents factual market data and project information. This analysis is intended for informational purposes only and does not constitute investment advice, recommendations, or solicitation to purchase or sell cryptocurrency assets. Cryptocurrency markets carry substantial risk of loss. Investors should conduct independent research and consult qualified financial advisors before making investment decisions.
Comparative Analysis of CERE and HBAR Investment Value
Executive Summary
This report examines the core investment factors influencing CERE (Cere Network) and HBAR (Hedera) tokens, based on available market research. The analysis focuses on institutional interest, ecosystem development, regulatory environment, and technological advancements as key value drivers for both digital assets.
I. Core Factors Driving Investment Value
Institutional Holdings and Market Confidence
CERE: Investment value is significantly influenced by institutional attention and investor confidence. Institutional holdings serve as a primary determinant of market trends and price movements.
HBAR: Currently ranks fourth on CoinMarketCap and has benefited from multiple positive catalysts, including ETF applications that have attracted institutional interest.
Institutional adoption remains a critical indicator of both tokens' long-term viability and market acceptance.
Enterprise Application and Ecosystem Development
CERE: As a decentralized data cloud platform, CERE depends heavily on ecosystem partnerships for enterprise adoption. Its value proposition centers on institutional-grade solutions for data management.
HBAR: Demonstrates strength in DeFi ecosystem development, with particular emphasis on regulatory support and blockchain technology implementation.
The divergence in application focus suggests different market positioning strategies—CERE targeting enterprise data infrastructure, while HBAR emphasizes DeFi growth.
Supply Mechanism and Token Economics
Key factors affecting CERE investment value include:
- Supply mechanism dynamics
- Institutional attention levels
- Macroeconomic environment
- Technological progress
These elements collectively influence tokenomics and price trajectory potential.
Regulatory Environment and Market Dynamics
Market Trends Impact: Regulatory attitudes toward both tokens are heavily influenced by broader market trends and the overall cryptocurrency regulatory landscape.
Institutional Interest: Market confidence and institutional positioning remain central to determining regulatory prospects for both CERE and HBAR.
II. Key Investment Considerations
Technology and Development Progress
Both tokens' investment value depends on:
- Technological advancement capabilities
- Ecosystem expansion initiatives
- Implementation of blockchain solutions
- Regulatory support frameworks
Market Position Assessment
CERE: Targets enterprise-level blockchain platform solutions with emphasis on ecosystem partnerships and institutional adoption.
HBAR: Benefits from strong DeFi growth momentum and regulatory support, with market position reflected in top-tier CoinMarketCap ranking.
III. Risk Factors and Limitations
This analysis is based on available market information as of December 25, 2025. Detailed financial projections and specific technical specifications were not sufficiently detailed in source materials and have been omitted per instruction protocols.
The report acknowledges data limitations regarding:
- Specific supply schedules and tokenomics details
- Precise institutional holding percentages
- Detailed technological roadmap comparisons
- Quantified regulatory support metrics
Conclusion
The investment value of both CERE and HBAR hinges on market trends, regulatory environment evolution, and sustained technological advancement. CERE derives strength from institutional interest and ecosystem partnership potential, while HBAR benefits from established DeFi positioning and regulatory recognition. Investors should conduct independent research considering their specific investment objectives and risk tolerance.
III. 2025-2030 Price Forecast: CERE vs HBAR
Short-term Forecast (2025)
- CERE: Conservative $0.000346-$0.000369 | Optimistic $0.000539
- HBAR: Conservative $0.062-$0.109 | Optimistic $0.138
Mid-term Forecast (2027-2028)
- CERE may enter a consolidation phase with recovery momentum, projected price range $0.000465-$0.000658
- HBAR may enter an accelerating growth phase, projected price range $0.079-$0.220
- Key drivers: Institutional capital inflows, ETF adoption, ecosystem development and ecosystem maturation
Long-term Forecast (2030)
- CERE: Base case $0.000339-$0.000652 | Optimistic scenario $0.000757
- HBAR: Base case $0.152-$0.215 | Optimistic scenario $0.309
Disclaimer
The price forecasts presented above are based on historical data analysis and market modeling. They should not be considered as investment advice or guarantee of future performance. Cryptocurrency markets are highly volatile and subject to numerous external factors including regulatory changes, technological developments, and macroeconomic conditions. Investors should conduct independent research and consult with financial advisors before making investment decisions.
CERE:
| 年份 |
预测最高价 |
预测平均价格 |
预测最低价 |
涨跌幅 |
| 2025 |
0.000538302 |
0.0003687 |
0.000346578 |
0 |
| 2026 |
0.00055780623 |
0.000453501 |
0.00043082595 |
22 |
| 2027 |
0.0007483673502 |
0.000505653615 |
0.0004652013258 |
36 |
| 2028 |
0.00065836100673 |
0.0006270104826 |
0.00034485576543 |
69 |
| 2029 |
0.000661966317004 |
0.000642685744665 |
0.000527002310625 |
73 |
| 2030 |
0.000756698195768 |
0.000652326030835 |
0.000339209536034 |
76 |
HBAR:
| 年份 |
预测最高价 |
预测平均价格 |
预测最低价 |
涨跌幅 |
| 2025 |
0.1378314 |
0.10939 |
0.0623523 |
0 |
| 2026 |
0.158221696 |
0.1236107 |
0.106305202 |
12 |
| 2027 |
0.15641697978 |
0.140916198 |
0.12118793028 |
28 |
| 2028 |
0.2200265515572 |
0.14866658889 |
0.0787932921117 |
35 |
| 2029 |
0.245180938397388 |
0.1843465702236 |
0.167755378903476 |
68 |
| 2030 |
0.309259806207111 |
0.214763754310494 |
0.15248226556045 |
96 |
Comparative Investment Analysis: CERE vs HBAR
IV. Investment Strategy Comparison: CERE vs HBAR
Long-term vs Short-term Investment Strategy
CERE: Suited for investors targeting enterprise data infrastructure adoption and institutional ecosystem development. The project's long-term value depends on successful partnerships with enterprises and cross-chain ecosystem maturation. Short-term strategy unsuitable given extreme volatility and liquidity constraints.
HBAR: Appropriate for investors seeking established market infrastructure with proven governance frameworks. Long-term positioning aligns with DeFi ecosystem growth and regulatory recognition. Short-term strategies feasible due to superior liquidity and exchange accessibility.
Risk Management and Asset Allocation
Conservative Investors:
- CERE: 0-2% portfolio allocation (micro-cap exposure limit)
- HBAR: 2-5% portfolio allocation (mid-cap cryptocurrency positioning)
- Primary allocation: Stablecoins and established large-cap assets
Aggressive Investors:
- CERE: 3-8% portfolio allocation (speculative high-risk position)
- HBAR: 5-12% portfolio allocation (growth-focused cryptocurrency allocation)
- Hedging tools: Stablecoin reserves (20-30%), options strategies, multi-asset cryptocurrency diversification
V. Potential Risk Comparison
Market Risk
CERE: Extreme liquidity risk ($12,197.36 daily trading volume) creates substantial slippage and execution challenges. Micro-cap status (#2012 ranking) exposes investors to severe price manipulation potential and sudden collapse scenarios. Limited exchange availability (3 exchanges) restricts exit strategies during market stress periods.
HBAR: Moderate market risk despite significant annual decline (-66.73%). Substantial trading volume ($937,892.13 daily) and top-30 market capitalization provide relative stability. Broad exchange distribution (52 platforms) ensures accessibility during volatile periods.
Technical Risk
CERE:
- Cross-chain compatibility framework requires continued integration maintenance across Binance Smart Chain, Polkadot, Cosmos, and Ethereum networks
- Limited documentation available regarding network stability and security audits
- Enterprise infrastructure dependency creates operational concentration risk
HBAR:
- Hashgraph consensus mechanism faces ongoing technical scrutiny regarding patent-based implementation
- Governance council structure (39-member entity) may create centralization concerns despite decentralization objectives
- Network scalability claims (10,000+ TPS) require continuous verification and performance monitoring
Regulatory Risk
Global Regulatory Impact: Both assets face regulatory uncertainty regarding cryptocurrency classification and operational requirements. Enterprise-focused infrastructure (CERE) may attract heightened regulatory scrutiny concerning data management and privacy compliance. HBAR's DeFi positioning subjects it to evolving regulatory frameworks governing decentralized finance operations.
Jurisdiction-Specific Risk: Regulatory changes in major markets (United States, European Union, Asia) could disproportionately affect both projects' operational viability and exchange availability.
VI. Conclusion: Which Is the Better Buy?
📌 Investment Value Summary
CERE Strengths:
- Enterprise-focused positioning addresses institutional data management requirements
- Cross-chain interoperability provides technical flexibility
- Binance Labs backing offers credibility foundation
- Potential recovery upside from extreme valuation lows
CERE Limitations:
- Severe depreciation (-91.13% annually) indicates substantial investor losses
- Extreme micro-cap status presents execution and liquidity challenges
- Minimal exchange accessibility restricts market accessibility
- Near all-time lows create further downside risk potential
HBAR Strengths:
- Established market position (ranked #30) demonstrates institutional recognition
- Superior liquidity and exchange distribution enable efficient market execution
- Proven governance framework with 39-member governance council
- Substantial trading volume ($937,892.13 daily) reduces manipulation risk
- Hashgraph consensus mechanism provides technical differentiation
HBAR Limitations:
- Significant annual depreciation (-66.73%) despite superior positioning
- Extreme Fear market sentiment (Index: 23) creates volatility
- Patent-based consensus mechanism creates potential technical licensing concerns
- Competitive pressure from established smart contract platforms
✅ Investment Recommendations
Beginner Investors:
- Avoid CERE entirely due to extreme micro-cap volatility and illiquidity
- Consider HBAR only within 2-5% portfolio allocation if pursuing cryptocurrency exposure
- Prioritize Bitcoin and Ethereum for foundational cryptocurrency positioning
- Allocate 70-80% of cryptocurrency allocation to established large-cap assets
Experienced Investors:
- CERE: Speculative position (maximum 5-8% allocation) only if targeting high-risk recovery upside
- HBAR: Strategic allocation (8-12% of cryptocurrency portfolio) for DeFi ecosystem exposure
- Implement strict stop-loss protocols (15-20% below entry price)
- Utilize stablecoin hedging strategies (20-30% reserve allocation)
- Monitor regulatory developments quarterly
Institutional Investors:
- CERE: Avoid due to limited institutional infrastructure and illiquidity
- HBAR: Suitable for diversified cryptocurrency allocation (5-10% institutional crypto portfolio)
- Establish direct network access for reduced trading friction
- Implement multi-exchange execution strategies to minimize market impact
- Conduct quarterly technical and governance assessments
⚠️ Risk Disclaimer: Cryptocurrency markets demonstrate extreme volatility and carry substantial risk of total capital loss. This analysis presents factual market data and does not constitute investment advice, financial recommendations, or solicitation to purchase cryptocurrency assets. Investors must conduct independent research, assess individual risk tolerance, and consult qualified financial advisors before making investment decisions. Historical price performance does not guarantee future results. Crypto asset investments remain highly speculative and suitable only for investors who can afford potential complete loss of capital.
None
Frequently Asked Questions: CERE vs HBAR Investment Comparison
I. FAQ
Q1: What are the current price differences between CERE and HBAR as of December 25, 2025?
A: As of December 25, 2025, HBAR is trading at $0.1094 while CERE is trading at $0.0003687, representing a price differential of approximately 297 times. HBAR's market capitalization stands at $4.68 billion (ranked #30), compared to CERE's $2.45 million (ranked #2012). This substantial gap reflects divergent market confidence and adoption levels between the two projects.
Q2: Which asset has performed better over the past year?
A: Both assets have experienced significant depreciation over the past year. However, HBAR demonstrates relatively stronger performance with a -66.73% annual decline compared to CERE's -91.13% annual decline. While both represent substantial losses, HBAR's superior market position, liquidity, and institutional recognition contribute to its more resilient price trajectory despite broader market challenges.
Q3: Why does CERE have significantly lower trading volume than HBAR?
A: CERE's trading volume ($12,197.36 daily) is approximately 77 times lower than HBAR's ($937,892.13 daily) due to several structural factors: CERE is listed on only 3 exchanges versus HBAR's 52 exchanges, CERE has a smaller holder base (6,786 addresses), and CERE's micro-cap status (#2012) attracts limited institutional and retail participation. This liquidity disparity creates execution challenges and increased volatility risk for CERE investors.
Q4: What are the key technological differences between CERE and HBAR?
A: CERE is a decentralized data cloud platform emphasizing cross-chain interoperability across Binance Smart Chain, Polkadot, Cosmos, and Ethereum networks, targeting enterprise infrastructure solutions. HBAR utilizes hashgraph consensus technology delivering 10,000+ transactions per second with asynchronous Byzantine Fault Tolerance security, emphasizing DeFi ecosystem development. HBAR's technology focuses on high-throughput transaction processing, while CERE's focus centers on enterprise data management infrastructure.
Q5: Which asset carries greater investment risk?
A: CERE carries substantially greater investment risk due to: extreme micro-cap status, severe liquidity constraints, limited exchange availability, concentrated holder base, near all-time low pricing, and minimal institutional backing. HBAR, while experiencing significant depreciation, maintains superior stability through larger market capitalization, broad exchange distribution (52 platforms), established governance infrastructure (39-member council), and institutional recognition. The current "Extreme Fear" market sentiment (Index: 23) amplifies these risk differentials, particularly affecting smaller-capitalization assets.
Q6: What is the price forecast comparison between CERE and HBAR through 2030?
A: Conservative 2030 forecasts project CERE at $0.000339-$0.000652 (base case) with optimistic scenario reaching $0.000757, while HBAR is projected at $0.152-$0.215 (base case) with optimistic scenario reaching $0.309. These forecasts assume continued institutional capital inflows, ecosystem development maturation, and favorable regulatory environment evolution. Both forecasts carry substantial uncertainty and should not be considered investment guarantees. Actual outcomes may diverge significantly based on technological adoption, regulatory changes, and macroeconomic conditions.
Q7: Is CERE or HBAR more suitable for conservative investors?
A: HBAR is more appropriate for conservative investors through a limited 2-5% portfolio allocation within broader cryptocurrency holdings. CERE is unsuitable for conservative investors due to extreme volatility, illiquidity, and micro-cap status creating unacceptable risk profiles. Conservative investors should prioritize established large-cap assets (Bitcoin, Ethereum) comprising 70-80% of cryptocurrency allocation, with HBAR representing limited diversification exposure only. CERE's extreme depreciation and execution challenges make it incompatible with risk-averse investment strategies.
Q8: What regulatory considerations should investors evaluate for both assets?
A: CERE faces potential regulatory scrutiny regarding enterprise data management, privacy compliance, and cross-chain operational frameworks across multiple blockchain networks. HBAR's DeFi positioning subjects it to evolving regulatory frameworks governing decentralized finance, cryptocurrency classification requirements, and network governance structures. Both assets face global regulatory uncertainty, particularly from major jurisdictions (United States, European Union, Asia) whose regulatory changes could significantly impact operational viability and exchange accessibility. Investors should monitor regulatory developments quarterly and establish contingency plans for potential regulatory adverse events.
⚠️ Disclaimer: This FAQ analysis presents factual market data and project information for informational purposes only. This content does not constitute investment advice, financial recommendations, or solicitation to purchase cryptocurrency assets. Cryptocurrency markets carry substantial risk of total capital loss. Investors must conduct independent research, assess individual risk tolerance, and consult qualified financial advisors before making investment decisions. Historical price performance does not guarantee future results.
* The information is not intended to be and does not constitute financial advice or any other recommendation of any sort offered or endorsed by Gate.