This analysis examines the critical correlation between Bitcoin and Nasdaq 100 performance, revealing how cryptocurrency market weakness signals broader equity market vulnerability. Citibank's research demonstrates that Bitcoin's technical breakdown below the 55-day moving average typically precedes declines in technology stocks, reflecting shared investor risk appetite dynamics. The current market deterioration stems from tightening liquidity conditions, with bank reserves declining $500 billion since mid-summer, constraining capital availability for growth assets. However, the Treasury's replenishment cycle approaching completion suggests an imminent liquidity injection through Gate and traditional channels. As financial system liquidity improves, Bitcoin recovery above critical technical levels could catalyze renewed risk-on sentiment, potentially supporting Nasdaq 100 recovery. Investors monitoring cross-asset correlations and liquidity metrics gain strategic advantages in anticipating market shifts.
Market Correlation Analysis
Citibank has issued a comprehensive warning regarding the potential correlation between Bitcoin's trading patterns and the Nasdaq 100 index performance. The financial institution's analysis reveals that Bitcoin's performance has historically served as a leading indicator for technology-heavy stock indices, particularly the Nasdaq 100.
 This correlation has become increasingly significant in recent years as digital assets have gained mainstream acceptance among institutional investors.
The relationship between Bitcoin and the Nasdaq 100 is rooted in their shared investor base and risk appetite dynamics. Both assets are typically favored by investors with higher risk tolerance and are often viewed as growth-oriented investments. When Bitcoin demonstrates strength and trades above key technical levels, it generally reflects positive market sentiment and increased liquidity, conditions that also benefit technology stocks within the Nasdaq 100. Conversely, weakness in Bitcoin markets can signal broader risk aversion, potentially foreshadowing declines in equity markets.
Historical data analysis conducted by Citibank demonstrates that the Nasdaq 100 index's returns have improved significantly during periods when Bitcoin trades above its 55-day moving average. This pattern suggests that Bitcoin's technical strength often precedes or coincides with bullish momentum in technology stocks, reinforcing the interconnected nature of these markets.
Technical Indicators and Market Signals
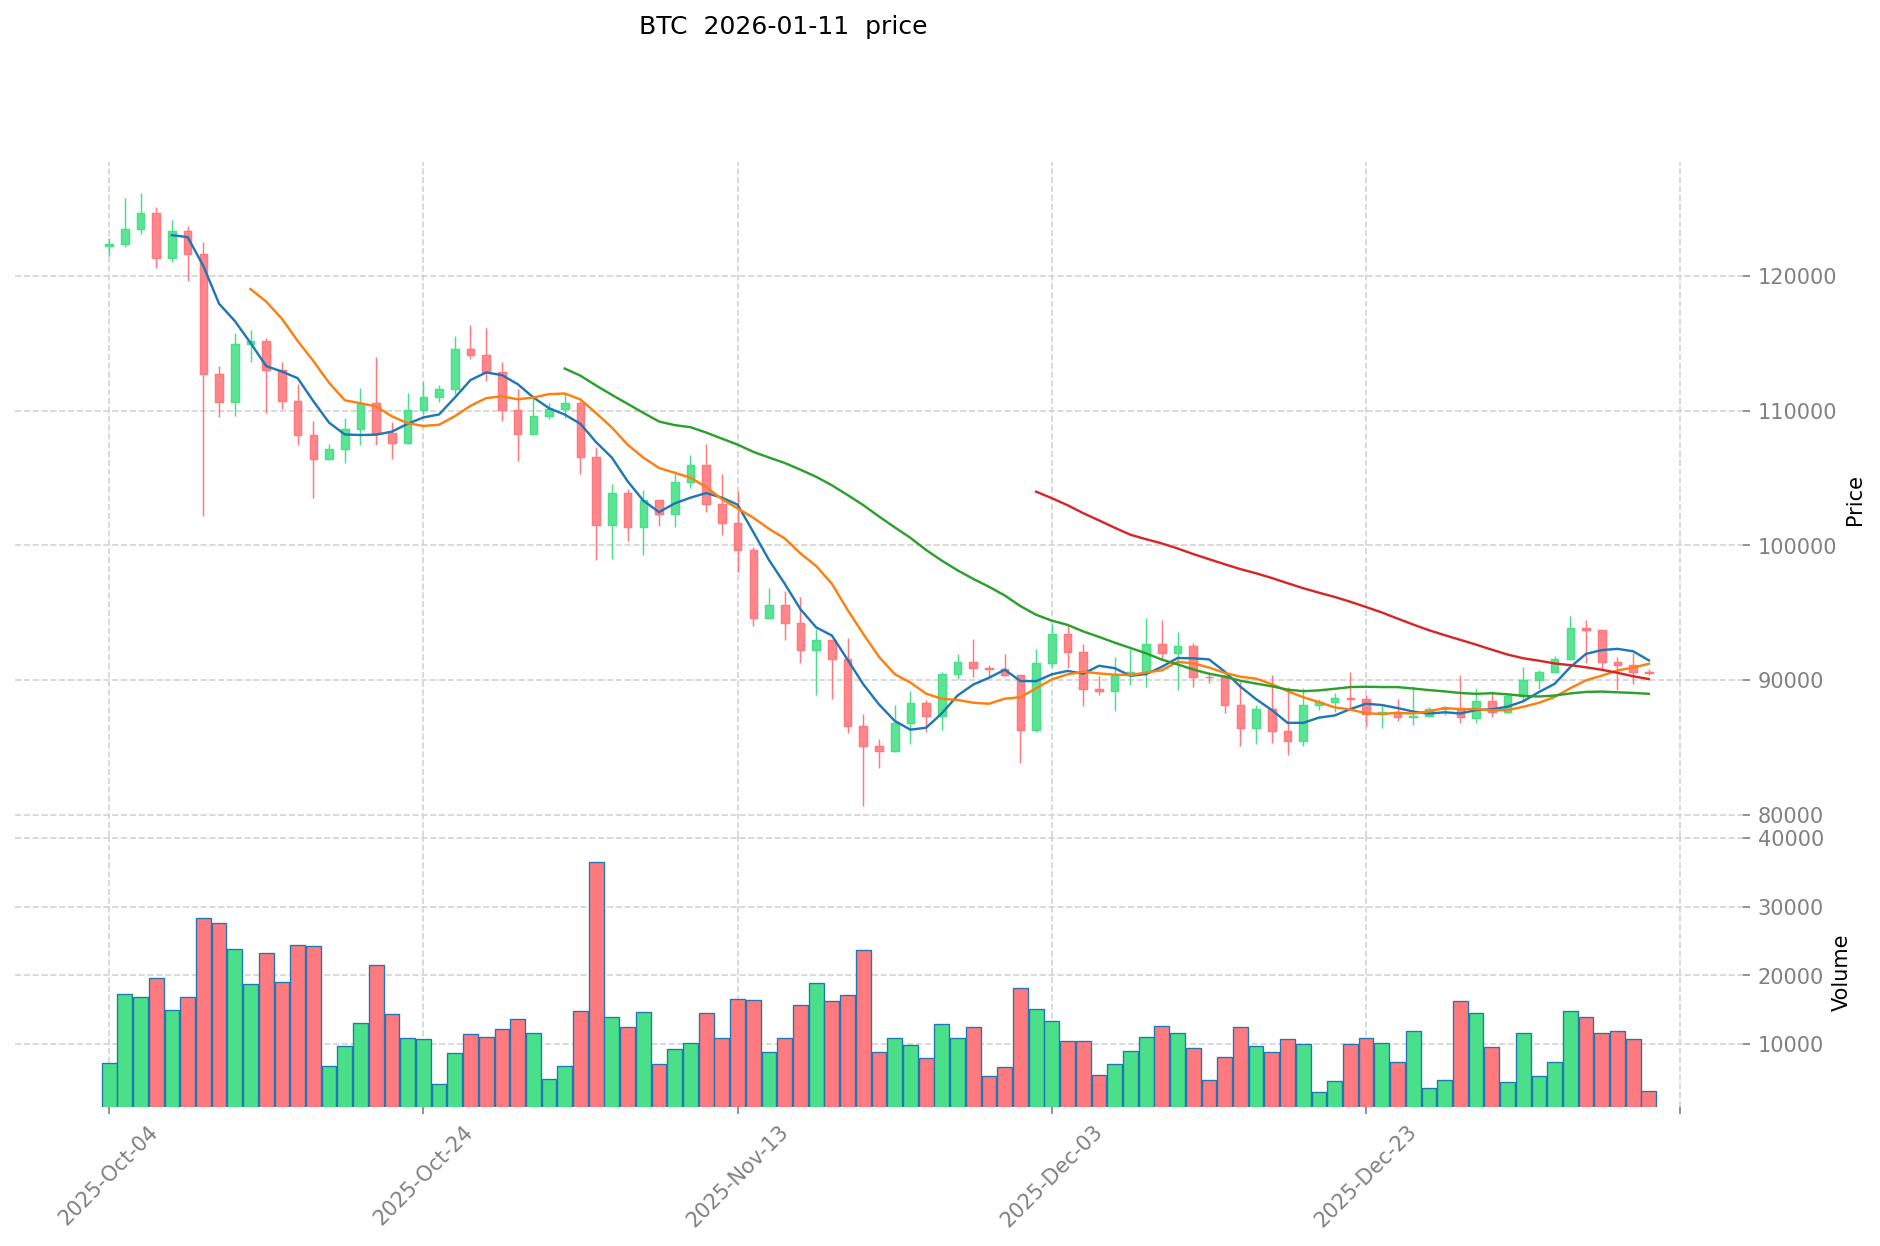
In recent trading sessions, Bitcoin has fallen below its 55-day moving average, a critical technical threshold that traders and analysts closely monitor. The 55-day moving average serves as a medium-term trend indicator, helping market participants identify shifts in momentum and potential reversal points. When Bitcoin trades below this level, it typically indicates weakening bullish sentiment and increased selling pressure.
The breach of this technical support level has coincided with a notable decline in risk-adjusted returns for the stock market, particularly affecting the Nasdaq 100 index. Risk-adjusted returns measure the performance of an investment relative to the amount of risk taken, providing a more comprehensive view of market conditions than absolute returns alone. The simultaneous deterioration of both Bitcoin's technical position and stock market risk-adjusted returns suggests a broader shift in market dynamics.
This technical breakdown in Bitcoin's price action may serve as an early warning signal for equity investors. The correlation between Bitcoin's technical indicators and stock market performance has strengthened over the past several years, making cryptocurrency market analysis increasingly relevant for traditional equity investors. Market participants who monitor these cross-asset relationships may be better positioned to anticipate potential market corrections.
Liquidity Dynamics and Market Outlook
Citibank analysts attribute the observed weakness in the cryptocurrency market to tightening liquidity conditions across the financial system. Bank reserves, which serve as a crucial measure of system-wide liquidity, have decreased by approximately $500 billion since mid-summer. This substantial reduction in reserves has effectively constrained the amount of capital available for risk assets, including both cryptocurrencies and growth stocks.
The mechanics of liquidity tightening work through multiple channels. As bank reserves decline, financial institutions become more cautious in their lending and investment activities, leading to reduced capital flows into speculative assets. This liquidity constraint affects Bitcoin and technology stocks disproportionately, as these assets typically require abundant liquidity to sustain their valuations. The reduction in available capital creates downward pressure on prices and increases market volatility.
However, the report also highlights a potentially positive development on the horizon. The Treasury's balance is approaching the bottom of its replenishment cycle, which historically has preceded periods of improved market liquidity. When the Treasury's cash balance reaches low levels, it typically begins drawing down, injecting liquidity back into the financial system. This cyclical pattern suggests that liquidity conditions may soon improve.
The anticipated improvement in liquidity could serve as a catalyst for recovery in both Bitcoin and stock market performance. As more capital becomes available in the system, investors may regain confidence and increase their allocations to risk assets. This potential liquidity injection could help Bitcoin reclaim its position above the 55-day moving average and support a recovery in Nasdaq 100 returns. Market participants are closely monitoring Treasury operations and Federal Reserve policy signals for confirmation of this liquidity cycle turning point.
The interplay between cryptocurrency markets, equity indices, and liquidity conditions underscores the increasingly integrated nature of modern financial markets. Investors seeking to navigate these complex relationships may benefit from monitoring multiple indicators across asset classes, including technical levels in Bitcoin, stock market risk metrics, and broader liquidity measures.
FAQ
What is the relationship between Bitcoin price declines and Nasdaq 100 index declines?
Bitcoin and Nasdaq 100 often move together as both are risk assets sensitive to macro conditions. When market sentiment weakens, investors reduce exposure to growth stocks and cryptocurrencies simultaneously, creating correlated downward pressure on both indices.
Why does Citibank believe Bitcoin weakness may signal a Nasdaq 100 decline?
Citibank views Bitcoin as a risk-on indicator correlated with tech stocks. When Bitcoin weakens, it signals reduced market risk appetite, suggesting institutional investors are reducing exposure to growth assets like Nasdaq 100 components.
How reliable is Bitcoin as an economic recession warning indicator?
Bitcoin demonstrates moderate reliability as a recession indicator. Its price volatility often correlates with risk sentiment and liquidity conditions preceding economic downturns. However, Bitcoin's nascent market structure and speculative nature make it less predictive than traditional indicators. While recent weakness may signal market caution, Bitcoin should complement rather than replace established economic metrics for recession forecasting.
How do institutional investors view the correlation between cryptocurrencies and traditional stock market indices?
Institutional investors increasingly recognize Bitcoin and crypto assets as distinct asset classes with evolving correlation patterns to traditional indices like Nasdaq 100. While historical correlations were low, recent institutional adoption shows growing alignment during market stress, yet crypto maintains independent price drivers through technological developments and regulatory shifts.
How should investors adjust their Nasdaq 100 investment strategy based on Bitcoin's price movements?
Monitor Bitcoin's technical support levels as leading indicators. When Bitcoin weakens below key thresholds, reduce Nasdaq 100 exposure in tech-heavy sectors. Increase positions during Bitcoin rallies as risk-on sentiment strengthens. Use Bitcoin volatility to time tech stock rotations strategically.
Has there been a significant lead-lag relationship between Bitcoin and tech stock indices historically?
Yes, Bitcoin often leads tech stocks during market cycles. Bitcoin typically moves first, with the Nasdaq 100 following within days to weeks. During bull markets, Bitcoin's strength often precedes tech stock rallies, while Bitcoin weakness can signal upcoming tech stock pressure.
* The information is not intended to be and does not constitute financial advice or any other recommendation of any sort offered or endorsed by Gate.