The article "CVX vs DOT: Comparing Two Blockchain Platforms for Enterprise Solutions" analyzes investment value differences between Convex Finance (CVX) and Polkadot (DOT). It covers historical price trends, current market conditions, supply mechanisms, institutional adoption, technical developments, and investment strategies. Readers will learn which token is more suitable for different investment goals, addressing risks and market factors influencing price predictions. The article aims at potential investors seeking insight into cryptocurrency market dynamics and enterprise adoption potential of CVX and DOT, enhancing their decision-making process.
Introduction: CVX vs DOT Investment Comparison
In the cryptocurrency market, Convex Finance (CVX) vs Polkadot (DOT) comparison has always been an unavoidable topic for investors. The two not only have significant differences in market cap ranking, application scenarios, and price performance, but also represent different positioning in crypto assets.
Convex Finance (CVX): Since its launch in 2021, it has gained market recognition for its role in optimizing returns for Curve Finance liquidity providers.
Polkadot (DOT): Since its inception in 2020, it has been hailed as the "Internet of Blockchains," aiming to connect various blockchain networks.
This article will comprehensively analyze the investment value comparison between CVX and DOT, focusing on historical price trends, supply mechanisms, institutional adoption, technological ecosystems, and future predictions, attempting to answer the question investors care about most:
"Which is the better buy right now?"
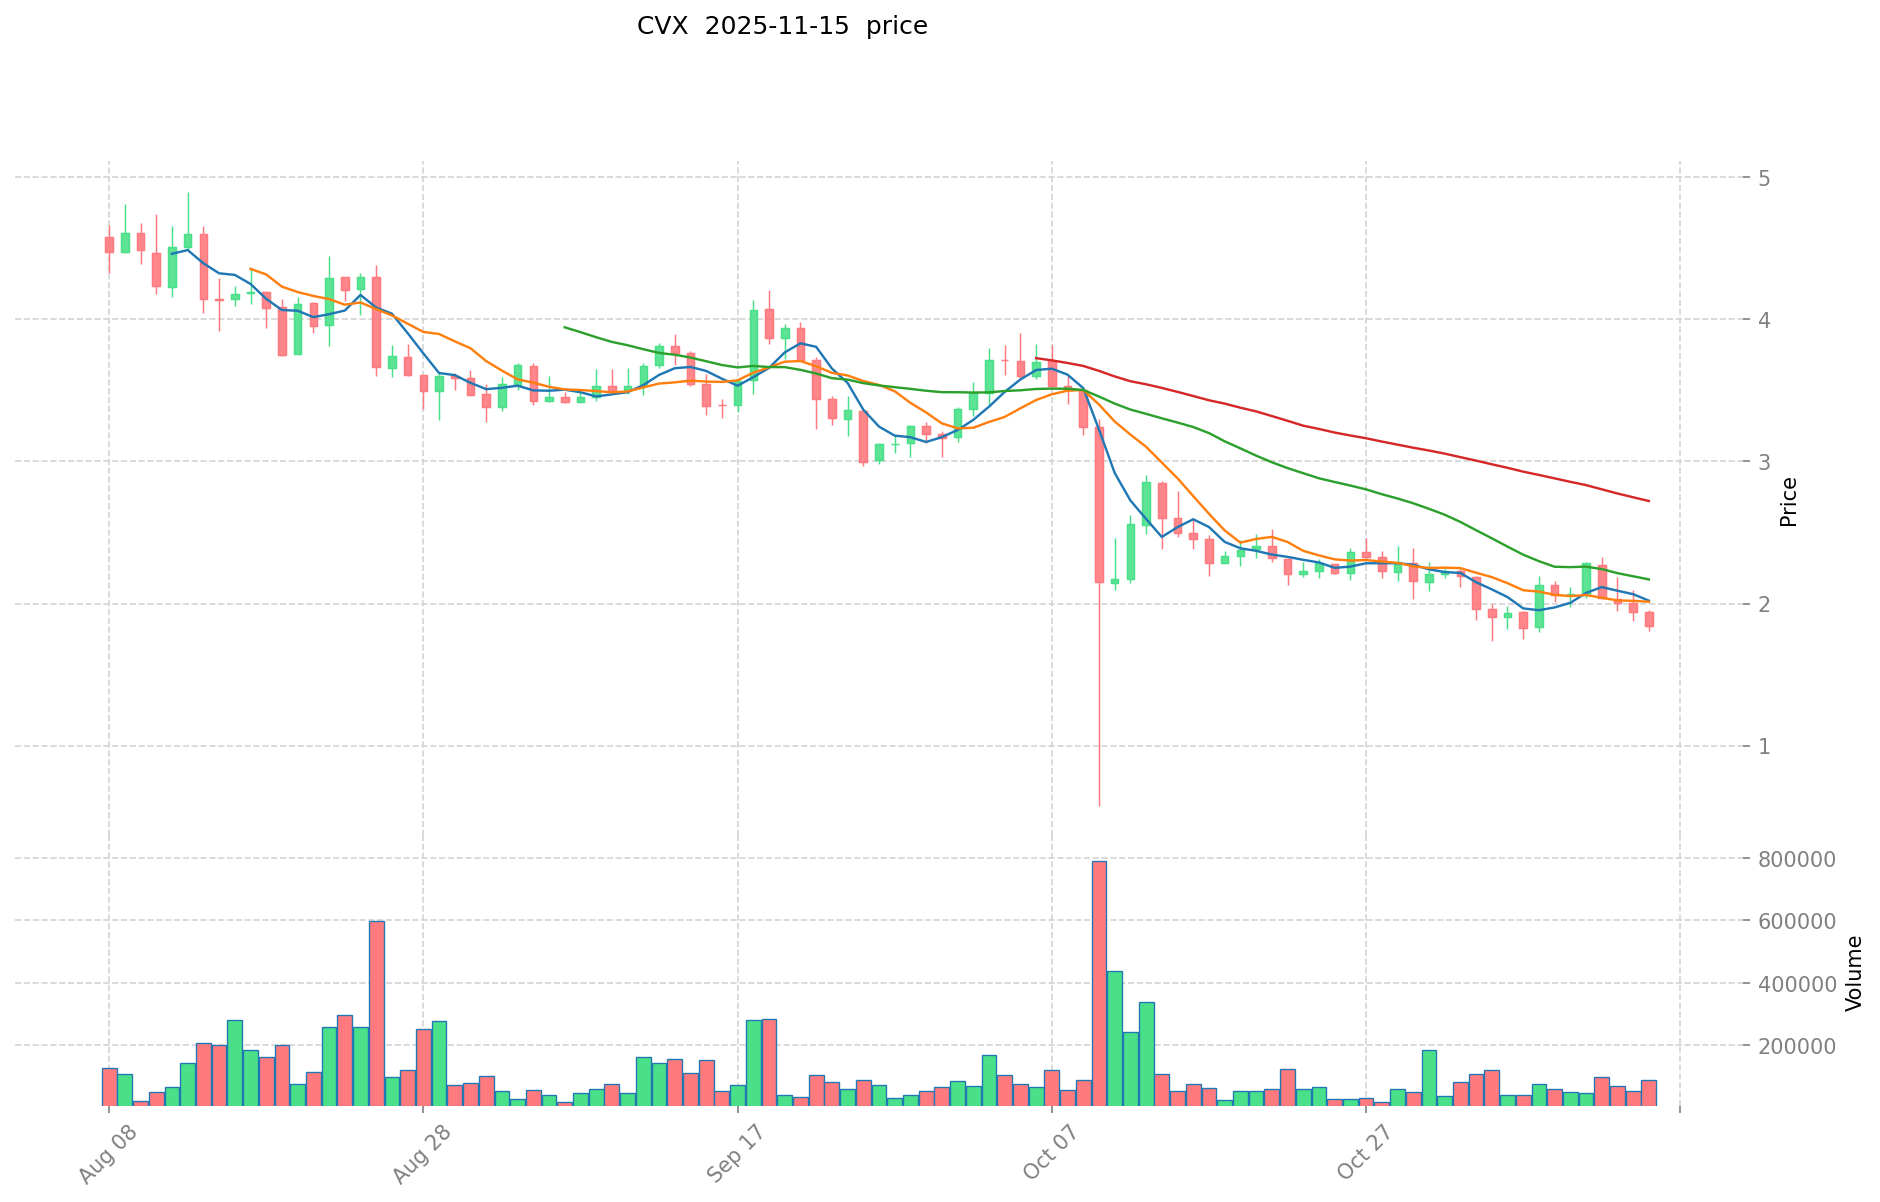
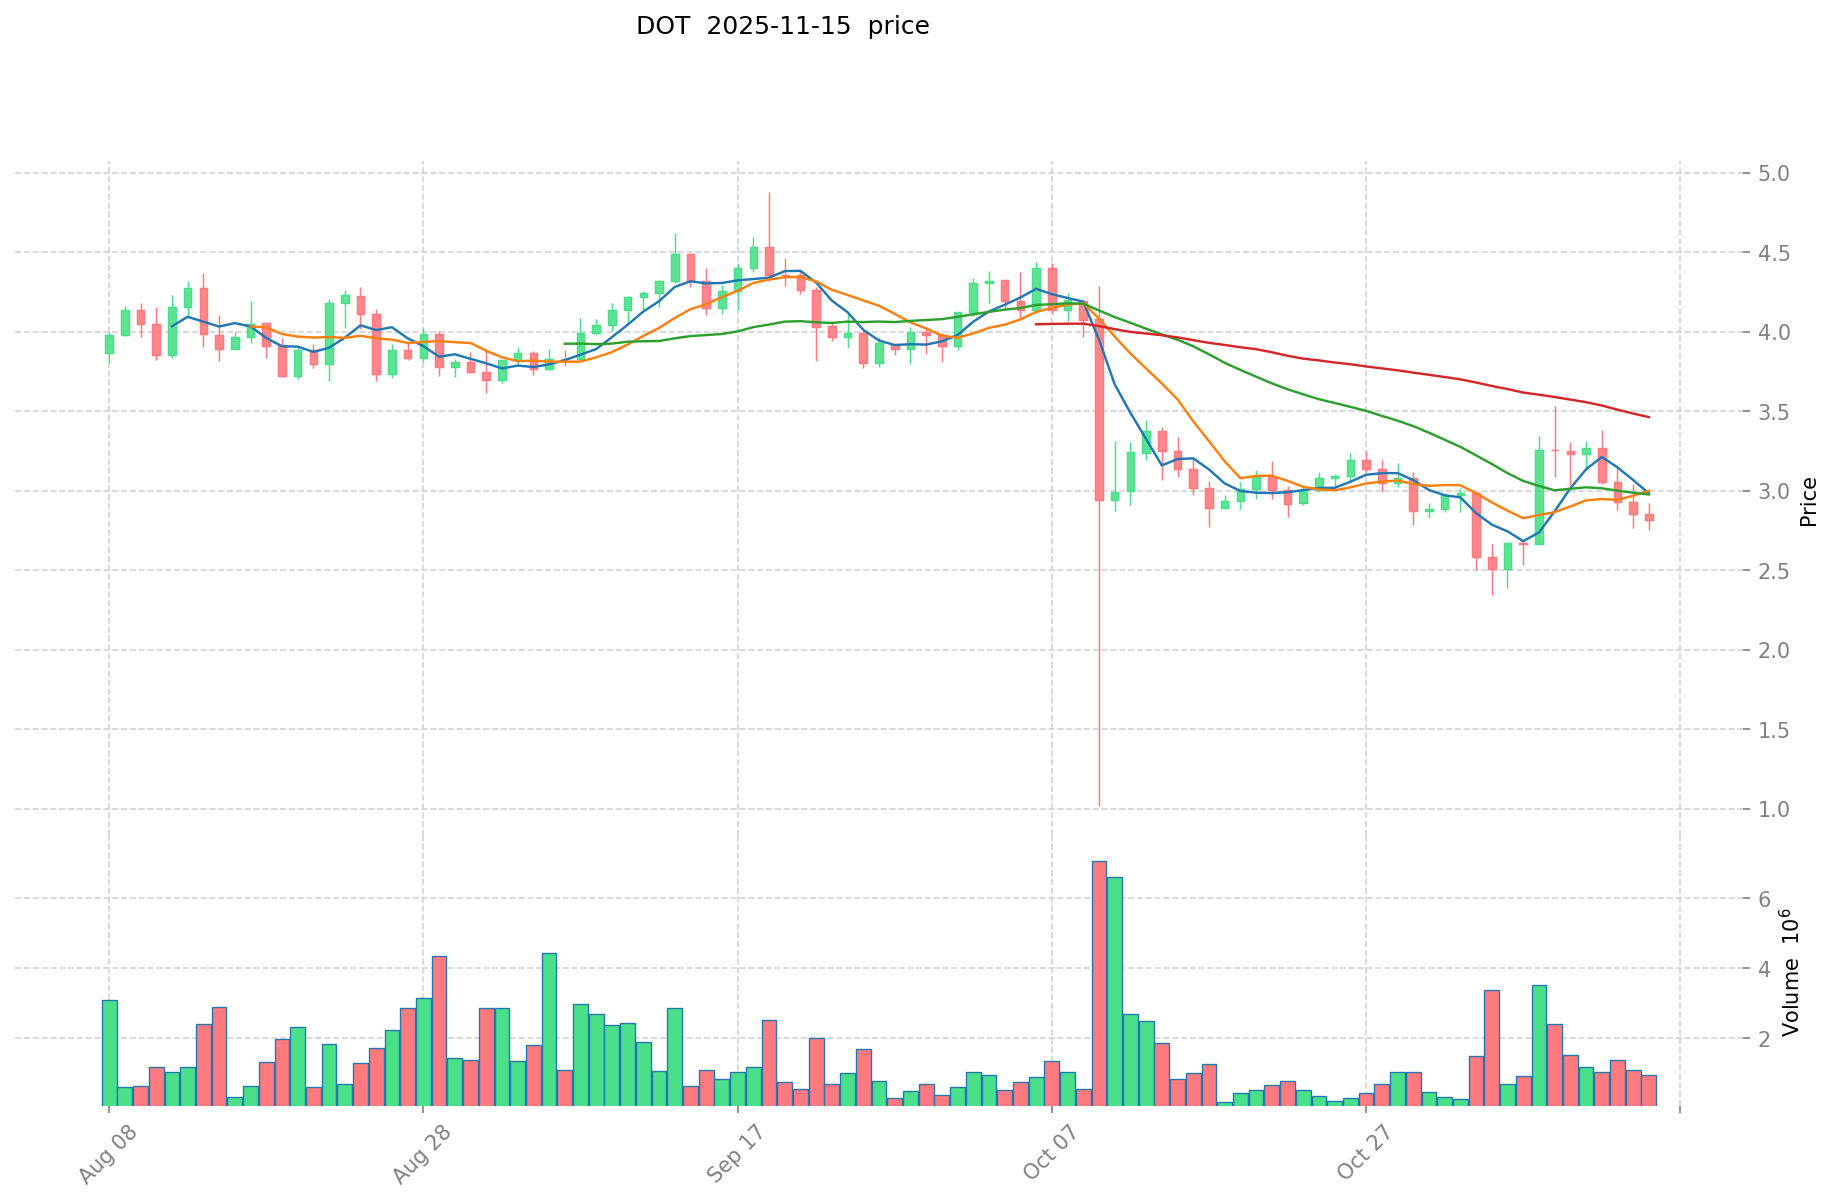
I. Price History Comparison and Current Market Status
CVX and DOT Historical Price Trends
- 2022: CVX experienced a significant price drop, falling from its all-time high of $60.09 to lower levels.
- 2021: DOT reached its all-time high of $54.98 in November, driven by increased adoption and network upgrades.
- Comparative analysis: During the recent market cycle, CVX dropped from its peak of $60.09 to a low of $1.36, while DOT declined from $54.98 to $2.13.
Current Market Situation (2025-11-16)
- CVX current price: $1.873
- DOT current price: $2.85
- 24-hour trading volume: CVX $41,148.69716 vs DOT $1,394,464.31143
- Market Sentiment Index (Fear & Greed Index): 10 (Extreme Fear)
Click to view real-time prices:
- View CVX current price Market Price
- View DOT current price Market Price
II. Core Factors Affecting Investment Value of CVX vs DOT
Supply Mechanisms Comparison (Tokenomics)
- Convex Finance (CVX): Total supply capped at 100 million tokens, with emissions reducing over time as they approach the maximum supply. Features a vote-locked mechanism where users can lock tokens for up to 4 years.
- Polkadot (DOT): Inflationary model with approximately 10% annual inflation rate. New DOT tokens are continuously minted to reward validators, with inflation rate adjusting based on staking participation.
- 📌 Historical pattern: Fixed supply models like CVX tend to create scarcity value during market rallies, while DOT's inflation requires stronger adoption to maintain price growth.
Institutional Adoption and Market Applications
- Institutional holdings: DOT has attracted more institutional investment through custody solutions from Coinbase, Fireblocks and investment products like Grayscale's DOT Trust.
- Enterprise adoption: Polkadot has gained traction with enterprise partners developing cross-chain solutions and parachains, while CVX remains primarily utilized within DeFi by yield optimizers and protocols.
- Regulatory attitudes: DOT has achieved greater regulatory clarity in many jurisdictions as a layer-0 blockchain, while CVX faces potential scrutiny as part of DeFi yield optimization protocols.
Technical Development and Ecosystem Building
- Convex Finance technical upgrades: Focus on Curve liquidity optimization, integration with additional yield platforms, and improved governance mechanisms for veCRV holders.
- Polkadot technical development: Ongoing parachain auction system, cross-consensus messaging (XCM) improvements, and interoperability solutions connecting multiple blockchains.
- Ecosystem comparison: CVX primarily focused on DeFi yield optimization within the Curve ecosystem, while DOT supports a broader range of applications across DeFi, NFTs, identity solutions, IoT, and enterprise applications through its parachain network.
Macroeconomic Factors and Market Cycles
- Performance during inflation: DOT positions itself as digital infrastructure rather than purely digital currency, while CVX value is more tied to DeFi yields and liquidity mining incentives.
- Monetary policy impact: Both tokens show sensitivity to interest rate changes, with CVX potentially more volatile due to its connection with DeFi yields.
- Geopolitical factors: DOT's interoperability focus positions it better for cross-border applications and institutional adoption during regulatory uncertainty.
III. 2025-2030 Price Prediction: CVX vs DOT
Short-term Prediction (2025)
- CVX: Conservative $1.70 - $1.87 | Optimistic $1.87 - $2.30
- DOT: Conservative $1.74 - $2.85 | Optimistic $2.85 - $3.58
Mid-term Prediction (2027)
- CVX may enter a growth phase, with expected price range of $1.85 - $2.27
- DOT may enter a bullish market, with expected price range of $2.73 - $4.22
- Key drivers: Institutional capital inflow, ETF, ecosystem development
Long-term Prediction (2030)
- CVX: Base scenario $1.94 - $2.73 | Optimistic scenario $2.73 - $3.25
- DOT: Base scenario $4.62 - $5.92 | Optimistic scenario $5.92 - $8.11
View detailed price predictions for CVX and DOT
Disclaimer: The information provided is for informational purposes only and should not be considered as financial advice. Cryptocurrency markets are highly volatile and unpredictable. Always conduct your own research before making any investment decisions.
CVX:
| 年份 |
预测最高价 |
预测平均价格 |
预测最低价 |
涨跌幅 |
| 2025 |
2.30256 |
1.872 |
1.70352 |
0 |
| 2026 |
2.2751352 |
2.08728 |
1.4819688 |
11 |
| 2027 |
2.268455904 |
2.1812076 |
1.85402646 |
16 |
| 2028 |
2.35832165712 |
2.224831752 |
2.09134184688 |
18 |
| 2029 |
3.1623758522928 |
2.29157670456 |
2.1540821022864 |
22 |
| 2030 |
3.245101771327416 |
2.7269762784264 |
1.936153157682744 |
45 |
DOT:
| 年份 |
预测最高价 |
预测平均价格 |
预测最低价 |
涨跌幅 |
| 2025 |
3.5847 |
2.845 |
1.73545 |
0 |
| 2026 |
4.5972355 |
3.21485 |
1.864613 |
13 |
| 2027 |
4.21852617 |
3.90604275 |
2.734229925 |
37 |
| 2028 |
5.484084021 |
4.06228446 |
3.7779245478 |
42 |
| 2029 |
7.06431267594 |
4.7731842405 |
4.00947476202 |
67 |
| 2030 |
8.1086853877614 |
5.91874845822 |
4.6166237974116 |
108 |
IV. Investment Strategy Comparison: CVX vs DOT
Long-term vs Short-term Investment Strategies
- CVX: Suitable for investors focused on DeFi yield optimization and Curve ecosystem growth
- DOT: Suitable for investors looking for long-term blockchain infrastructure potential and interoperability solutions
Risk Management and Asset Allocation
- Conservative investors: CVX: 20% vs DOT: 80%
- Aggressive investors: CVX: 40% vs DOT: 60%
- Hedging tools: Stablecoin allocation, options, cross-token portfolio diversification
V. Potential Risk Comparison
Market Risks
- CVX: High volatility due to dependency on DeFi market trends and Curve ecosystem performance
- DOT: Susceptible to overall crypto market sentiment and competition from other layer-0 and interoperability solutions
Technical Risks
- CVX: Platform security, smart contract vulnerabilities, dependencies on Curve Finance
- DOT: Parachain auction dynamics, cross-chain messaging security, network congestion during high activity periods
Regulatory Risks
- Global regulatory policies may have different impacts on both tokens, with CVX potentially facing more scrutiny due to its DeFi focus, while DOT may benefit from its positioning as blockchain infrastructure
VI. Conclusion: Which Is the Better Buy?
📌 Investment Value Summary:
- CVX advantages: Specialized role in DeFi yield optimization, fixed supply model creating potential scarcity value
- DOT advantages: Broader ecosystem potential, stronger institutional adoption, positioning as blockchain infrastructure
✅ Investment Advice:
- New investors: Consider allocating a larger portion to DOT due to its broader market recognition and ecosystem potential
- Experienced investors: Balanced approach with both tokens, leveraging CVX for DeFi exposure and DOT for long-term blockchain infrastructure bet
- Institutional investors: Focus on DOT for its regulatory clarity and potential for enterprise blockchain solutions
⚠️ Risk Warning: Cryptocurrency markets are highly volatile. This article does not constitute investment advice.
None
VII. FAQ
Q1: What are the key differences between CVX and DOT?
A: CVX is focused on DeFi yield optimization within the Curve ecosystem, while DOT aims to be an interoperable blockchain network connecting multiple chains. CVX has a fixed supply cap, whereas DOT has an inflationary model. DOT has attracted more institutional investment and enterprise adoption compared to CVX.
Q2: Which token has performed better historically?
A: Both tokens have experienced significant price volatility. CVX reached an all-time high of $60.09 but dropped to lows of $1.36. DOT's all-time high was $54.98, falling to lows of $2.13. As of 2025-11-16, DOT is trading at a higher price ($2.85) compared to CVX ($1.873).
Q3: How do the supply mechanisms differ between CVX and DOT?
A: CVX has a fixed total supply capped at 100 million tokens, with emissions reducing over time. DOT has an inflationary model with approximately 10% annual inflation, where new tokens are minted to reward validators.
Q4: Which token is considered more suitable for long-term investment?
A: DOT is generally considered more suitable for long-term investment due to its positioning as blockchain infrastructure, broader ecosystem potential, and stronger institutional adoption. However, both tokens have their unique strengths and potential for growth.
Q5: What are the main risks associated with investing in CVX and DOT?
A: For CVX, main risks include high volatility due to DeFi market trends, platform security, and smart contract vulnerabilities. For DOT, risks involve overall crypto market sentiment, competition from other interoperability solutions, and technical challenges related to parachain auctions and cross-chain messaging security.
Q6: How might regulatory factors affect CVX and DOT differently?
A: CVX may face more regulatory scrutiny due to its focus on DeFi yield optimization. DOT, positioned as blockchain infrastructure, has achieved greater regulatory clarity in many jurisdictions and may be viewed more favorably by regulators.
Q7: What are the price predictions for CVX and DOT by 2030?
A: By 2030, CVX is predicted to range from $1.94 to $3.25 in optimistic scenarios. DOT is expected to reach between $4.62 and $8.11 in optimistic scenarios. However, these predictions are speculative and subject to market conditions.
* The information is not intended to be and does not constitute financial advice or any other recommendation of any sort offered or endorsed by Gate.


