The article "D2T vs SNX: Comparing Decentralized Trading Platforms for Synthetic Assets" offers an in-depth analysis of Dash 2 Trade (D2T) and Synthetix (SNX), highlighting their unique positions in the cryptocurrency market. It addresses key investment considerations, such as supply mechanisms, institutional adoption, and technical developments, catering to both new and experienced investors seeking to evaluate these platforms. Key sections include a price history comparison, investment strategy guidance, and risk assessment, structured to guide investors on which platform presents a better current and future investment opportunity. For real-time prices, visit Gate [D2T](https://www.gate.com/price/dash-2-trade-d2t) and [SNX](https://www.gate.com/pricesynthetix-snx).
Introduction: D2T vs SNX Investment Comparison
In the cryptocurrency market, the comparison between Dash 2 Trade (D2T) and Synthetix (SNX) has been an unavoidable topic for investors. The two not only show significant differences in market cap ranking, application scenarios, and price performance but also represent different positioning in the crypto asset space.
Dash 2 Trade (D2T): Since its launch, it has gained market recognition for its role as an encrypted analysis platform built by experienced traders and influencers.
Synthetix (SNX): Since 2018, it has been hailed as a platform designed for engineers to build decentralized and untrusted networks, supporting a variety of synthetic assets.
This article will provide a comprehensive analysis of the investment value comparison between D2T and SNX, focusing on historical price trends, supply mechanisms, institutional adoption, technical ecosystems, and future predictions, attempting to answer the question most concerning to investors:
"Which is the better buy right now?"
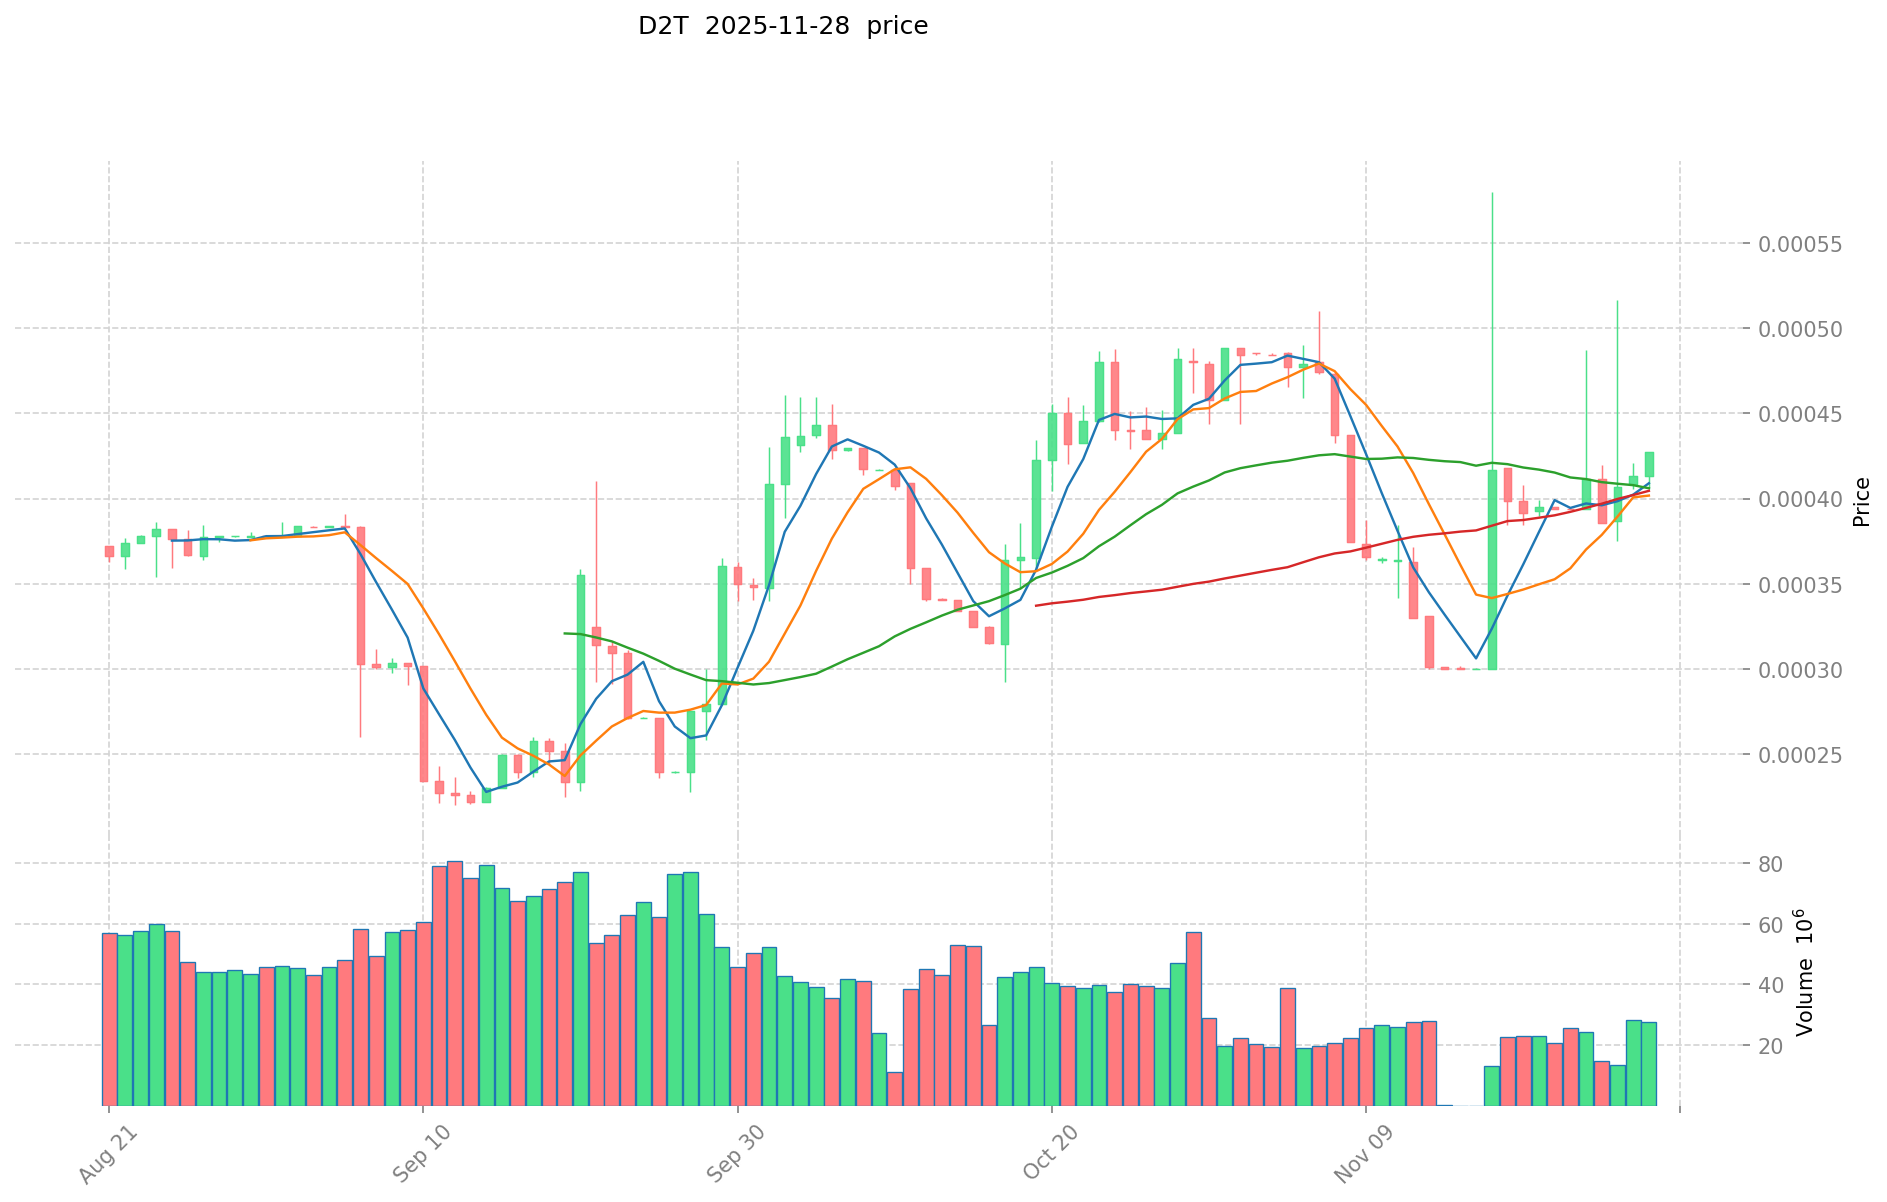
I. Price History Comparison and Current Market Status
D2T and SNX Historical Price Trends
- 2023: D2T reached its all-time high of $0.053805 on March 6, 2023.
- 2021: SNX hit its all-time high of $28.53 on February 14, 2021.
- Comparative analysis: D2T has experienced a significant decline from its all-time high, dropping to $0.00042724 as of November 28, 2025. Similarly, SNX has fallen from its peak to $0.5627 on the same date.
Current Market Situation (2025-11-28)
- D2T current price: $0.00042724
- SNX current price: $0.5627
- 24-hour trading volume: D2T $11,625.65 vs SNX $2,142,924.91
- Market Sentiment Index (Fear & Greed Index): 25 (Extreme Fear)
Click to view real-time prices:
- Check D2T current price Market Price
- Check SNX current price Market Price

II. Core Factors Affecting D2T vs SNX Investment Value
Supply Mechanism Comparison (Tokenomics)
-
D2T: Fixed maximum supply of 1 billion tokens with 36% allocated to presale, 58% for development/marketing, and 6% for team retention
-
SNX: Inflationary model with terminal inflation of 2.5% annually after 2024, designed for staking incentives
-
📌 Historical pattern: SNX's inflation-based staking incentives have historically driven higher participation in the Synthetix protocol during bull markets, while D2T's fixed supply model is designed to create scarcity as adoption increases.
Institutional Adoption and Market Applications
- Institutional holdings: SNX has garnered more institutional interest due to its longer market presence (since 2018) and established role in DeFi, while D2T is newer to the market
- Enterprise adoption: SNX is primarily used in DeFi protocols for synthetic asset creation, while D2T focuses on providing trading intelligence and analytics tools
- Regulatory attitudes: Both tokens face regulatory scrutiny, with SNX possibly facing more complex regulatory challenges due to its role in creating synthetic assets
Technical Development and Ecosystem Building
- D2T technical upgrades: Platform launched with trading signals, sentiment analysis, and strategy backtesting tools; planning expansion of analytical capabilities
- SNX technical development: Implementation of V3 architecture focusing on enhanced liquidity, reduced gas fees, and improved capital efficiency
- Ecosystem comparison: SNX has an established position in DeFi with integrations across multiple protocols, while D2T is building its ecosystem around trading intelligence and educational tools
Macroeconomic Factors and Market Cycles
- Performance in inflationary environments: SNX potentially offers better inflation protection through its role in creating synthetic assets that can track various asset classes
- Macroeconomic monetary policy: Interest rate changes likely affect SNX more directly due to its deeper integration with broader DeFi markets and leverage mechanisms
- Geopolitical factors: D2T's trading intelligence tools may become more valuable during periods of market uncertainty, while SNX's synthetic assets offer exposure to various markets without direct ownership
III. 2025-2030 Price Prediction: D2T vs SNX
Short-term Forecast (2025)
- D2T: Conservative $0.00035-$0.00042 | Optimistic $0.00042-$0.00057
- SNX: Conservative $0.43-$0.56 | Optimistic $0.56-$0.74
Mid-term Forecast (2027)
- D2T may enter a growth phase, with expected price range of $0.00047-$0.00071
- SNX may enter a bullish market, with expected price range of $0.65-$1.07
- Key drivers: Institutional capital inflow, ETF, ecosystem development
Long-term Forecast (2030)
- D2T: Base scenario $0.00057-$0.00077 | Optimistic scenario $0.00077-$0.00091
- SNX: Base scenario $0.74-$1.33 | Optimistic scenario $1.33-$1.62
View detailed price predictions for D2T and SNX
Disclaimer
D2T:
| 年份 |
预测最高价 |
预测平均价格 |
预测最低价 |
涨跌幅 |
| 2025 |
0.0005707864 |
0.00042596 |
0.0003578064 |
0 |
| 2026 |
0.000533259324 |
0.0004983732 |
0.000433584684 |
16 |
| 2027 |
0.00071698460418 |
0.000515816262 |
0.00047970912366 |
20 |
| 2028 |
0.000850632597664 |
0.00061640043309 |
0.000369840259854 |
44 |
| 2029 |
0.000806868166914 |
0.000733516515377 |
0.000579478047147 |
71 |
| 2030 |
0.000916528885963 |
0.000770192341146 |
0.000577644255859 |
80 |
SNX:
| 年份 |
预测最高价 |
预测平均价格 |
预测最低价 |
涨跌幅 |
| 2025 |
0.746176 |
0.5696 |
0.432896 |
1 |
| 2026 |
0.8552544 |
0.657888 |
0.58552032 |
16 |
| 2027 |
1.074331104 |
0.7565712 |
0.650651232 |
34 |
| 2028 |
1.36402221648 |
0.915451152 |
0.5034981336 |
62 |
| 2029 |
1.538644523724 |
1.13973668424 |
1.082749850028 |
102 |
| 2030 |
1.62042063081822 |
1.339190603982 |
0.74994673822992 |
137 |
IV. Investment Strategy Comparison: D2T vs SNX
Long-term vs Short-term Investment Strategies
- D2T: Suitable for investors focused on trading intelligence and analytical tools
- SNX: Suitable for investors interested in DeFi and synthetic asset exposure
Risk Management and Asset Allocation
- Conservative investors: D2T: 30% vs SNX: 70%
- Aggressive investors: D2T: 60% vs SNX: 40%
- Hedging tools: Stablecoin allocation, options, cross-currency portfolios
V. Potential Risk Comparison
Market Risk
- D2T: High volatility due to lower market cap and trading volume
- SNX: Exposure to broader DeFi market fluctuations
Technical Risk
- D2T: Platform stability, data accuracy
- SNX: Smart contract vulnerabilities, oracle dependencies
Regulatory Risk
- Global regulatory policies may impact SNX more due to its synthetic asset creation
VI. Conclusion: Which Is the Better Buy?
📌 Investment Value Summary:
- D2T advantages: Unique trading intelligence offering, fixed supply model
- SNX advantages: Established DeFi presence, synthetic asset exposure
✅ Investment Advice:
- New investors: Consider a small allocation to D2T for exposure to trading tools
- Experienced investors: Balanced approach with higher allocation to SNX
- Institutional investors: Focus on SNX for its established market position and DeFi integration
⚠️ Risk Warning: Cryptocurrency markets are highly volatile. This article does not constitute investment advice.
None
VII. FAQ
Q1: What are the main differences between D2T and SNX?
A: D2T is a crypto analysis platform focused on trading intelligence, while SNX is a DeFi platform for creating synthetic assets. D2T has a fixed supply of 1 billion tokens, whereas SNX has an inflationary model. D2T is newer to the market, while SNX has been around since 2018 and has more established institutional adoption.
Q2: Which token has performed better historically?
A: SNX has reached a higher all-time high of $28.53 in February 2021, compared to D2T's all-time high of $0.053805 in March 2023. However, both tokens have experienced significant declines from their peaks as of November 28, 2025.
Q3: How do the current market conditions compare for D2T and SNX?
A: As of November 28, 2025, D2T is priced at $0.00042724, while SNX is at $0.5627. SNX has a significantly higher 24-hour trading volume of $2,142,924.91 compared to D2T's $11,625.65. The overall market sentiment is in "Extreme Fear" with a Fear & Greed Index of 25.
Q4: What are the key factors affecting the investment value of D2T and SNX?
A: Key factors include supply mechanisms, institutional adoption, technical development, ecosystem building, and macroeconomic factors. SNX generally has more institutional interest and a more established ecosystem in DeFi, while D2T offers unique trading intelligence tools.
Q5: What are the price predictions for D2T and SNX in the coming years?
A: By 2030, conservative estimates for D2T range from $0.00057 to $0.00077, with optimistic scenarios reaching $0.00091. For SNX, base predictions range from $0.74 to $1.33, with optimistic scenarios up to $1.62. However, these predictions are subject to market volatility and should not be considered financial advice.
Q6: How should investors approach risk management when considering D2T and SNX?
A: Conservative investors might consider allocating 30% to D2T and 70% to SNX, while aggressive investors might opt for 60% D2T and 40% SNX. It's important to use hedging tools like stablecoin allocation, options, and cross-currency portfolios to manage risk.
Q7: What are the potential risks associated with investing in D2T and SNX?
A: D2T faces high volatility due to its lower market cap and trading volume, as well as potential platform stability issues. SNX is exposed to broader DeFi market fluctuations, smart contract vulnerabilities, and potentially greater regulatory scrutiny due to its role in synthetic asset creation.
* The information is not intended to be and does not constitute financial advice or any other recommendation of any sort offered or endorsed by Gate.


