# DOMI vs DOT: Which Blockchain Project Offers Better Investment Potential in 2024?
**Article Overview:**
This comprehensive investment analysis compares DOMI and DOT across critical dimensions including price history, tokenomics, ecosystem maturity, and future potential. DOMI operates as a fully functional 3D blockchain MMORPG with NFT integration, while DOT serves as Polkadot's interoperability protocol connecting multiple blockchain networks. The article addresses investors' core question: which asset delivers superior returns in the current market cycle? Through detailed technical analysis, risk assessment, and 2025-2030 price predictions, this guide provides actionable insights for beginner, experienced, and institutional investors. Both assets have declined 96-99% from historical peaks, presenting distinct risk-reward profiles. DOT offers established infrastructure with $1.23 billion circulating supply and major exchange listings on Gate, while DOMI represents early-stage gaming sector opportunity. Th
Introduction: DOMI vs DOT Investment Comparison
In the cryptocurrency market, comparisons between DOMI and DOT remain a topic investors cannot avoid. The two assets not only show significant differences in market cap ranking, application scenarios, and price performance, but also represent different positioning within the crypto asset landscape.
DOMI (DOMI): Launched as a 3D blockchain MMORPG based on NFT, DOMI differentiates itself through its fully operational game world featuring spells, battles, monsters, and NPCs, rather than existing as a mere whitepaper.
DOT (Polkadot): Since its launch, Polkadot has been recognized as a major interoperability protocol, designed to connect private chains, consortium chains, public chains, and open networks through its relay chain infrastructure. DOT has established itself as one of the most traded and highest market cap cryptocurrencies globally.
This article will comprehensively analyze the investment value comparison between DOMI and DOT across historical price trends, supply mechanisms, adoption scale, technical ecosystem, and future outlook, while attempting to address investors' most pressing question:
"Which is the better buy right now?"
I. Price History Comparison and Current Market Status
Domi (DOMI) and Polkadot (DOT) Historical Price Trends
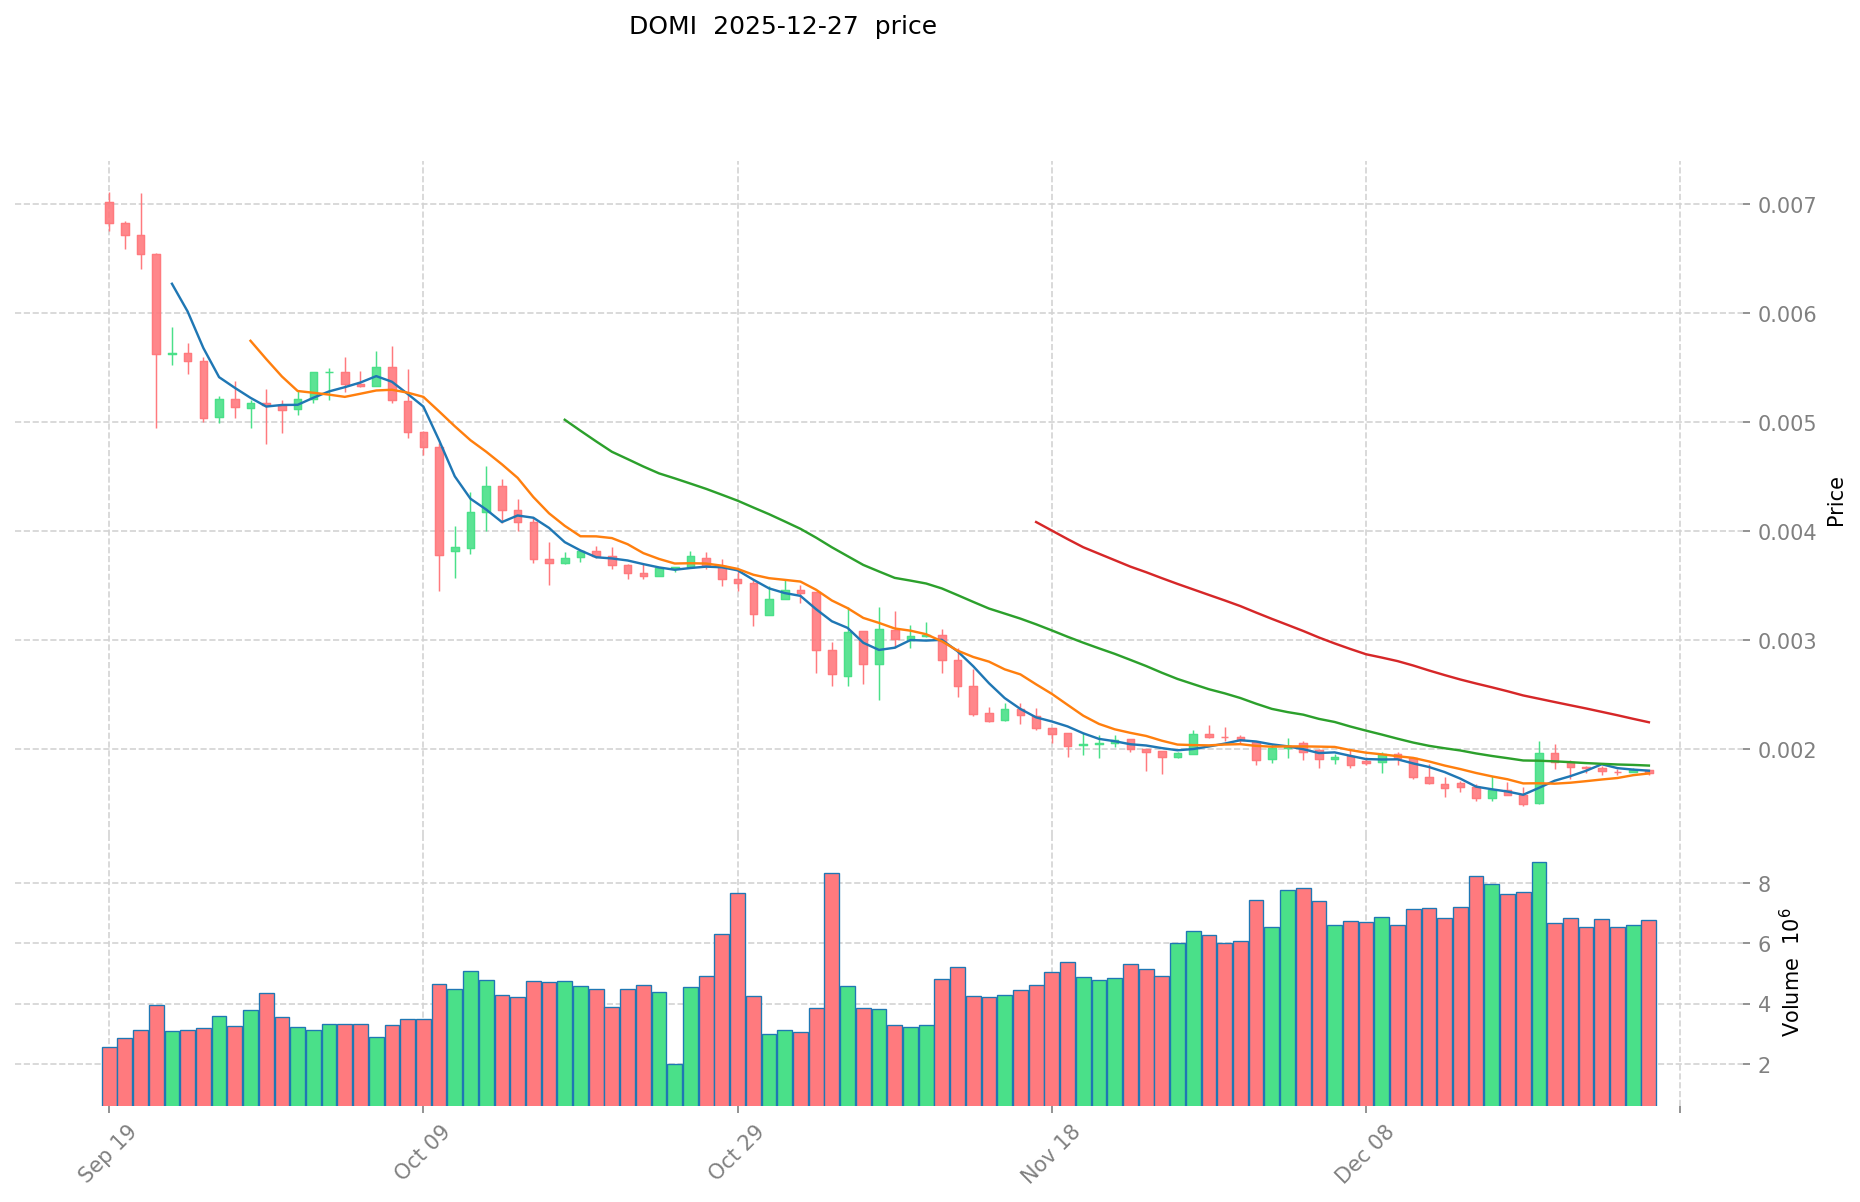
- 2022: Domi reached its all-time high of $0.407925 on February 1st, 2022, following the project's initial market launch and community enthusiasm.
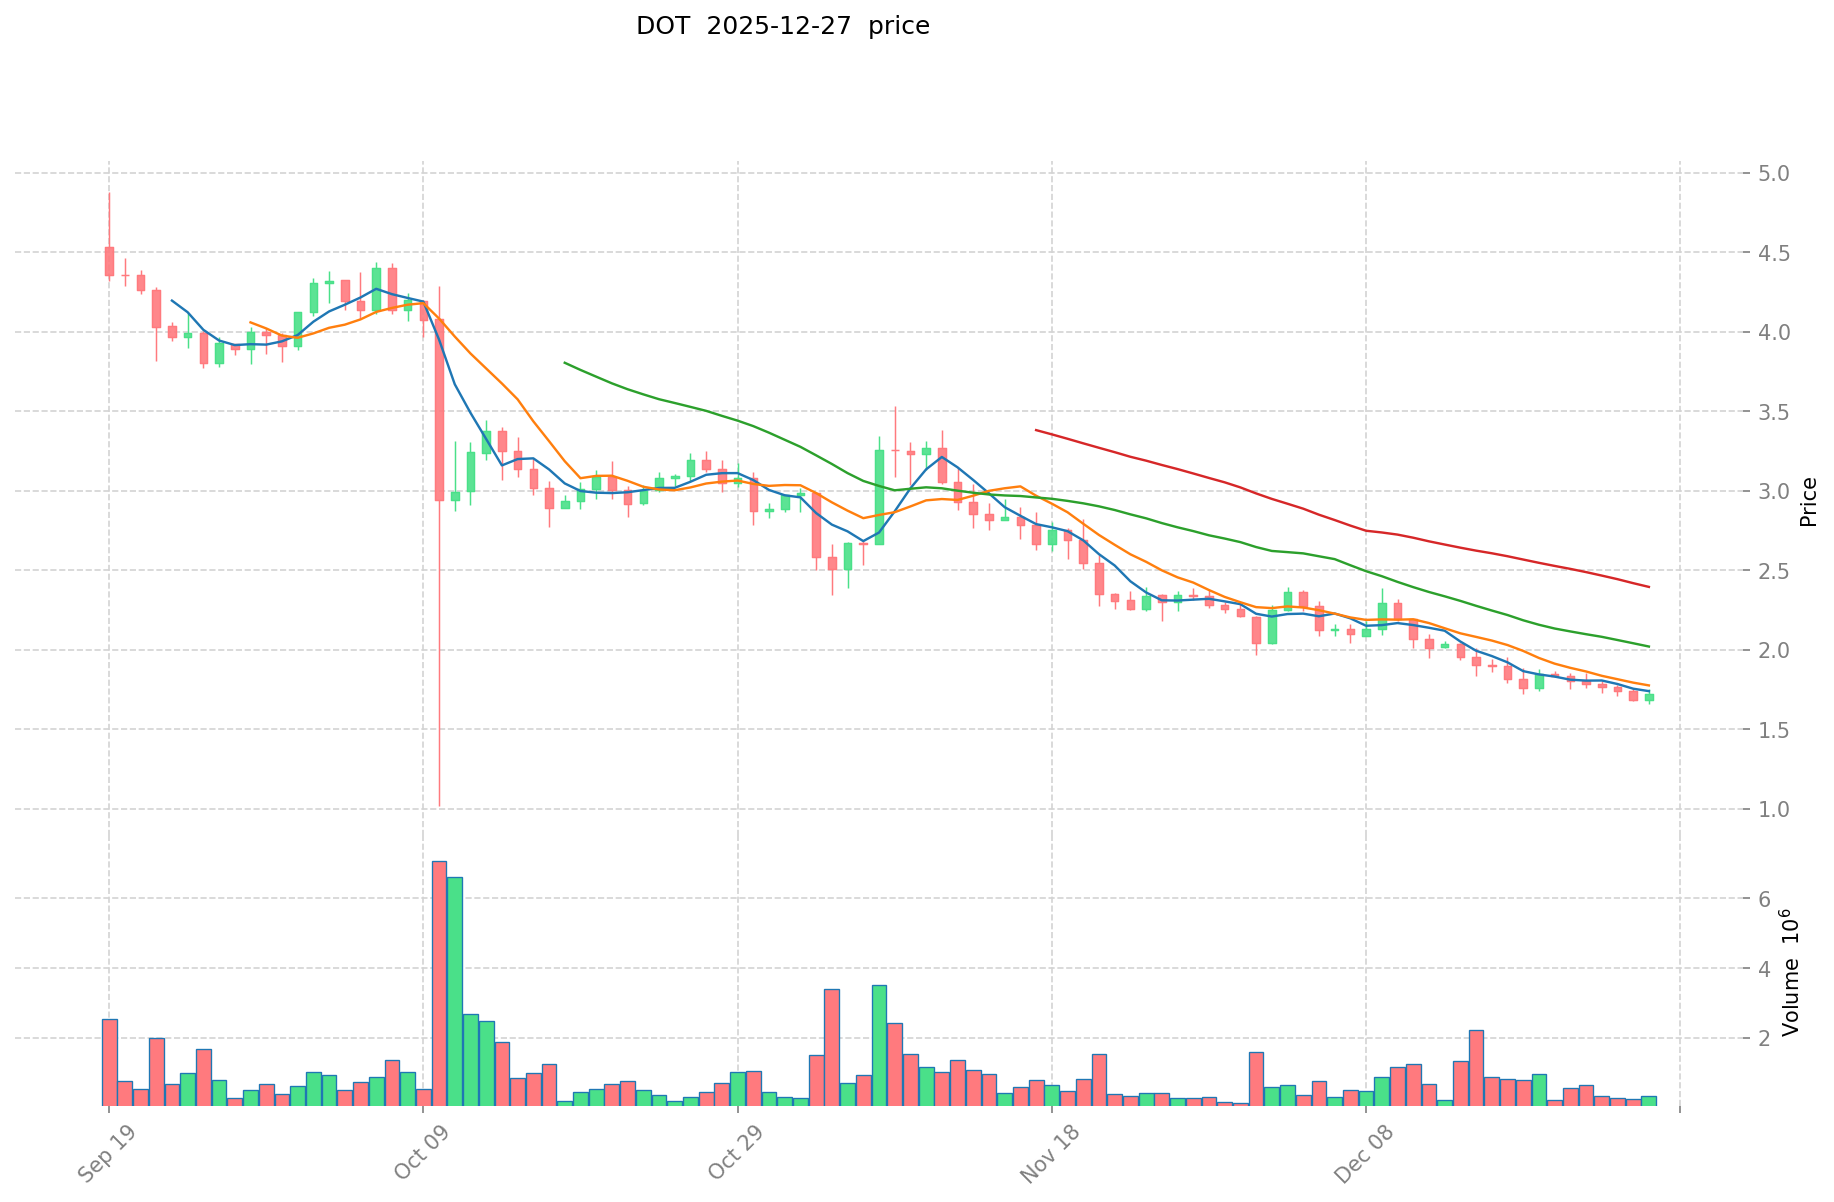
- 2021: Polkadot achieved its all-time high of $54.98 on November 4th, 2021, driven by the mainnet launch and ecosystem expansion milestones.
- Comparative analysis: In the current market cycle, Domi has declined from its peak of $0.407925 to a current level of $0.001808, representing a 99.56% decrease, while Polkadot has fallen from its high of $54.98 to $1.818, marking a 96.69% decline. Both assets demonstrate significant downward pressure from their historical peaks, though Polkadot maintains a substantially higher market valuation and trading volume.
Current Market Status (December 28, 2025)
- Domi current price: $0.001808
- Polkadot current price: $1.818
- 24-hour trading volume: Domi $11,507.55 vs Polkadot $741,414.38
- Market sentiment index (Fear & Greed Index): 23 (Extreme Fear)
Click to view real-time prices:
Polkadot (DOT) Investment Analysis Report
II. Core Factors Influencing DOT Investment Value
Supply Mechanism (Tokenomics)
- DOT Token Supply: DOT underwent a 1:100 split in 2020, increasing total supply from 10 million to 1 billion tokens. Current circulating supply stands at approximately 1.23 billion DOT, with unlimited maximum supply.
- 📌 Historical Pattern: The 2020 token split coincided with DOT's first bull market, reaching a peak of approximately $55 in 2021. However, the unlimited maximum supply structure differs from fixed-supply models, which may impact long-term value dynamics as emission continues.
Institutional Adoption and Market Applications
- Institutional Holdings: DOT maintains a relatively moderate institutional presence compared to major cryptocurrencies like Bitcoin and Ethereum. The token is listed on major centralized exchanges including Binance and OKX.
- Enterprise Adoption: Polkadot's multi-chain architecture theoretically enables cross-chain interoperability and bridge functionality. However, practical adoption remains limited compared to Layer 2 solutions that have gained significant market traction.
- Regulatory Environment: The SEC has not included DOT on its securities asset list, suggesting a relatively favorable regulatory stance compared to other major cryptocurrencies.
Technological Development and Ecosystem Building
- Polkadot's Technical Foundation: The network employs a relay chain plus parachain architecture designed to address blockchain fragmentation. Founded by Gavin Wood, former Ethereum CTO, the network prioritizes security and transaction processing speed.
- Ecosystem Status: The Polkadot ecosystem faces significant challenges in DeFi, NFT, and smart contract application development. Analysis of mainstream DeFi platforms shows limited presence of robust Polkadot-native projects. Notable infrastructure gaps include wallet convenience and user experience compared to established alternatives like MetaMask.
- Competitive Disadvantage: Polkadot's early advantages in security, transaction speed, and fees have diminished as Layer 2 solutions have proliferated. The ecosystem lacks compelling applications driving sustained user acquisition and network activity.
Macroeconomic Environment and Market Cycles
- Inflation Hedge Properties: As a technology infrastructure token rather than a monetary asset, DOT's anti-inflation characteristics remain limited compared to hard-capped supply assets.
- Monetary Policy Impact: DOT's performance correlates with broader cryptocurrency market sentiment influenced by interest rate expectations, US dollar strength, and overall risk asset appetite.
- Market Sentiment: DOT's price action over the past two years reflects weakness across the altcoin sector, with the token trading at three-year lows despite maintaining 14th position by market capitalization.
- ICO and Early Trading: Polkadot conducted its initial ICO in 2017 and subsequent token sales in 2019 near $3 levels.
- 2020-2021 Bull Market: Following the 100:1 token split, DOT entered its first major bull cycle, correlated with Bitcoin and Ethereum trends. Concept-driven appreciation occurred as side-chain and bridge technologies captured market imagination.
- Bear Market Deterioration: Over the past two years, DOT has experienced consistent one-sided decline with weak recovery attempts. Initial 2024 bounce nearly doubled the price before rapidly declining to new lows by year-end.
- Technical Resistance: Downtrend resistance positioned around $5.5 level since August 2023, indicating limited reversal potential under current market conditions.
- Ecosystem Maturity: The ecosystem exhibits weak fundamentals with minimal DeFi adoption, negligible NFT presence, and limited application development compared to Ethereum and other Layer 1 alternatives.
- User Acquisition Challenges: Despite cryptocurrency proliferation, overall user growth remains constrained. Polkadot faces difficulties in user retention and ecosystem engagement.
- Competitive Pressure: Layer 2 solutions, cross-chain bridges, and alternative multi-chain approaches have reduced Polkadot's unique value proposition. The network must overcome entrenched competitive advantages held by established platforms.
Content disclaimer: This analysis is based on available market data and reference materials as of December 28, 2025. Information presented is descriptive and not intended as investment advice. Cryptocurrency investments involve substantial risk, and investors should conduct independent due diligence and consult qualified financial advisors before making investment decisions.
III. 2025-2030 Year Price Prediction: DOMI vs DOT
Short-term Prediction (2025)
- DOMI: Conservative $0.00136876 - $0.001801 | Optimistic $0.00235931
- DOT: Conservative $1.62692 - $1.828 | Optimistic $2.61404
Mid-term Prediction (2026-2028)
- DOMI could enter accumulation phase, estimated price range $0.00160171935 - $0.00308442471183
- DOT could enter growth phase, estimated price range $2.1321792 - $3.4581503502
- Key drivers: institutional capital inflows, ETF launches, ecosystem development
Long-term Prediction (2029-2030)
- DOMI: Base scenario $0.002729579391 - $0.003154097225785 | Optimistic scenario $0.003311802087074 - $0.003401192400155
- DOT: Base scenario $2.660115654 - $3.2273853172155 | Optimistic scenario $3.395637632331 - $4.00195779334722
View detailed price predictions for DOMI and DOT
DOMI:
| 年份 |
预测最高价 |
预测平均价格 |
预测最低价 |
涨跌幅 |
| 2025 |
0.00235931 |
0.001801 |
0.00136876 |
0 |
| 2026 |
0.00297462165 |
0.002080155 |
0.00160171935 |
15 |
| 2027 |
0.002931770457 |
0.002527388325 |
0.0014658852285 |
39 |
| 2028 |
0.00308442471183 |
0.002729579391 |
0.00201988874934 |
50 |
| 2029 |
0.003401192400155 |
0.002907002051415 |
0.001482571046221 |
60 |
| 2030 |
0.003311802087074 |
0.003154097225785 |
0.002365572919338 |
74 |
DOT:
| 年份 |
预测最高价 |
预测平均价格 |
预测最低价 |
涨跌幅 |
| 2025 |
2.61404 |
1.828 |
1.62692 |
0 |
| 2026 |
2.2876506 |
2.22102 |
2.1321792 |
22 |
| 2027 |
3.065896008 |
2.2543353 |
1.893641652 |
24 |
| 2028 |
3.4581503502 |
2.660115654 |
2.31430061898 |
46 |
| 2029 |
3.395637632331 |
3.0591330021 |
1.651931821134 |
68 |
| 2030 |
4.00195779334722 |
3.2273853172155 |
2.19462201570654 |
77 |
IV. Investment Strategy Comparison: DOMI vs DOT
Long-term vs Short-term Investment Strategy
- DOMI: Suitable for investors focusing on early-stage game ecosystem development and NFT application scenarios with high risk tolerance for emerging blockchain gaming projects
- DOT: Suitable for investors seeking established infrastructure plays, interoperability solutions, and relatively more mature blockchain ecosystems with established market presence
Risk Management and Asset Allocation
- Conservative investors: DOMI 5% vs DOT 15%
- Aggressive investors: DOMI 20% vs DOT 25%
- Hedging tools: Stablecoin allocation, options strategies, cross-asset diversification with Bitcoin and Ethereum exposure
V. Potential Risk Comparison
Market Risk
- DOMI: Extreme illiquidity with 24-hour trading volume of only $11,507.55; severe price volatility and potential abandonment of gaming ecosystem; limited user adoption despite fully operational game world
- DOT: Continued altcoin sector weakness; competitive displacement by Layer 2 solutions and cross-chain bridges; technical resistance at $5.5 level indicating limited near-term reversal potential
Technology Risk
- DOMI: Game server stability and ongoing development sustainability; NFT market dependence; blockchain integration reliability for MMORPG operations
- DOT: Ecosystem fragmentation despite relay chain architecture; slower adoption of parachain infrastructure compared to competing solutions; DeFi and smart contract application development gaps
Regulatory Risk
- Global regulatory frameworks targeting cryptocurrency gaming and NFT projects may impact DOMI's business model; SEC classification and classification clarity affects both assets; enhanced scrutiny on cross-chain protocols may influence DOT's interoperability positioning
VI. Conclusion: Which Is the Better Buy?
📌 Investment Value Summary:
- DOMI Advantages: Fully operational game world with differentiating MMORPG mechanics; early-stage potential in blockchain gaming sector; lower entry price point for retail investors
- DOT Advantages: Established market position with $1.23 billion circulating supply; major exchange listings on Binance and OKX; recognized interoperability protocol with institutional infrastructure backing; favorable regulatory stance without SEC securities classification
✅ Investment Recommendations:
- Beginner investors: DOT offers more established fundamentals and reduced execution risk; consider dollar-cost averaging strategy over 12-month horizon given current market sentiment
- Experienced investors: DOMI represents speculative opportunity in gaming sector with asymmetric upside; DOT suitable for infrastructure-focused portfolio allocation with focus on 2026-2028 accumulation phase
- Institutional investors: DOT more suitable for institutional allocation given regulatory clarity and market infrastructure; DOMI remains too illiquid for meaningful institutional positioning
⚠️ Risk Disclaimer: Cryptocurrency markets exhibit extreme volatility. Both DOMI and DOT have experienced 96-99% declines from historical peaks. Current market sentiment index stands at 23 (Extreme Fear). This analysis is descriptive based on available data as of December 28, 2025, and does not constitute investment advice. Investors must conduct independent due diligence and consult qualified financial advisors before making investment decisions.
FAQ
DOMI是什么?DOT是什么?
DOMI是数字资产管理系统相关项目,致力于革新企业资产运营方式。DOT是Polkadot网络的原生代币,用于治理、抵押和交易,是跨链生态的核心。
DOMI与DOT有什么区别?
DOMI是去中心化社交代币,专注社区治理和激励;DOT是波卡网络的原生代币,用于网络验证和互操作性。两者生态应用和技术架构完全不同。
DOMI和DOT哪个更好?应该选择哪个?
DOT性能更优,交易确认速度快,适合追求效率的用户。DOMI生态应用丰富,发展潜力大。若看重速度选DOT,看重生态选DOMI。
DOMI的优势和劣势是什么?
DOMI的优势包括:生态应用广泛、社区治理分散、交易额逐步增长。劣势包括:市场认知度相对较低、技术迭代速度需加快、竞争对手众多。
DOT的优势和劣势是什么?
DOT的优势是单次命中的累计总伤害较高,适合动作类游戏场景。劣势是无法享受双爆效果加成,在某些数值配置下伤害输出会受限。
DOMI和DOT分别适用于什么场景?
DOT主要适用于浏览器和物联网设备的DNS查询加密,提升隐私性和安全性。DOMI则更适合企业网络环境,为DNS传输提供企业级加密保护。两者均用于增强DNS查询的安全性。
* The information is not intended to be and does not constitute financial advice or any other recommendation of any sort offered or endorsed by Gate.