This article provides a comprehensive comparison between FITFI and NEAR, two distinct blockchain platforms integral to Web3 development. It delves into historical price trends, market status, tokenomics, technological ecosystems, and both short-term and long-term price predictions. With a focus on investment strategies and risk management, the article evaluates which platform may be the better buy right now, based on factors like volatility, scalability, and market sentiment. Aimed at investors seeking insights into FITFI's niche in fitness finance and NEAR's established trade presence, the piece is a strategic guide to asset allocation and risk mitigation via Gate.
Introduction: FITFI vs NEAR Investment Comparison
In the cryptocurrency market, the comparison between FITFI vs NEAR has always been a topic that investors cannot ignore. The two not only show significant differences in market cap ranking, application scenarios, and price performance, but also represent different crypto asset positioning.
FITFI (FITFI): Since its launch in 2022, it has gained market recognition for its focus on fitness finance and location-based "x to earn" products.
NEAR (NEAR): Since its inception in 2020, it has been hailed as a highly scalable blockchain protocol, becoming one of the cryptocurrencies with significant global trading volume and market capitalization.
This article will comprehensively analyze the investment value comparison between FITFI vs NEAR, focusing on historical price trends, supply mechanisms, institutional adoption, technological ecosystems, and future predictions, and attempt to answer the question that investors care about most:
"Which is the better buy right now?"
I. Price History Comparison and Current Market Status
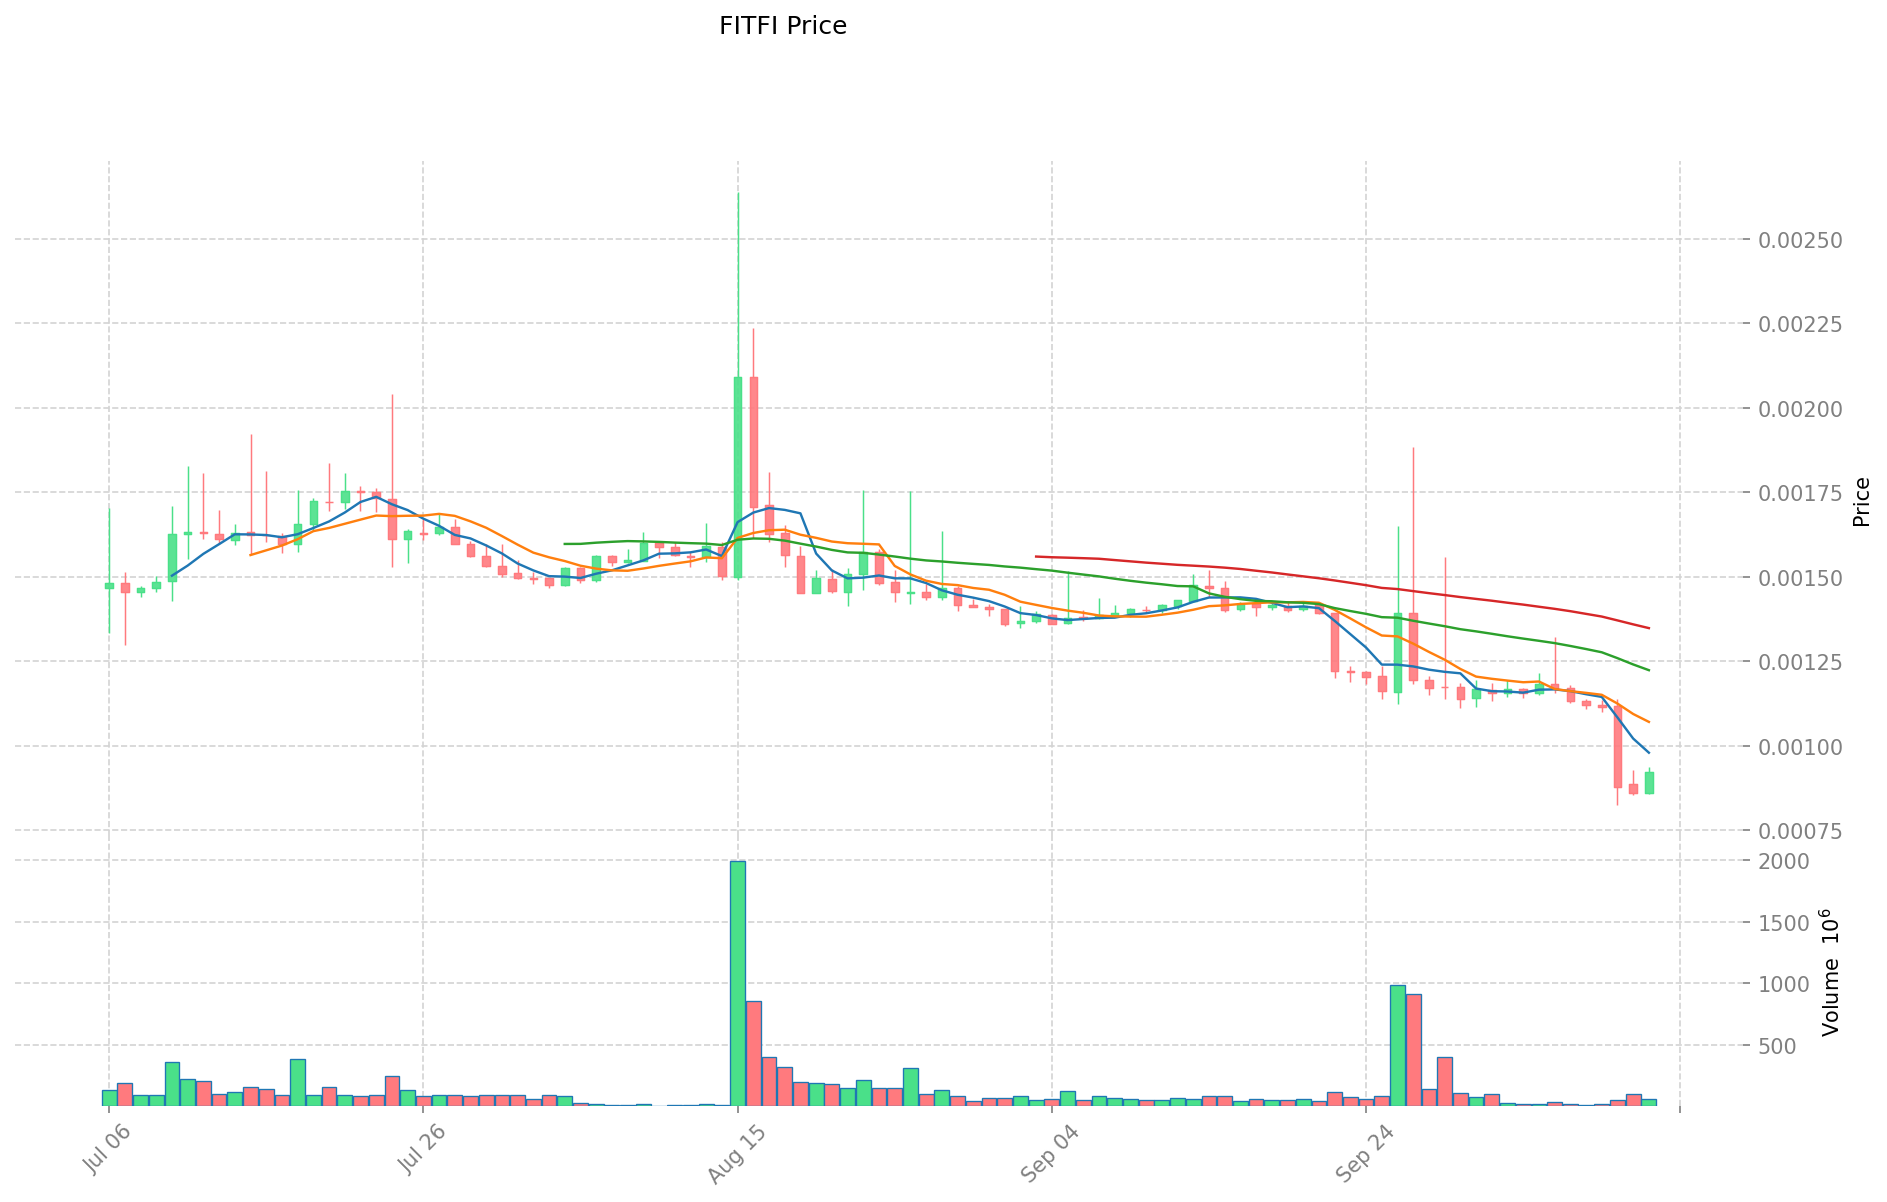
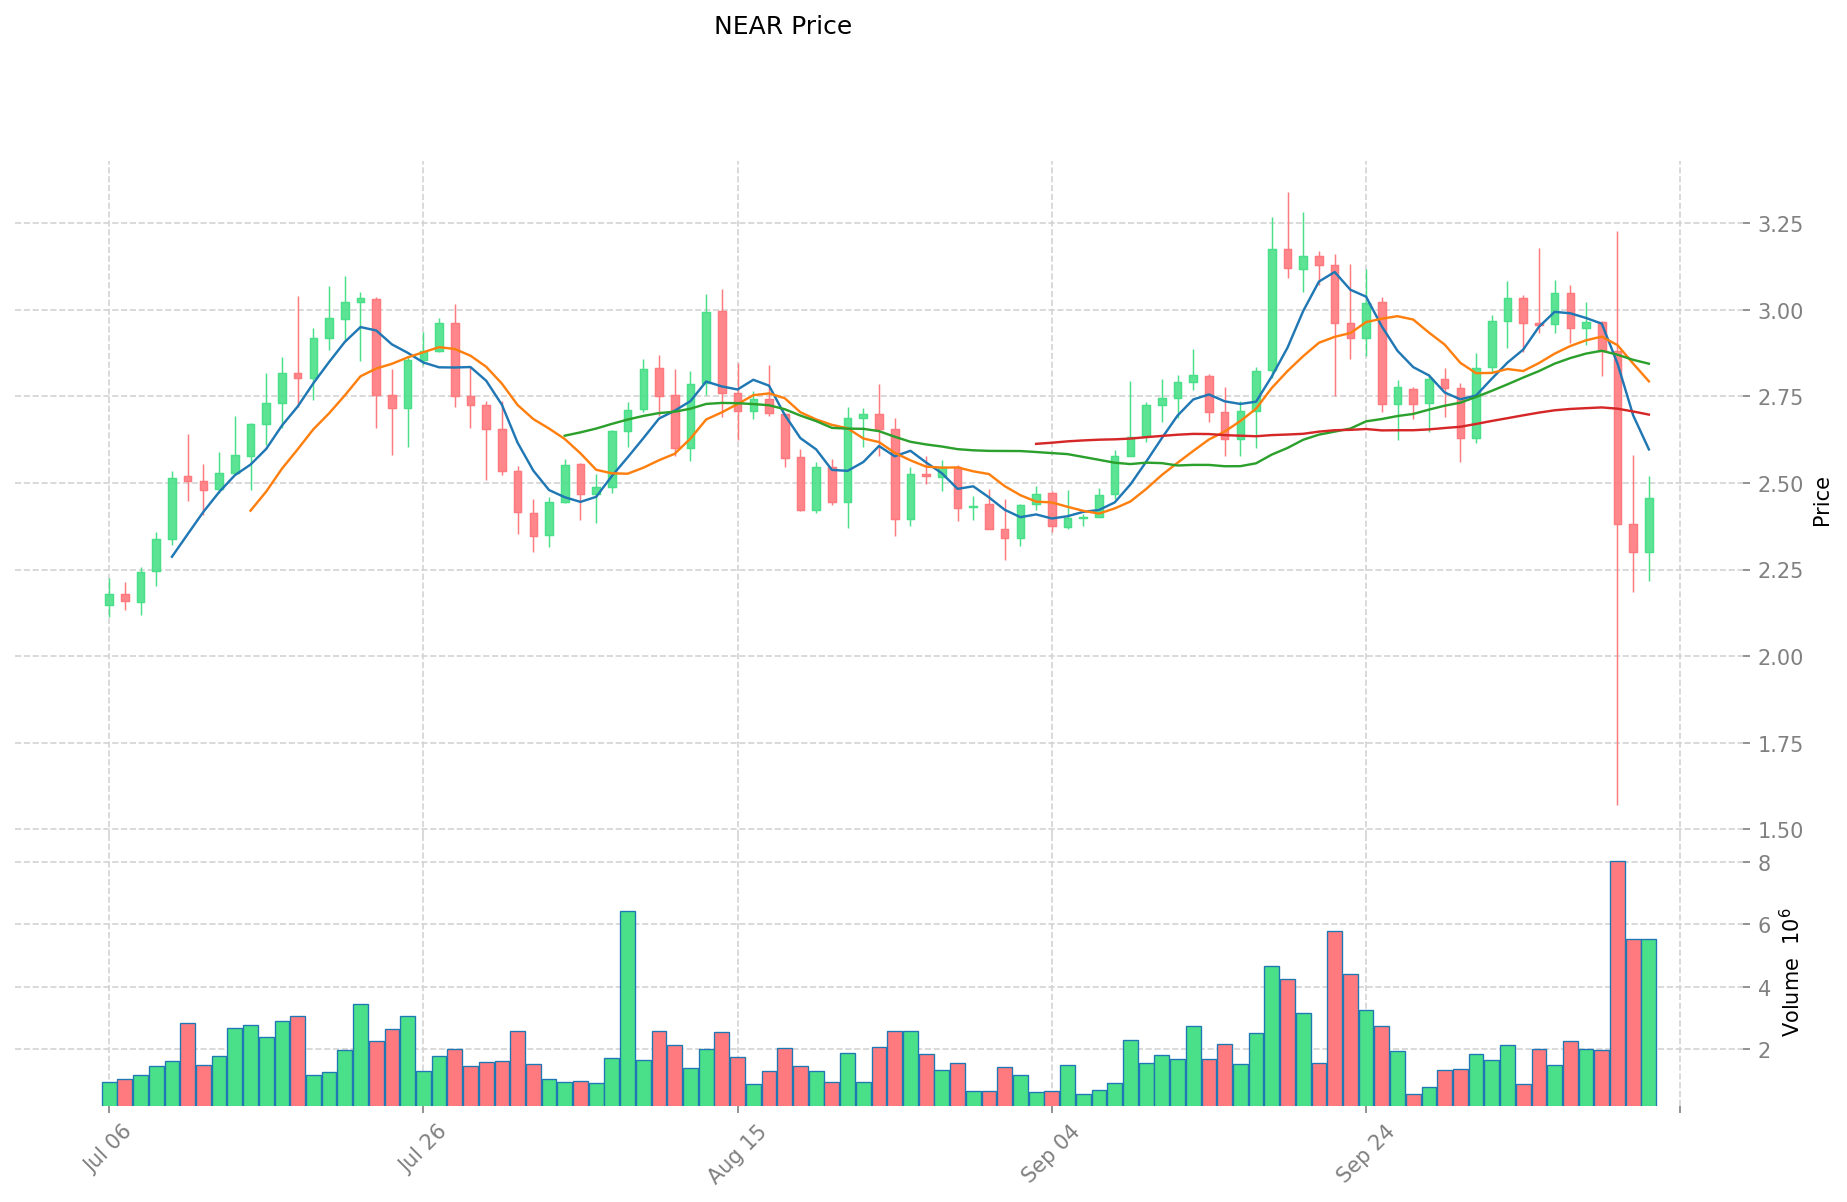
FITFI (Coin A) and NEAR (Coin B) Historical Price Trends
- 2022: FITFI reached an all-time high of $0.731881, then experienced a significant price decline.
- 2020: NEAR launched and saw price growth as the project gained traction in the blockchain space.
- Comparative analysis: During the recent market cycle, FITFI dropped from its peak of $0.731881 to a low of $0.0008582, while NEAR showed more resilience, maintaining a higher market capitalization.
Current Market Situation (2025-10-13)
- FITFI current price: $0.000932
- NEAR current price: $2.454
- 24-hour trading volume: $54,582 (FITFI) vs $12,997,399 (NEAR)
- Market Sentiment Index (Fear & Greed Index): 24 (Extreme Fear)
Click to view real-time prices:
- View FITFI current price Market Price
- View NEAR current price Market Price
Core Factors Affecting FITFI vs NEAR Investment Value
Supply Mechanism Comparison (Tokenomics)
- FITFI: Governance token with a total supply of 5 billion tokens, benefiting from ecosystem fees
- NEAR: Not specified in the provided information
- 📌 Historical Pattern: FITFI's price trajectory provides valuable insights into factors affecting its value over time, with historical patterns offering useful assessment for potential future trajectories.
Institutional Adoption and Market Applications
- Institutional Holdings: The information provided does not specify institutional preference between these tokens.
- Enterprise Adoption: FITFI serves as a core element of Step App's vibrant, competitive community and ongoing innovation
- Regulatory Attitude: No specific regulatory information provided in the reference materials.
Technical Development and Ecosystem Building
- FITFI Technical Features: Functions as a governance token within its ecosystem
- KCAL Relationship: Works alongside KCAL (in-game token) which is used for purchasing and minting Sneak sneakers in the Step App ecosystem
- Ecosystem Comparison: FITFI is positioned within the Move-to-Earn project category, similar to projects like STEPN (GMT)
Macroeconomic Factors and Market Cycles
- Performance in Inflationary Environments: Both tokens are subject to market supply and demand dynamics
- Market Trends: FITFI has shown potential for appreciation through innovative concepts and market enthusiasm
- Investment Value Factors: For FITFI, value is driven by its governance functionality, ecosystem fee benefits, and the vibrancy of its competitive community
III. 2025-2030 Price Prediction: FITFI vs NEAR
Short-term Prediction (2025)
- FITFI: Conservative $0.00052 - $0.00093 | Optimistic $0.00093 - $0.0013671
- NEAR: Conservative $1.55106 - $2.462 | Optimistic $2.462 - $3.29908
Mid-term Prediction (2027)
- FITFI may enter a growth phase, with estimated prices of $0.0008683038 - $0.001266276375
- NEAR may enter a bullish market, with estimated prices of $2.54063628 - $4.79897964
- Key drivers: Institutional capital inflow, ETF, ecosystem development
Long-term Prediction (2030)
- FITFI: Base scenario $0.001115874036766 - $0.001528594570912 | Optimistic scenario $0.001528594570912 - $0.001941315105058
- NEAR: Base scenario $3.995279522877825 - $4.7003288504445 | Optimistic scenario $4.7003288504445 - $5.781404486046735
View detailed price predictions for FITFI and NEAR
Disclaimer: These predictions are based on historical data and market analysis. Cryptocurrency markets are highly volatile and subject to change. This information should not be considered as financial advice.
FITFI:
| 年份 |
预测最高价 |
预测平均价格 |
预测最低价 |
涨跌幅 |
| 2025 |
0.0013671 |
0.00093 |
0.0005208 |
0 |
| 2026 |
0.001263405 |
0.00114855 |
0.0006087315 |
23 |
| 2027 |
0.001266276375 |
0.0012059775 |
0.0008683038 |
29 |
| 2028 |
0.001594603749375 |
0.0012361269375 |
0.000927095203125 |
32 |
| 2029 |
0.001641823798387 |
0.001415365343437 |
0.000835065552628 |
51 |
| 2030 |
0.001941315105058 |
0.001528594570912 |
0.001115874036766 |
64 |
NEAR:
| 年份 |
预测最高价 |
预测平均价格 |
预测最低价 |
涨跌幅 |
| 2025 |
3.29908 |
2.462 |
1.55106 |
0 |
| 2026 |
4.176783 |
2.88054 |
2.1027942 |
17 |
| 2027 |
4.79897964 |
3.5286615 |
2.54063628 |
43 |
| 2028 |
4.6218408327 |
4.16382057 |
3.331056456 |
69 |
| 2029 |
5.007826999539 |
4.39283070135 |
4.1731891662825 |
79 |
| 2030 |
5.781404486046735 |
4.7003288504445 |
3.995279522877825 |
91 |
IV. Investment Strategy Comparison: FITFI vs NEAR
Long-term vs Short-term Investment Strategy
- FITFI: Suitable for investors focused on fitness finance and "x to earn" projects
- NEAR: Suitable for investors seeking a more established blockchain protocol with higher market capitalization
Risk Management and Asset Allocation
- Conservative investors: FITFI: 10% vs NEAR: 90%
- Aggressive investors: FITFI: 30% vs NEAR: 70%
- Hedging tools: Stablecoin allocation, options, cross-currency combinations
V. Potential Risk Comparison
Market Risk
- FITFI: Higher volatility due to smaller market cap and newer project status
- NEAR: Relatively lower volatility, but still subject to overall crypto market trends
Technical Risk
- FITFI: Scalability of the Step App ecosystem, network stability
- NEAR: Network congestion, potential security vulnerabilities
Regulatory Risk
- Global regulatory policies may have different impacts on both tokens, with NEAR potentially facing more scrutiny due to its larger market presence
VI. Conclusion: Which Is the Better Buy?
📌 Investment Value Summary:
- FITFI advantages: Niche market in fitness finance, potential for growth in the "x to earn" sector
- NEAR advantages: Established blockchain protocol, higher market capitalization, and trading volume
✅ Investment Advice:
- New investors: Consider allocating a smaller portion to FITFI for exposure to the "x to earn" trend, with a larger allocation to NEAR for stability
- Experienced investors: Balanced approach with a tilt towards NEAR, but potentially higher allocation to FITFI for those comfortable with higher risk
- Institutional investors: Focus on NEAR due to its higher liquidity and market cap, with potential small allocation to FITFI for diversification
⚠️ Risk Warning: The cryptocurrency market is highly volatile. This article does not constitute investment advice.
None
VII. FAQ
Q1: What are the main differences between FITFI and NEAR?
A: FITFI is a newer token focused on fitness finance and "x to earn" products, while NEAR is a more established blockchain protocol with higher market capitalization and trading volume. FITFI has a total supply of 5 billion tokens and functions as a governance token, whereas NEAR's supply details were not specified in the provided information.
Q2: Which token has shown better price performance historically?
A: Based on the information provided, NEAR has shown more resilience in maintaining its value. FITFI experienced a significant price decline from its all-time high of $0.731881 to a low of $0.0008582, while NEAR maintained a higher market capitalization during the recent market cycle.
Q3: How do the current prices and trading volumes of FITFI and NEAR compare?
A: As of 2025-10-13, FITFI's price is $0.000932 with a 24-hour trading volume of $54,582. NEAR's price is $2.454 with a 24-hour trading volume of $12,997,399. NEAR has significantly higher trading volume and price.
Q4: What are the price predictions for FITFI and NEAR in 2030?
A: For FITFI, the base scenario predicts a range of $0.001115874036766 - $0.001528594570912, with an optimistic scenario of $0.001528594570912 - $0.001941315105058. For NEAR, the base scenario predicts a range of $3.995279522877825 - $4.7003288504445, with an optimistic scenario of $4.7003288504445 - $5.781404486046735.
Q5: How should investors allocate their assets between FITFI and NEAR?
A: Conservative investors might consider allocating 10% to FITFI and 90% to NEAR, while aggressive investors might allocate 30% to FITFI and 70% to NEAR. The specific allocation depends on individual risk tolerance and investment goals.
Q6: What are the main risks associated with investing in FITFI and NEAR?
A: FITFI faces higher volatility due to its smaller market cap and newer project status, as well as potential scalability issues. NEAR has relatively lower volatility but may face network congestion and potential security vulnerabilities. Both tokens are subject to regulatory risks, with NEAR potentially facing more scrutiny due to its larger market presence.
Q7: Which token might be more suitable for different types of investors?
A: New investors might consider a smaller allocation to FITFI for exposure to the "x to earn" trend, with a larger allocation to NEAR for stability. Experienced investors could take a balanced approach with a tilt towards NEAR. Institutional investors may focus more on NEAR due to its higher liquidity and market cap, with potential small allocations to FITFI for diversification.
* The information is not intended to be and does not constitute financial advice or any other recommendation of any sort offered or endorsed by Gate.


