The article compares The Graph (GRT) and Ethereum Classic (ETC) to assist investors in determining which offers better investment value. It analyzes historical price trends, supply mechanisms, institutional adoption, and technical development to assess their respective strengths. The focus is on investment strategy, market risks, and future price predictions, catering to both new and experienced investors interested in cryptocurrency markets. Key topics include price performance, technical advancements, and allocation strategies. Visit Gate for real-time prices and in-depth analysis.
Introduction: GRT vs ETC Investment Comparison
In the cryptocurrency market, The Graph (GRT) vs Ethereum Classic (ETC) comparison has always been an unavoidable topic for investors. The two not only have significant differences in market cap ranking, application scenarios, and price performance, but also represent different cryptocurrency positioning.
The Graph (GRT): Since its launch in 2020, it has gained market recognition for its role in indexing and querying blockchain data.
Ethereum Classic (ETC): Since its inception in 2016, it has been hailed as a continuation of the original Ethereum blockchain, adhering to the "code is law" principle.
This article will comprehensively analyze the investment value comparison between GRT and ETC, focusing on historical price trends, supply mechanisms, institutional adoption, technical ecosystems, and future predictions, attempting to answer the question most concerning investors:
"Which is the better buy right now?"
I. Price History Comparison and Current Market Status
GRT and ETC Historical Price Trends
- 2021: GRT reached its all-time high of $2.84 on February 12, 2021.
- 2021: ETC hit its all-time high of $167.09 on May 7, 2021.
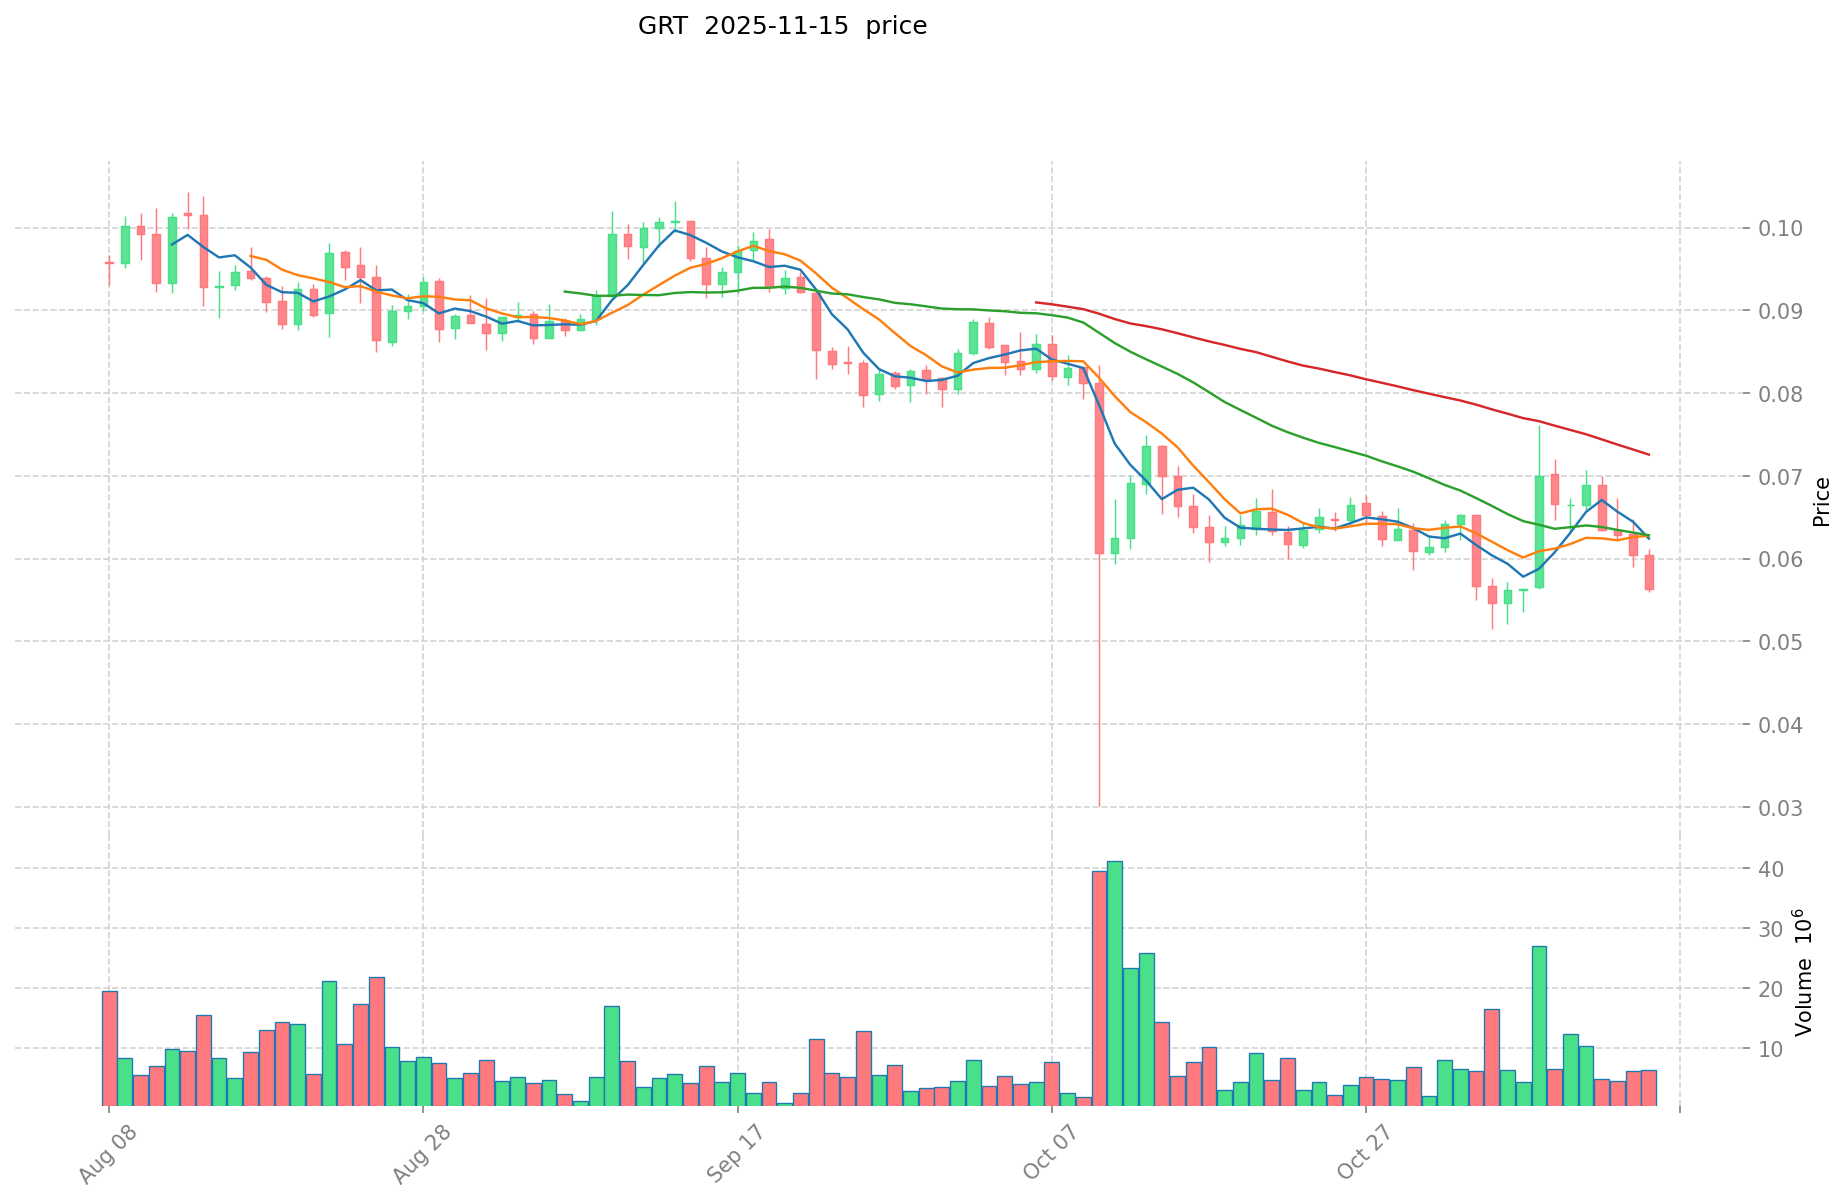
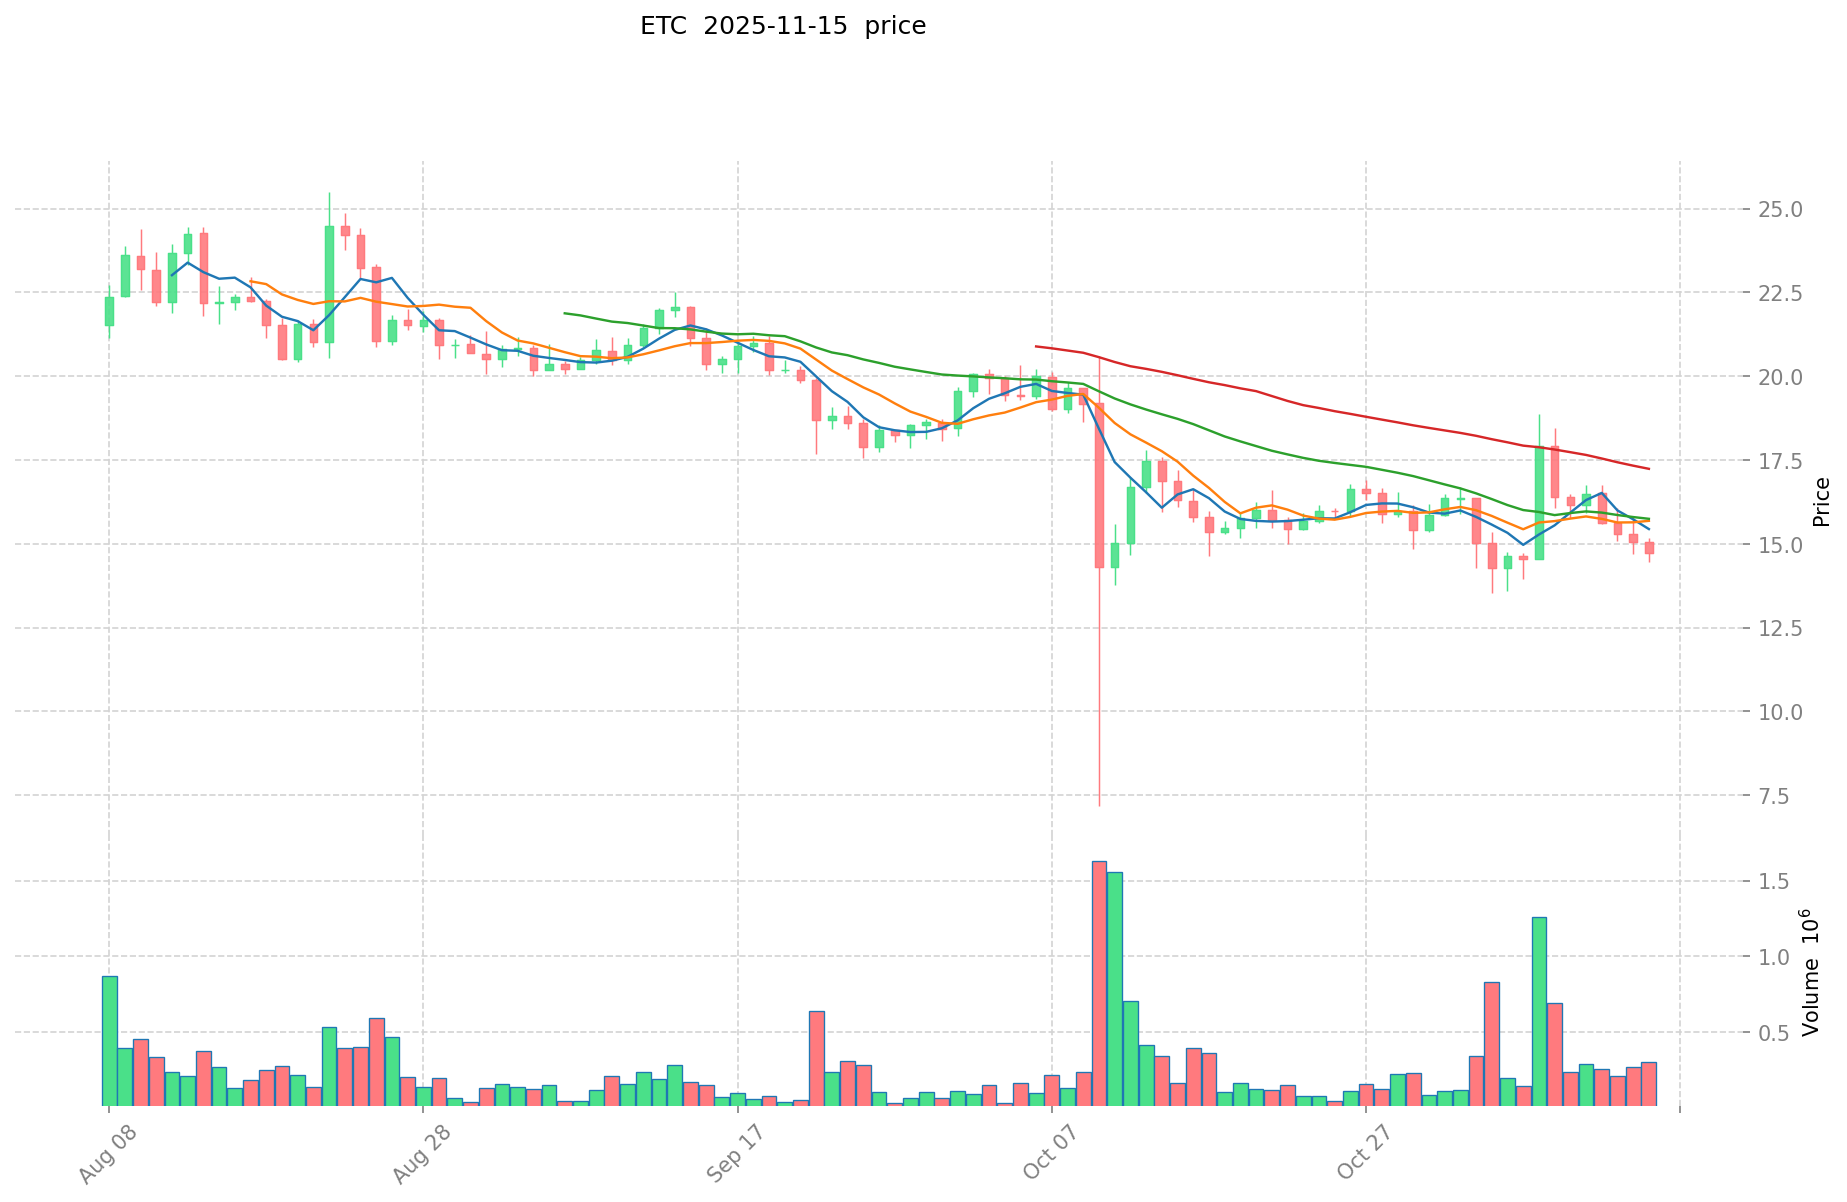
- Comparative analysis: Since their respective all-time highs, GRT has dropped from $2.84 to $0.05682, while ETC has fallen from $167.09 to $14.903.
Current Market Situation (2025-11-15)
- GRT current price: $0.05682
- ETC current price: $14.903
- 24-hour trading volume: GRT $380,179.29 vs ETC $4,177,588.68
- Market Sentiment Index (Fear & Greed Index): 10 (Extreme Fear)
Click to view real-time prices:
- Check GRT current price Market Price
- Check ETC current price Market Price
II. Core Factors Affecting The Investment Value of GRT vs ETC
Supply Mechanism Comparison (Tokenomics)
- GRT: The Graph has a capped supply of 10 billion tokens with an inflationary mechanism through indexing rewards and a deflationary element through query fees and token burns.
- ETC: Fixed supply cap of 210.7 million coins with a diminishing block reward schedule, following a deflationary model similar to Bitcoin.
- 📌 Historical Pattern: Deflationary assets like ETC tend to experience price appreciation during supply shocks, while GRT's value is more tied to network usage and query volume.
Institutional Adoption and Market Applications
- Institutional Holdings: ETC has greater institutional recognition as a legacy asset with Grayscale's ETC Trust, while GRT has seen growing interest from crypto-native funds focused on Web3 infrastructure.
- Enterprise Adoption: GRT has stronger enterprise traction with major protocols like Uniswap, Synthetix, and Aave using The Graph for data indexing, while ETC serves primarily as a store of value with limited enterprise applications.
- National Policies: Both assets face variable regulatory frameworks globally, with ETC benefiting from its Bitcoin-like classification in some jurisdictions, while GRT's utility token status creates different compliance requirements.
Technical Development and Ecosystem Building
- GRT Technical Upgrades: Subgraph migration to mainnet, implementation of Arbitrum for scaling, and development of The Graph Node to enhance decentralized indexing capabilities.
- ETC Technical Development: Maintenance of the "Code is Law" principle with security improvements following 51% attacks, including MESS (Modified Exponential Subjective Scoring) protocol.
- Ecosystem Comparison: GRT has a flourishing ecosystem supporting DeFi analytics, NFT metadata indexing, and Web3 data infrastructure, while ETC has limited smart contract development compared to Ethereum mainnet.
Macroeconomic Factors and Market Cycles
- Performance in Inflationary Environments: ETC positions itself as "digital silver" with potential inflation-hedge properties due to its capped supply, while GRT's value correlates more with Web3 adoption rates than inflation metrics.
- Macroeconomic Monetary Policy: Rising interest rates historically impact both assets negatively, with ETC showing higher correlation to traditional risk assets despite its sound money narrative.
- Geopolitical Factors: ETC benefits from censorship resistance and immutability appeal during political uncertainty, while GRT's utility increases as decentralized applications gain adoption in restrictive jurisdictions.
III. 2025-2030 Price Prediction: GRT vs ETC
Short-term Prediction (2025)
- GRT: Conservative $0.052164 - $0.0567 | Optimistic $0.0567 - $0.083916
- ETC: Conservative $8.51067 - $14.931 | Optimistic $14.931 - $17.76789
Mid-term Prediction (2027)
- GRT may enter a growth phase, with expected prices $0.0414957816 - $0.1069314372
- ETC may enter a growth phase, with expected prices $12.049540965 - $23.919238035
- Key drivers: Institutional capital inflow, ETF, ecosystem development
Long-term Prediction (2030)
- GRT: Base scenario $0.0966816180517 - $0.11112829661115 | Optimistic scenario $0.11112829661115 - $0.158913464153944
- ETC: Base scenario $17.491695055145561 - $26.107007544993375 | Optimistic scenario $26.107007544993375 - $34.200179883941321
View detailed price predictions for GRT and ETC
Disclaimer
GRT:
| 年份 |
预测最高价 |
预测平均价格 |
预测最低价 |
涨跌幅 |
| 2025 |
0.083916 |
0.0567 |
0.052164 |
0 |
| 2026 |
0.08929116 |
0.070308 |
0.05202792 |
23 |
| 2027 |
0.1069314372 |
0.07979958 |
0.0414957816 |
40 |
| 2028 |
0.099901094202 |
0.0933655086 |
0.069090476364 |
64 |
| 2029 |
0.1256232918213 |
0.096633301401 |
0.0869699712609 |
70 |
| 2030 |
0.158913464153944 |
0.11112829661115 |
0.0966816180517 |
95 |
ETC:
| 年份 |
预测最高价 |
预测平均价格 |
预测最低价 |
涨跌幅 |
| 2025 |
17.76789 |
14.931 |
8.51067 |
0 |
| 2026 |
19.619334 |
16.349445 |
8.99219475 |
9 |
| 2027 |
23.919238035 |
17.9843895 |
12.049540965 |
20 |
| 2028 |
23.675549557275 |
20.9518137675 |
12.5710882605 |
40 |
| 2029 |
29.90033342759925 |
22.3136816623875 |
16.065850796919 |
49 |
| 2030 |
34.200179883941321 |
26.107007544993375 |
17.491695055145561 |
75 |
IV. Investment Strategy Comparison: GRT vs ETC
Long-term vs Short-term Investment Strategies
- GRT: Suitable for investors focused on Web3 infrastructure and data indexing potential
- ETC: Suitable for investors seeking a store of value with Bitcoin-like properties
Risk Management and Asset Allocation
- Conservative investors: GRT: 30% vs ETC: 70%
- Aggressive investors: GRT: 60% vs ETC: 40%
- Hedging tools: Stablecoin allocation, options, cross-currency portfolios
V. Potential Risk Comparison
Market Risks
- GRT: High correlation with overall crypto market sentiment and Web3 adoption rates
- ETC: Vulnerability to market cycles and competition from other store of value cryptocurrencies
Technical Risks
- GRT: Scalability, network stability, and potential centralization of indexing nodes
- ETC: Hash rate concentration, security vulnerabilities, and historical 51% attack susceptibility
Regulatory Risks
- Global regulatory policies may impact GRT and ETC differently, with GRT potentially facing more scrutiny as a utility token and ETC benefiting from its legacy status in some jurisdictions
VI. Conclusion: Which Is the Better Buy?
📌 Investment Value Summary:
- GRT advantages: Strong ecosystem growth, increasing adoption in DeFi and Web3 applications, potential for long-term value accrual through network usage
- ETC advantages: Fixed supply cap, established brand recognition, potential store of value properties similar to Bitcoin
✅ Investment Recommendations:
- New investors: Consider a balanced approach with a slight bias towards ETC for its more established market presence
- Experienced investors: Explore a higher allocation to GRT for exposure to Web3 infrastructure growth
- Institutional investors: Evaluate GRT for its utility in data indexing services and ETC for its potential as a digital asset class
⚠️ Risk Warning: The cryptocurrency market is highly volatile, and this article does not constitute investment advice.
None
VII. FAQ
Q1: What are the main differences between GRT and ETC?
A: GRT is a utility token for The Graph's indexing and querying blockchain data, while ETC is a continuation of the original Ethereum blockchain. GRT has an inflationary mechanism with a cap of 10 billion tokens, whereas ETC has a fixed supply cap of 210.7 million coins with a deflationary model.
Q2: Which cryptocurrency has shown better price performance historically?
A: Both cryptocurrencies have experienced significant price drops since their all-time highs. GRT peaked at $2.84 in February 2021 and has fallen to $0.05682, while ETC reached $167.09 in May 2021 and is now at $14.903. In terms of percentage decline, GRT has experienced a steeper drop.
Q3: How do institutional adoption and market applications differ between GRT and ETC?
A: ETC has greater institutional recognition with products like Grayscale's ETC Trust, while GRT is gaining interest from crypto-native funds focused on Web3 infrastructure. GRT has stronger enterprise traction in DeFi and data indexing services, while ETC primarily serves as a store of value.
Q4: What are the key technical developments for each cryptocurrency?
A: GRT has focused on subgraph migration to mainnet, implementing Arbitrum for scaling, and developing The Graph Node. ETC has maintained its "Code is Law" principle and implemented security improvements like the MESS protocol following 51% attacks.
Q5: How do the long-term price predictions compare for GRT and ETC?
A: By 2030, GRT's base scenario predicts a range of $0.0966816180517 to $0.11112829661115, with an optimistic scenario up to $0.158913464153944. ETC's base scenario for 2030 is $17.491695055145561 to $26.107007544993375, with an optimistic scenario up to $34.200179883941321.
Q6: What are the main risk factors for each cryptocurrency?
A: GRT faces risks related to scalability, network stability, and potential centralization of indexing nodes. ETC is vulnerable to market cycles, competition from other store-of-value cryptocurrencies, and has a history of 51% attack susceptibility.
Q7: How should investors approach allocating between GRT and ETC?
A: Conservative investors might consider allocating 30% to GRT and 70% to ETC, while aggressive investors could opt for 60% GRT and 40% ETC. The choice depends on individual risk tolerance and belief in Web3 infrastructure versus traditional store-of-value propositions.
* The information is not intended to be and does not constitute financial advice or any other recommendation of any sort offered or endorsed by Gate.


