This article provides a detailed investment comparison between Space ID (ID) and The Graph (GRT) in the cryptocurrency market, focusing on their historical price trends, supply mechanisms, institutional adoption, technical ecosystems, and projected price movement until 2030. It targets crypto investors looking to balance short-term gains with long-term growth potential in the Web3 space. The article is structured to address key value determinants, investment strategies, potential risks, and FAQ, offering insights to determine the better buy between ID's promise in Web3 identity and GRT's established blockchain data indexing. For real-time price data, visit Gate.
Introduction: Investment Comparison of ID vs GRT
In the cryptocurrency market, the comparison between Space ID vs The Graph has been an unavoidable topic for investors. The two not only show significant differences in market cap ranking, application scenarios, and price performance, but also represent different positioning in crypto assets.
Space ID (ID): Since its launch, it has gained market recognition for its universal name service network and Web3 identity platform.
The Graph (GRT): Introduced in 2020, it has been hailed as the "Google of blockchains," serving as a decentralized protocol for indexing and querying blockchain data.
This article will comprehensively analyze the investment value comparison between Space ID vs The Graph, focusing on historical price trends, supply mechanisms, institutional adoption, technological ecosystems, and future predictions, attempting to answer the question most concerning to investors:
"Which is the better buy right now?"
I. Price History Comparison and Current Market Status
SPACE ID (ID) and The Graph (GRT) Historical Price Trends
-
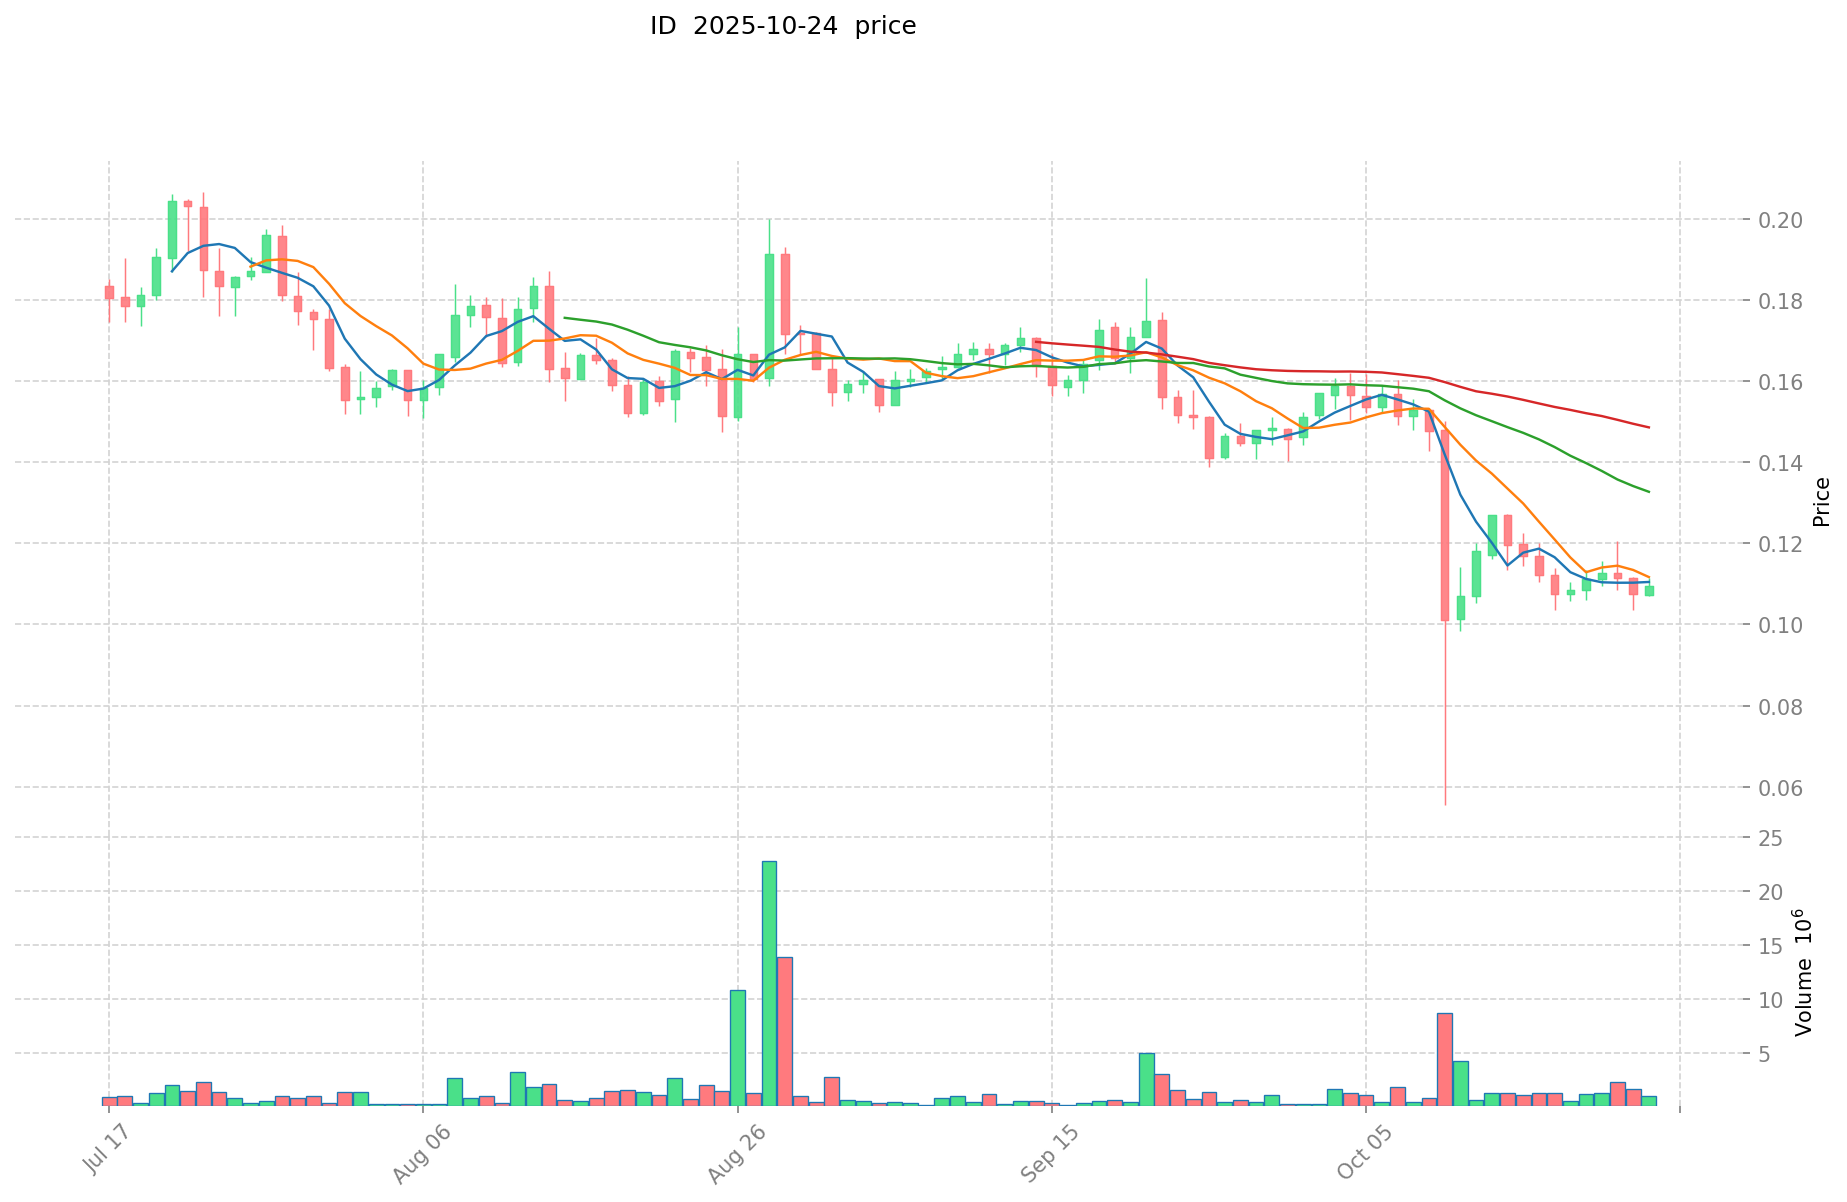
2024: SPACE ID reached its all-time high of $1.8404 on March 17, 2024, due to increased adoption of its Web3 domain services.
-
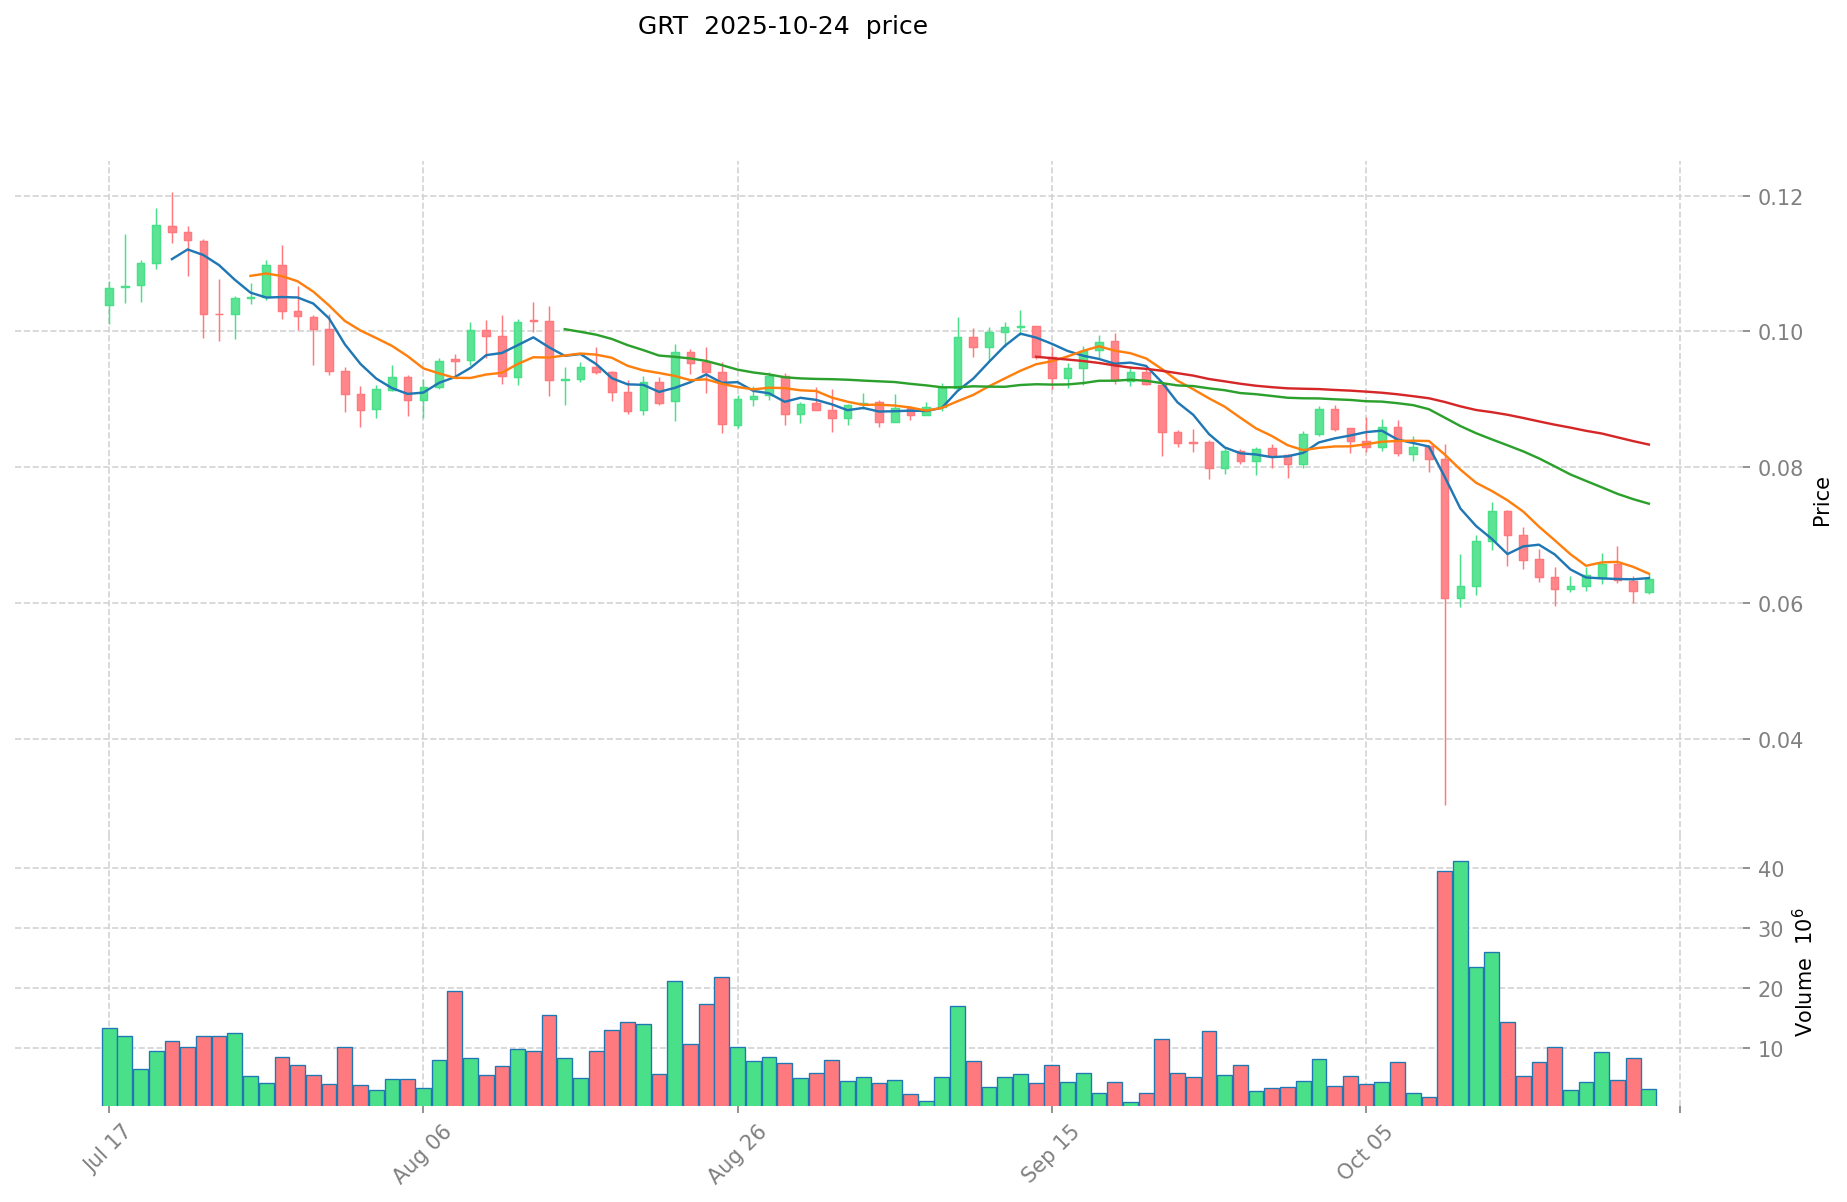
2025: The Graph experienced a significant price decline, dropping to its all-time low of $0.04626017 on October 10, 2025, possibly due to broader market conditions or project-specific challenges.
-
Comparative Analysis: During the recent market cycle, SPACE ID dropped from its peak of $1.8404 to its current price of $0.10902, while The Graph declined from its historical high of $2.84 to the current $0.06352.
Current Market Situation (2025-10-24)
- SPACE ID (ID) current price: $0.10902
- The Graph (GRT) current price: $0.06352
- 24-hour trading volume: ID $107,833.32 vs GRT $191,501.49
- Market Sentiment Index (Fear & Greed Index): 27 (Fear)
Click to view real-time prices:
- Check ID current price Market Price
- Check GRT current price Market Price
Evaluation of Core Factors Influencing ID and GRT Investment Value
I. Key Value Determinants for Crypto Assets
Long-term Growth Perspective
- Future profitability remains the primary determinant of investment value
- Capital appreciation rate serves as a critical reference point
- Overall long-term market outlook significantly impacts investment decisions
Financial Health Indicators
- Revenue growth sustainability
- Profit margin stability
- Competitive advantages in respective markets
- Market conditions and adaptability
II. Factors Affecting Investment Value: ID vs GRT
Supply Mechanisms Comparison (Tokenomics)
- Historical patterns: How supply mechanisms drive price cycle fluctuations
Institutional Adoption and Market Applications
- Enterprise applications: Comparative implementation in cross-border payments, settlements, and investment portfolios
- Regulatory landscape: Varying regulatory approaches across jurisdictions
Technical Development and Ecosystem Building
- Ecosystem comparison: Implementation status across DeFi, NFT, payment solutions, and smart contract applications
Macroeconomic Factors and Market Cycles
- Performance during inflationary environments
- Impact of monetary policy: Interest rates and USD index correlations
- Geopolitical considerations: Cross-border transaction demand and international developments
III. Value Investment Framework
Sustainable Growth Assessment
- Focus on fundamentals rather than short-term price fluctuations
- Evaluate technology adoption curves and network effects
- Analyze market penetration and potential addressable markets
Risk Management Considerations
- Market volatility profiles
- Regulatory uncertainty impact
- Technology implementation challenges
- Competitive landscape evolution
III. 2025-2030 Price Prediction: ID vs GRT
Short-term Forecast (2025)
- ID: Conservative $0.0611 - $0.1091 | Optimistic $0.1091 - $0.1593
- GRT: Conservative $0.0432 - $0.0636 | Optimistic $0.0636 - $0.0846
Mid-term Forecast (2027)
- ID may enter a growth phase, with prices estimated at $0.1377 - $0.1993
- GRT may enter a steady growth phase, with prices estimated at $0.0632 - $0.0904
- Key drivers: Institutional capital inflow, ETFs, ecosystem development
Long-term Forecast (2030)
- ID: Base scenario $0.1161 - $0.1814 | Optimistic scenario $0.1814 - $0.2050
- GRT: Base scenario $0.1020 - $0.1186 | Optimistic scenario $0.1186 - $0.1352
View detailed price predictions for ID and GRT
Disclaimer
ID:
| 年份 |
预测最高价 |
预测平均价格 |
预测最低价 |
涨跌幅 |
| 2025 |
0.1593298 |
0.10913 |
0.0611128 |
0 |
| 2026 |
0.16107588 |
0.1342299 |
0.075168744 |
23 |
| 2027 |
0.1993314015 |
0.14765289 |
0.1373171877 |
35 |
| 2028 |
0.18043183158 |
0.17349214575 |
0.128384187855 |
59 |
| 2029 |
0.18581008809825 |
0.176961988665 |
0.1663442693451 |
62 |
| 2030 |
0.204966223371236 |
0.181386038381625 |
0.11608706456424 |
66 |
GRT:
| 年份 |
预测最高价 |
预测平均价格 |
预测最低价 |
涨跌幅 |
| 2025 |
0.084588 |
0.0636 |
0.043248 |
0 |
| 2026 |
0.08594904 |
0.074094 |
0.0703893 |
16 |
| 2027 |
0.0904243176 |
0.08002152 |
0.0632170008 |
25 |
| 2028 |
0.109937565252 |
0.0852229188 |
0.046020376152 |
33 |
| 2029 |
0.13953974609718 |
0.097580242026 |
0.05269333069404 |
53 |
| 2030 |
0.135158393230212 |
0.11855999406159 |
0.101961594892967 |
86 |
IV. Investment Strategy Comparison: ID vs GRT
Long-term vs Short-term Investment Strategies
- ID: Suitable for investors focusing on Web3 identity solutions and domain services
- GRT: Suitable for investors interested in blockchain data indexing and querying infrastructure
Risk Management and Asset Allocation
- Conservative investors: ID: 30% vs GRT: 70%
- Aggressive investors: ID: 60% vs GRT: 40%
- Hedging tools: Stablecoin allocation, options, cross-currency portfolios
V. Potential Risk Comparison
Market Risk
- ID: Volatility due to relatively lower market cap and trading volume
- GRT: Susceptibility to broader blockchain and DeFi market trends
Technical Risk
- ID: Scalability, network stability
- GRT: Data indexing efficiency, potential vulnerabilities in smart contracts
Regulatory Risk
- Global regulatory policies may impact both differently, with potential scrutiny on decentralized identity solutions (ID) and data indexing services (GRT)
VI. Conclusion: Which Is the Better Buy?
📌 Investment Value Summary:
- ID advantages: Focused on Web3 identity solutions, potential for growth in domain services
- GRT advantages: Established position in blockchain data indexing, wider ecosystem integration
✅ Investment Advice:
- New investors: Consider a balanced approach with a slight tilt towards GRT for its established market position
- Experienced investors: Explore a higher allocation to ID for potential growth, while maintaining GRT for stability
- Institutional investors: Evaluate both for different portfolio needs - GRT for infrastructure exposure, ID for Web3 identity sector potential
⚠️ Risk Warning: Cryptocurrency markets are highly volatile. This article does not constitute investment advice.
None
FAQ
Q1: What are the main differences between SPACE ID (ID) and The Graph (GRT)?
A: SPACE ID focuses on universal name service and Web3 identity, while The Graph is a decentralized protocol for indexing and querying blockchain data. ID has a lower market cap and trading volume, while GRT has a more established position in the blockchain ecosystem.
Q2: How have the prices of ID and GRT performed historically?
A: ID reached its all-time high of $1.8404 in March 2024 but has since dropped to $0.10902. GRT hit its all-time low of $0.04626017 in October 2025 and is currently trading at $0.06352.
Q3: What are the price predictions for ID and GRT in the coming years?
A: By 2030, ID is predicted to reach $0.1161 - $0.2050, while GRT is expected to be in the range of $0.1020 - $0.1352, according to base and optimistic scenarios.
Q4: How do the supply mechanisms of ID and GRT compare?
A: While specific details aren't provided, both tokens' supply mechanisms influence their price cycles. Investors should research the tokenomics of each project for a more comprehensive comparison.
Q5: What are the main risks associated with investing in ID and GRT?
A: Both face market risks due to cryptocurrency volatility. ID may have higher volatility due to its lower market cap. Technical risks include scalability for ID and data indexing efficiency for GRT. Both also face potential regulatory risks, especially concerning decentralized identity solutions and data indexing services.
Q6: Which is considered the better investment: ID or GRT?
A: The better investment depends on individual risk tolerance and investment goals. GRT may be more suitable for those seeking exposure to established blockchain infrastructure, while ID might appeal to investors interested in the growing Web3 identity sector. A balanced approach is recommended for new investors.
Q7: How should investors allocate their portfolio between ID and GRT?
A: Conservative investors might consider allocating 30% to ID and 70% to GRT, while more aggressive investors could opt for 60% ID and 40% GRT. However, these allocations should be adjusted based on individual risk tolerance and market conditions.
* The information is not intended to be and does not constitute financial advice or any other recommendation of any sort offered or endorsed by Gate.


