# Article Overview: Is EYWA (EYWA) a Good Investment?
EYWA is a unified cross-chain liquidity market protocol addressing critical DeFi infrastructure gaps through its CrossCurve protocol, which solves liquidity fragmentation and insecure cross-chain communications by leveraging Curve's deep liquidity across blockchain networks. This comprehensive analysis examines EYWA's investment viability by evaluating current market performance (trading at $0.001461 with $675,075 market cap), historical price trends (99.16% annual decline), technological capabilities, and future price prospects through 2030. The report serves investors seeking clarity on risk assessment, market positioning, and long-term value potential within the cross-chain liquidity sector. Structured across project fundamentals, market risks, adoption challenges, and investor allocation strategies, this guide helps cryptocurrency investors make informed decisions regarding EYWA tokenomics and portfolio positioning on Gate.
Introduction: EYWA's Investment Position and Market Prospects
EYWA is an important asset in the cryptocurrency field. As a unified cross-chain liquidity market, it addresses two major challenges in the DeFi ecosystem: liquidity fragmentation and insecure cross-chain communications. Through its CrossCurve protocol, EYWA enables both institutional and retail users to execute trades with low slippage rates by leveraging Curve's deep liquidity across multiple blockchain networks.
As of December 28, 2025, EYWA maintains a market capitalization of approximately $675,075 USD, with a circulating supply of 462,063,833 tokens out of a total supply of 1 billion tokens. The token currently trades at $0.001461, representing a significant decline from its all-time high of $0.31307 reached on December 27, 2024. With 16,297 token holders and availability on 4 major exchanges, EYWA continues to attract attention from investors evaluating "Is EYWA a good investment?"
This comprehensive analysis examines EYWA's investment value proposition, historical price performance, future price trajectory, and associated investment risks. The article provides investors with critical insights into the token's market positioning within the broader DeFi infrastructure landscape and evaluates its potential for value appreciation amid evolving market conditions.
EYWA Cryptocurrency Analysis Report
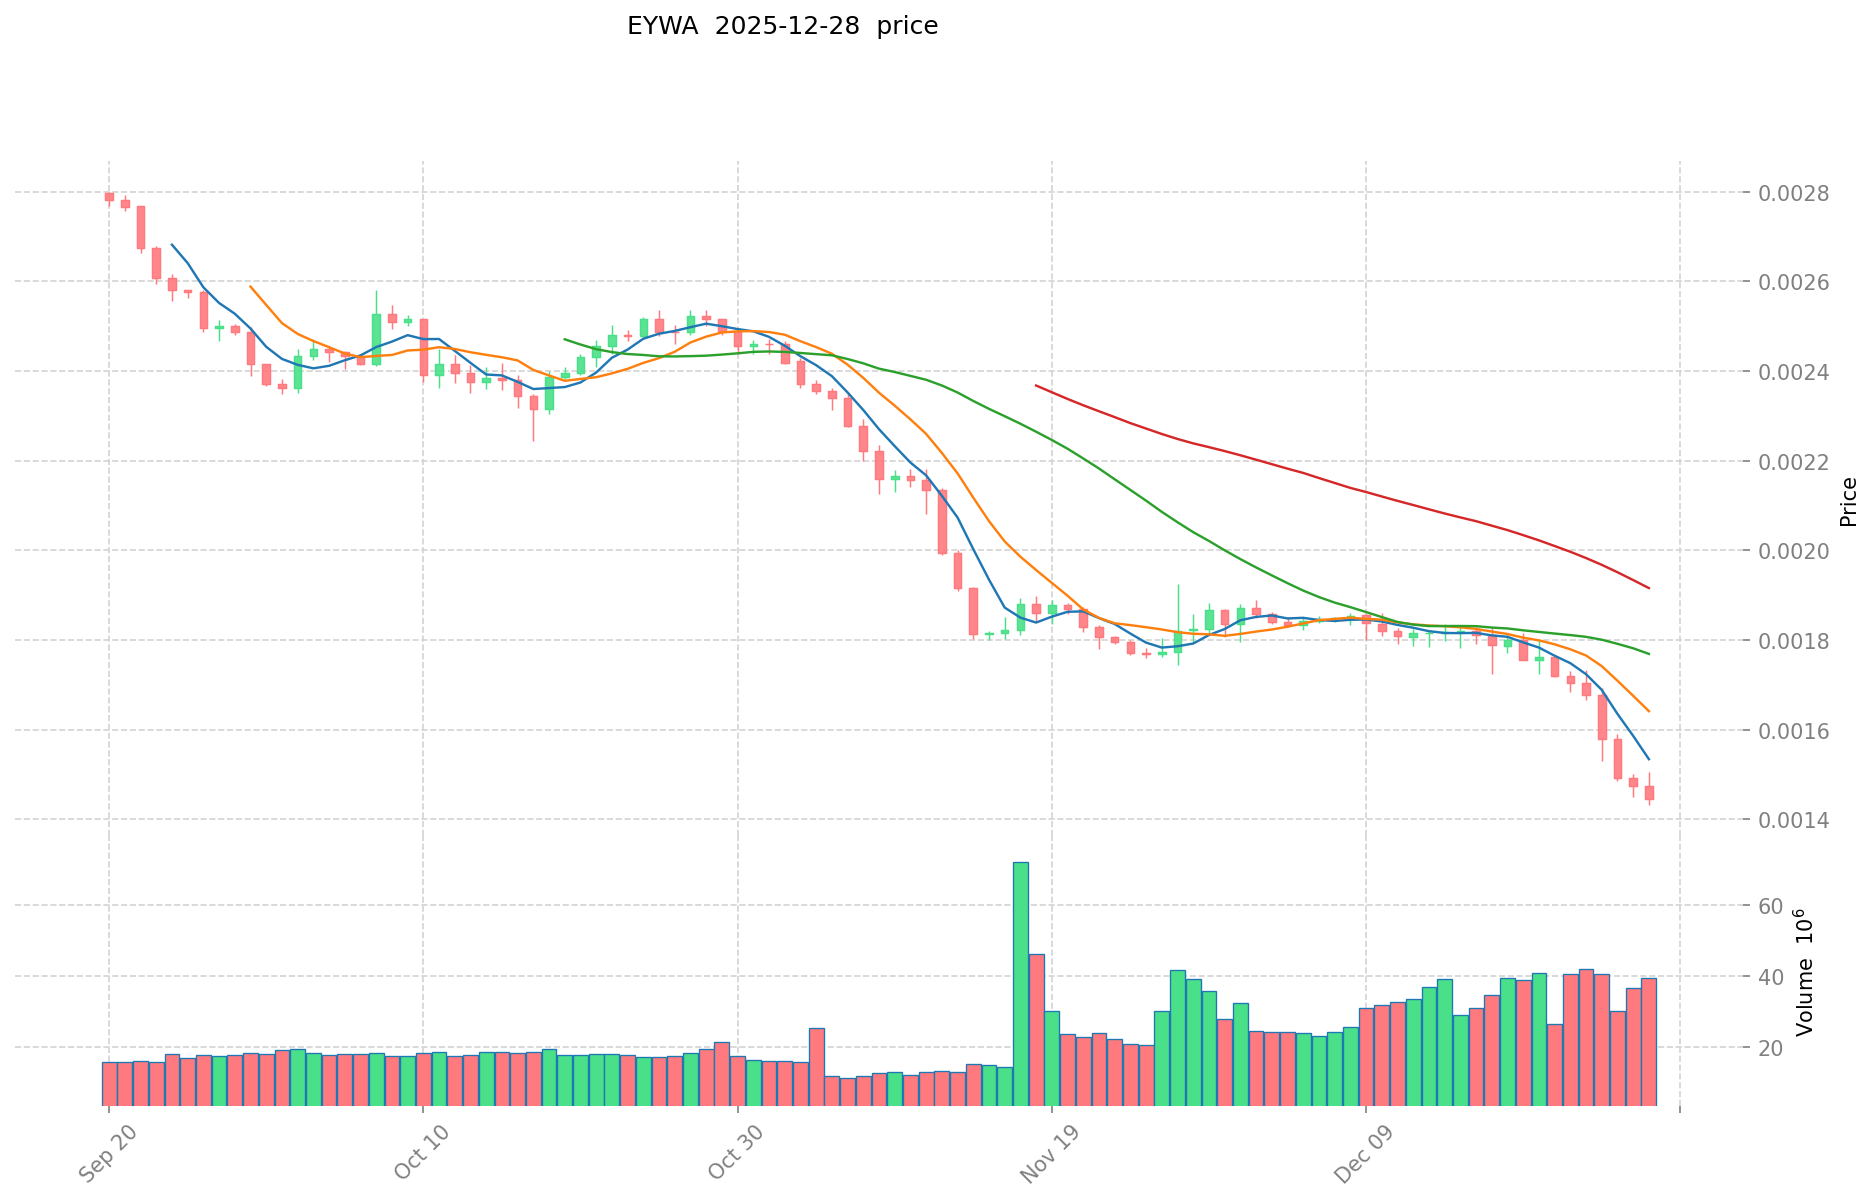
I. EYWA Price History Review and Current Investment Status
- December 27, 2024: All-time high reached at $0.31307 → Significant peak valuation
- December 28, 2025: All-time low reached at $0.001427 → Severe price depreciation
- One-Year Performance: Declined from $0.173925 to $0.001461 → 99.16% loss
Current EYWA Market Status (December 28, 2025)
- Current Price: $0.001461
- 24-Hour Price Change: -1.41% (-$0.000020894715488386)
- 7-Day Price Change: -16.61% (-$0.000291008634128792)
- 30-Day Price Change: -19.43% (-$0.000352330023581978)
- 1-Year Price Change: -99.16% (-$0.172467571428569916)
- 24-Hour Trading Volume: $55,688.22 USD
- Market Capitalization: $675,075.26 USD
- Fully Diluted Valuation: $1,461,000.00 USD
- Market Cap to FDV Ratio: 46.21%
For real-time EYWA market prices, visit Gate Price Page
II. Project Overview
Core Protocol Description
EYWA is a unified cross-chain liquidity market designed to address two major challenges in the DeFi ecosystem:
- Liquidity Fragmentation: Solving the dispersed nature of liquidity across multiple blockchain networks
- Insecure Cross-Chain Communication: Addressing security vulnerabilities in cross-chain messaging
CrossCurve Protocol: EYWA's proprietary cross-chain trading and yield protocol leverages Curve Finance's deep liquidity infrastructure to enable:
- Low slippage transactions for single asset trading
- Curve LP token trading with minimal price impact
- Services for both B2B and retail users
Token Distribution
- Total Supply: 1,000,000,000 EYWA
- Circulating Supply: 462,063,832.69 EYWA (46.21% of total)
- Circulation Ratio: 46.21%
- Active Holders: 16,297
Blockchain Integration
- Primary Chain: Arbitrum (ARBEVM)
- Contract Address: 0x7a10f506e4c7658e6ad15fdf0443d450b7fa80d7
- Block Explorer: Available on Arbiscan
Exchange Availability
- Listed on: 4 exchanges
- Gate Trading: Active
Official Resources
V. Key Metrics Summary
| Metric |
Value |
| Market Rank |
2942 |
| Market Dominance |
0.000045% |
| 1-Hour Change |
-0.21% |
| Price Range (24H) |
$0.001427 - $0.001499 |
| Launch Price |
$0.07 |
| Price Decline from Launch |
-97.91% |
Report Generated: December 28, 2025
EYWA (EYWA) Investment Analysis Report
Report Date: December 28, 2025
Data Source: Gate Crypto Data
Token: EYWA | Current Price: $0.001461 | Market Cap: $675,075.26
I. Project Overview
Project Definition and Core Value Proposition
EYWA is a unified cross-chain liquidity market designed to address two major challenges in the DeFi ecosystem: liquidity fragmentation and insecure cross-chain communications. The protocol introduces CrossCurve, a cross-chain trading and yield protocol that leverages Curve's deep liquidity infrastructure to facilitate transactions with minimal slippage for both institutional (B2B) and retail users trading single assets and Curve LP tokens.
Key Technical Architecture
- Deployment Chain: Arbitrum (ARBEVM)
- Smart Contract Address: 0x7a10f506e4c7658e6ad15fdf0443d450b7fa80d7
- Liquidity Framework: Integration with Curve protocol for cross-chain asset trading
- Target Markets: B2B platforms and retail traders seeking low-slippage cross-chain transactions
II. Core Factors Influencing EYWA as an Investment
Supply Mechanism and Scarcity (EYWA Investment Scarcity)
Supply Structure:
- Total Supply: 1,000,000,000 EYWA tokens
- Circulating Supply: 462,063,832.69 EYWA (46.21% of total supply)
- Fully Diluted Valuation: $1,461,000
- Circulating Ratio: 46.21%
Scarcity Assessment:
The token maintains substantial inflation potential with only 46% of total supply currently in circulation. This indicates a significant dilution risk as remaining tokens enter the market. The supply mechanism directly influences price dynamics and investment value sustainability. Historical observations suggest that projects with progressive token unlocks often experience price pressure during distribution phases.
Investment Implications:
Scarcity support for long-term investment value depends on the token distribution schedule and community utility demand. Without documented emission controls or burning mechanisms, the 53.79% supply overhang represents a structural headwind for price appreciation.
Market Position and Trading Activity (Market Adoption & Liquidity)
Market Metrics:
- Current Market Rank: #2,942
- Exchange Listings: 4 platforms
- 24-Hour Trading Volume: $55,688.22
- Token Holders: 16,297 addresses
- Market Dominance: 0.000045%
Liquidity Conditions:
Low trading volume relative to market cap (approximately 8.24% of market cap in 24-hour volume) indicates limited liquidity depth. This constrains institutional adoption potential and creates elevated price volatility for larger trades.
Trading Dynamics:
The presence of 16,297 holders suggests modest community participation. Concentration analysis would be necessary to assess whether whale holdings dominate price movements.
Historical Price Action:
- All-Time High: $0.31307 (December 27, 2024)
- All-Time Low: $0.001427 (December 28, 2025)
- Current Price: $0.001461
- 24-Hour Change: -1.41%
- 7-Day Change: -16.61%
- 30-Day Change: -19.43%
- 1-Year Change: -99.16%
Performance Analysis:
EYWA has experienced severe value deterioration, declining 99.16% from its all-time high within one year. The token reached its lowest price point on the current date, immediately following its historical peak. This pattern suggests extreme volatility and potential over-valuation at peak levels, followed by sustained downward pressure.
Risk Indicators:
- Significant price compression from ATH to current levels
- Consistent negative momentum across multiple timeframes
- Recent low-price discovery indicates potential capitulation
Technology and Ecosystem Development (Technology & Ecosystem for EYWA Investment)
Protocol Capabilities:
CrossCurve addresses core DeFi infrastructure gaps by:
- Reducing slippage through Curve's liquidity pools
- Enabling cross-chain asset transfers with improved security protocols
- Supporting both direct asset swaps and LP token trading
Ecosystem Integration:
The protocol's value proposition depends on:
- Adoption of cross-chain liquidity solutions in competitive DeFi markets
- Continued development and security auditing of cross-chain messaging
- Integration partnerships with major DeFi platforms and market makers
Development Status:
The whitepaper (available at provided DocsEnd link) should be consulted for technical depth, roadmap clarity, and differentiation factors relative to competing cross-chain liquidity solutions.
III. Investment Risk Assessment
Market Structure Risks
- Liquidity Risk: Limited trading volume relative to market cap restricts exit opportunities
- Concentration Risk: Token distribution with 46.21% circulating ratio indicates significant future dilution
- Market Position Risk: Rank #2,942 reflects minimal market presence and adoption metrics
- Valuation Collapse: 99.16% decline within one year demonstrates severe downside risk realization
- Volatility Risk: Extreme price swings create asymmetric risk profiles for retail investors
- Technical Risk: Recent ATL discovery suggests ongoing selling pressure
Official Resources:
Key Data Points:
- Project Launch Date: December 19, 2024
- Initial Price: $0.07
- Current Price: $0.001461 (-97.94% from launch)
Conclusion
EYWA represents a cross-chain liquidity protocol addressing legitimate DeFi infrastructure challenges. However, the investment profile is characterized by significant risk factors: severe price deterioration, limited market adoption indicators, substantial supply dilution potential, and minimal trading liquidity. Investment decisions should be contingent upon independent technical analysis, team credibility assessment, and competitive positioning analysis relative to established cross-chain protocols.
III. EYWA Future Investment Prediction and Price Outlook (Is EYWA(EYWA) worth investing in 2025-2030)
Short-term Investment Prediction (2025, short-term EYWA investment outlook)
- Conservative forecast: $0.000877 - $0.001461
- Neutral forecast: $0.001461 - $0.001800
- Optimistic forecast: $0.001800 - $0.002118
Mid-term Investment Outlook (2026-2028, mid-term EYWA(EYWA) investment forecast)
- Market stage expectations: Stabilization and gradual recovery phase with potential ecosystem expansion
- Investment return predictions:
- 2026: $0.001306 - $0.001969 (22% upside potential)
- 2027: $0.001203 - $0.001973 (28% upside potential)
- 2028: $0.001214 - $0.002754 (31% upside potential)
- Key catalysts: CrossCurve protocol adoption, expansion of cross-chain liquidity solutions, integration with additional DeFi platforms
Long-term Investment Outlook (Is EYWA a good long-term investment?)
- Base case: $0.001819 - $0.002492 (2030 forecast, assuming steady protocol adoption and moderate market growth)
- Optimistic case: $0.002567 - $0.002755 (2030 forecast, assuming breakthrough in cross-chain solutions and significant ecosystem expansion)
- Risk case: $0.000877 - $0.001200 (extreme market downturn or protocol adoption failure)
For detailed EYWA long-term investment and price predictions: Price Prediction
2025-12-28 to 2030 Long-term Outlook
- Base scenario: $0.001819 - $0.002492 USD (corresponding to steady improvement and mainstream application advancement)
- Optimistic scenario: $0.002567 - $0.002755 USD (corresponding to large-scale adoption and favorable market conditions)
- Transformative scenario: $0.003000 USD and above (if ecosystem achieves breakthrough progress and mainstream adoption)
- 2030-12-31 predicted high: $0.002567 USD (based on optimistic development assumptions)
Disclaimer: This analysis is based on historical data and prediction models. Cryptocurrency markets are highly volatile and unpredictable. Past performance does not guarantee future results. Investors should conduct thorough research and consider their risk tolerance before making investment decisions.
| 年份 |
预测最高价 |
预测平均价格 |
预测最低价 |
涨跌幅 |
| 2025 |
0.00211845 |
0.001461 |
0.0008766 |
0 |
| 2026 |
0.0019686975 |
0.001789725 |
0.00130649925 |
22 |
| 2027 |
0.0019731718125 |
0.00187921125 |
0.0012026952 |
28 |
| 2028 |
0.002754453889687 |
0.00192619153125 |
0.001213500664687 |
31 |
| 2029 |
0.002644564662829 |
0.002340322710468 |
0.001591419443118 |
60 |
| 2030 |
0.002567216997248 |
0.002492443686649 |
0.001819483891253 |
70 |
EYWA (EYWA) Investment Analysis Report
I. Executive Summary
EYWA is a unified cross-chain liquidity market protocol designed to address two primary challenges in the DeFi ecosystem: liquidity fragmentation and insecure cross-chain communications. CrossCurve, EYWA's cross-chain trading and yield protocol, leverages Curve's deep liquidity to provide both institutional and retail users with low slippage rates when trading single assets and Curve LP tokens.
Current Market Data (As of December 28, 2025):
- Current Price: $0.001461
- Market Cap: $675,075.26
- Fully Diluted Valuation: $1,461,000
- Circulating Supply: 462,063,832.69 EYWA (46.21% of total)
- Total Supply: 1,000,000,000 EYWA
- Trading Volume (24H): $55,688.22
- Market Ranking: #2,942
II. Project Overview
Project Mission and Core Mechanism
EYWA operates as a unified cross-chain liquidity market addressing critical inefficiencies in decentralized finance. The protocol solves two fundamental issues:
I. Liquidity Fragmentation - Traditional cross-chain solutions scatter liquidity across multiple blockchain networks, resulting in poor execution prices and slippage.
II. Insecure Cross-Chain Communications - Existing cross-chain bridges present security risks that expose users to potential exploits and protocol failures.
CrossCurve Protocol
CrossCurve serves as EYWA's primary application layer, functioning as both a trading and yield-generating protocol. By integrating Curve's established liquidity depth, the protocol enables:
- Low slippage rates for single asset swaps
- Efficient trading of Curve LP tokens across chains
- Support for both B2B institutional flows and retail market participation
| Timeframe |
Price Change |
Status |
| 1 Hour |
-0.21% |
Minor decline |
| 24 Hours |
-1.41% |
Slight downward pressure |
| 7 Days |
-16.61% |
Significant decline |
| 30 Days |
-19.43% |
Extended bearish pressure |
| 1 Year |
-99.16% |
Severe long-term depreciation |
Price Metrics
- All-Time High: $0.31307 (December 27, 2024)
- All-Time Low: $0.001427 (December 28, 2025)
- 24H High: $0.001499
- 24H Low: $0.001427
- Launch Price: $0.07 (December 20, 2024)
Critical Observation: EYWA has experienced a 99.16% decline over the past year, falling from its launch price of $0.07 to the current level of $0.001461. The token reached its historical peak of $0.31307 on December 27, 2024, but has since declined significantly to near all-time lows.
Market Activity
- Active Holders: 16,297
- Exchange Listings: 4 major exchanges
- Market Dominance: 0.000045% of total crypto market cap
- Circulating to Total Supply Ratio: 46.21%
IV. Investment Strategy and Risk Management
Investment Methodology
Long-term Holdings (HODL Strategy)
- Suitable for investors with high risk tolerance who believe in the cross-chain liquidity market thesis
- Requires conviction in EYWA's protocol adoption and ecosystem growth
- Appropriate for those who can withstand significant price volatility
Active Trading Approach
- Dependent on technical analysis and volatility patterns
- Applicable to experienced traders analyzing support/resistance levels
- Requires active monitoring given current price volatility
Risk Management Framework
Portfolio Allocation Guidelines
- Conservative Investors: Limit EYWA allocation to less than 1% of overall portfolio given extreme volatility and unproven protocol adoption
- Aggressive Investors: May allocate up to 3-5% for speculative exposure to cross-chain liquidity narratives
- Institutional Investors: Strategic allocation should include comprehensive due diligence on protocol security and adoption metrics
Risk Mitigation Strategies
- Multi-asset diversification with uncorrelated DeFi protocols
- Hedging instruments including stablecoin reserves and derivatives
- Dollar-cost averaging (DCA) to reduce timing risk during high volatility
Security and Storage Recommendations
- Hot wallets (MetaMask, Trust Wallet) for frequent trading amounts only
- Cold storage solutions (hardware wallets) for long-term holdings
- For institutional positions: multi-signature wallets and custodial services
V. Investment Risks and Challenges
Market Risks
- Extreme Volatility: Price fluctuations exceeding 99% annually indicate severe market instability
- Low Liquidity: Daily trading volume of $55,688 remains insufficient relative to market cap, creating execution challenges
- Price Manipulation Risk: Small market cap and limited trading volume create vulnerability to coordinated trading activity
Regulatory Risks
- Cross-chain bridge protocols face evolving regulatory scrutiny across multiple jurisdictions
- Regulatory uncertainty surrounding cross-chain asset transfers could impact protocol adoption
- Potential changes in DeFi regulation across major markets (EU, US, Asia) could affect EYWA's operational scope
Technology Risks
- Smart Contract Security: Cross-chain protocols present complex attack surfaces; any vulnerability in bridge contracts could result in significant losses
- Protocol Upgrade Failures: Implementation of new cross-chain security mechanisms could introduce unintended vulnerabilities
- Network Dependency: Reliance on Curve's infrastructure and Arbitrum blockchain creates external technical dependencies
Adoption Risk
- Unproven market demand for cross-chain liquidity solutions at current price levels
- Competition from established cross-chain protocols with greater liquidity and security track records
- Uncertain path to sustainable revenue and tokenomics model
VI. Conclusion: Is EYWA a Good Investment?
Investment Value Assessment
EYWA operates within the promising cross-chain liquidity market segment, addressing genuine DeFi infrastructure needs. However, the token's 99% annual decline, extreme volatility, and current near all-time low pricing reflect significant market skepticism regarding current valuation and protocol adoption trajectory. While the underlying cross-chain liquidity thesis possesses long-term potential, EYWA token specifically faces substantial near-term headwinds.
Investor Recommendations
✅ For Beginners:
- Avoid direct spot purchases until clearer protocol adoption signals emerge
- If interested in narrative: implement strict position sizing (maximum 0.5% portfolio allocation)
- Use secure non-custodial wallets (MetaMask, hardware wallets) for any holdings
✅ For Experienced Investors:
- Consider tactical entries during severe price declines if technical indicators confirm support formation
- Employ sophisticated position management: trailing stops, limit orders, and portfolio rebalancing protocols
- Evaluate EYWA as part of diversified DeFi infrastructure portfolio rather than standalone investment
✅ For Institutional Investors:
- Strategic allocation requires comprehensive assessment of: protocol security audits, developer activity, institutional partnerships, and cross-chain transaction volume metrics
- Due diligence should include examination of alternative cross-chain solutions and competitive landscape analysis
- Consider staged entry approach correlated with protocol adoption milestones
Risk Disclaimer
⚠️ Important Notice: Cryptocurrency investments, particularly for tokens with extreme volatility and unproven adoption metrics, carry substantial risk of total loss. EYWA's 99% annual decline demonstrates the severity of potential losses. This report is provided for informational purposes only and does not constitute investment advice, financial recommendation, or solicitation to purchase. All investment decisions should be made independently following thorough personal due diligence and consultation with qualified financial advisors. Past performance does not guarantee future results.
Report Generated: December 28, 2025
Data Source: On-chain metrics and market data providers
Disclaimer: This analysis is for informational purposes and should not be construed as investment advice.
EYWA (EYWA) Cryptocurrency Investment Analysis - FAQ
Frequently Asked Questions
Q1: What is EYWA and what problem does it solve in the DeFi ecosystem?
A: EYWA is a unified cross-chain liquidity market protocol designed to address two critical challenges in decentralized finance. First, it solves liquidity fragmentation by consolidating dispersed liquidity across multiple blockchain networks into a single unified market. Second, it addresses insecure cross-chain communications by providing secure cross-chain messaging infrastructure. The protocol's CrossCurve application leverages Curve Finance's deep liquidity to enable low-slippage trades for both institutional and retail users trading single assets and Curve LP tokens across different blockchain networks.
Q2: What is EYWA's current market performance and price status as of December 28, 2025?
A: As of December 28, 2025, EYWA trades at $0.001461 with a market capitalization of $675,075.26 USD. The token has experienced severe depreciation, declining 99.16% over the past year from its all-time high of $0.31307 (reached December 27, 2024). The current price represents a 97.91% decline from its launch price of $0.07. Daily trading volume stands at $55,688.22, with only 16,297 active token holders. The circulating supply is 462,063,832.69 EYWA out of a total supply of 1 billion tokens.
Q3: What are the key investment risks associated with EYWA?
A: EYWA presents several significant investment risks. Market risks include extreme price volatility (99% annual decline), low trading liquidity relative to market cap, and vulnerability to price manipulation given the small market cap. Technology risks involve potential smart contract vulnerabilities in the cross-chain bridge infrastructure and dependency on external platforms like Curve and Arbitrum. Adoption risks stem from unproven market demand for cross-chain liquidity solutions at current valuations and intense competition from established cross-chain protocols. Additionally, the token has 53.79% of supply not yet in circulation, creating future dilution pressure.
Q4: What is the long-term price forecast for EYWA through 2030?
A: Price predictions for EYWA through 2030 vary by scenario. Base case forecast suggests $0.001819 - $0.002492 by December 31, 2030, assuming steady protocol adoption and moderate market growth. The optimistic scenario projects $0.002567 - $0.002755 if breakthrough cross-chain solutions emerge and significant ecosystem expansion occurs. A conservative risk scenario estimates $0.000877 - $0.001200 in case of extreme market downturn or protocol adoption failure. These forecasts carry substantial uncertainty given current market conditions and unproven adoption metrics.
Q5: How much of EYWA's total token supply is currently in circulation?
A: Currently, 462,063,832.69 EYWA tokens are in circulation out of a total supply of 1,000,000,000 tokens, representing a circulation ratio of 46.21%. This means 53.79% of the total supply remains unlocked and not yet in circulation. This significant supply overhang represents a substantial dilution risk as tokens gradually enter the market through vesting schedules or other distribution mechanisms, potentially creating downward price pressure during future release phases.
Q6: Is EYWA suitable for beginner cryptocurrency investors?
A: EYWA is not recommended for beginner investors due to extreme volatility and unproven protocol adoption. The token's 99% annual decline and current near all-time low pricing demonstrate severe downside risk. Beginners should avoid direct spot purchases until clearer protocol adoption signals emerge. If interested in the cross-chain liquidity narrative, beginners should implement strict position sizing limits (maximum 0.5% of overall portfolio allocation) and use secure non-custodial wallets such as MetaMask or hardware wallets for any holdings. Experienced investors with high risk tolerance may consider tactical entries during severe price declines.
Q7: What are EYWA's primary technical specifications and deployment details?
A: EYWA is deployed on the Arbitrum blockchain network (ARBEVM) with the smart contract address 0x7a10f506e4c7658e6ad15fdf0443d450b7fa80d7. The token is listed on 4 major cryptocurrency exchanges, with active trading available on Gate. Block explorer verification is available through Arbiscan. Official resources include the project website at https://eywa.fi, the whitepaper available via DocSend, and social media presence at @eywaprotocol on X/Twitter.
Q8: What portfolio allocation strategy is recommended for EYWA investment?
A: Portfolio allocation recommendations depend on investor risk profile. Conservative investors should limit EYWA to less than 1% of total portfolio allocation given extreme volatility and unproven adoption. Aggressive investors with high risk tolerance may allocate 3-5% for speculative exposure to cross-chain liquidity narratives. Institutional investors should conduct comprehensive due diligence including security audits, developer activity assessment, and competitive landscape analysis before strategic allocation. All investor categories should implement diversification with uncorrelated DeFi protocols, employ dollar-cost averaging to reduce timing risk, and maintain strict risk management protocols including position sizing limits and stop-loss orders.
Disclaimer: This FAQ is provided for informational purposes only and does not constitute investment advice, financial recommendation, or solicitation to purchase EYWA tokens. Cryptocurrency investments carry substantial risk of total loss. Past performance does not guarantee future results. All investment decisions should be made independently following thorough personal due diligence and consultation with qualified financial advisors.
Report Generated: December 28, 2025
* The information is not intended to be and does not constitute financial advice or any other recommendation of any sort offered or endorsed by Gate.