This article provides a comprehensive analysis of Forta (FORT), focusing on its role in blockchain security and potential investment returns. It explores FORT's price history, current value, market performance, and projections, aimed at investors considering Forta within their portfolios. The analysis addresses market risks, liquidity challenges, and technological adoption, making it suitable for cryptocurrency investors seeking secure infrastructure investments in Web3. Readers can expect a clear breakdown of Forta's investment potential, backed by historical data and future outlooks, emphasizing its functionality as a decentralized security network.
Introduction: Forta (FORT) Investment Position and Market Outlook
FORT is an important asset in the cryptocurrency field. Since its launch in June 2022, it has achieved significant accomplishments in blockchain security and operational monitoring. As of December 21, 2025, FORT's market capitalization stands at approximately $20.99 million, with a circulating supply of around 623.39 million tokens and a current price hovering around $0.02099. Leveraging its positioning as "a real-time detection network for security and operation monitoring of blockchain activities," FORT has gradually become a focal point when investors discuss whether Forta is a good investment. The token operates as an ERC-20 token on the Ethereum mainnet and is also available on Polygon, facilitating its integration across multiple blockchain ecosystems.
Currently ranked 1048th in the cryptocurrency market, FORT represents a niche but essential infrastructure component within the Web3 security landscape. The token functions within a decentralized monitoring network that detects threats and anomalies across DeFi protocols, NFT platforms, governance systems, bridges, and other Web3 applications in real-time. This critical security function positions FORT as a utility token with inherent demand from protocols and investors seeking to safeguard their assets.
This article will provide a comprehensive analysis of FORT's investment value, historical price trends, future price forecasts, and investment risks to serve as a reference for investors considering their allocation to this blockchain security infrastructure token.
Forta (FORT) Cryptocurrency Asset Research Report
I. Forta (FORT) Price History Review and Current Investment Value Status
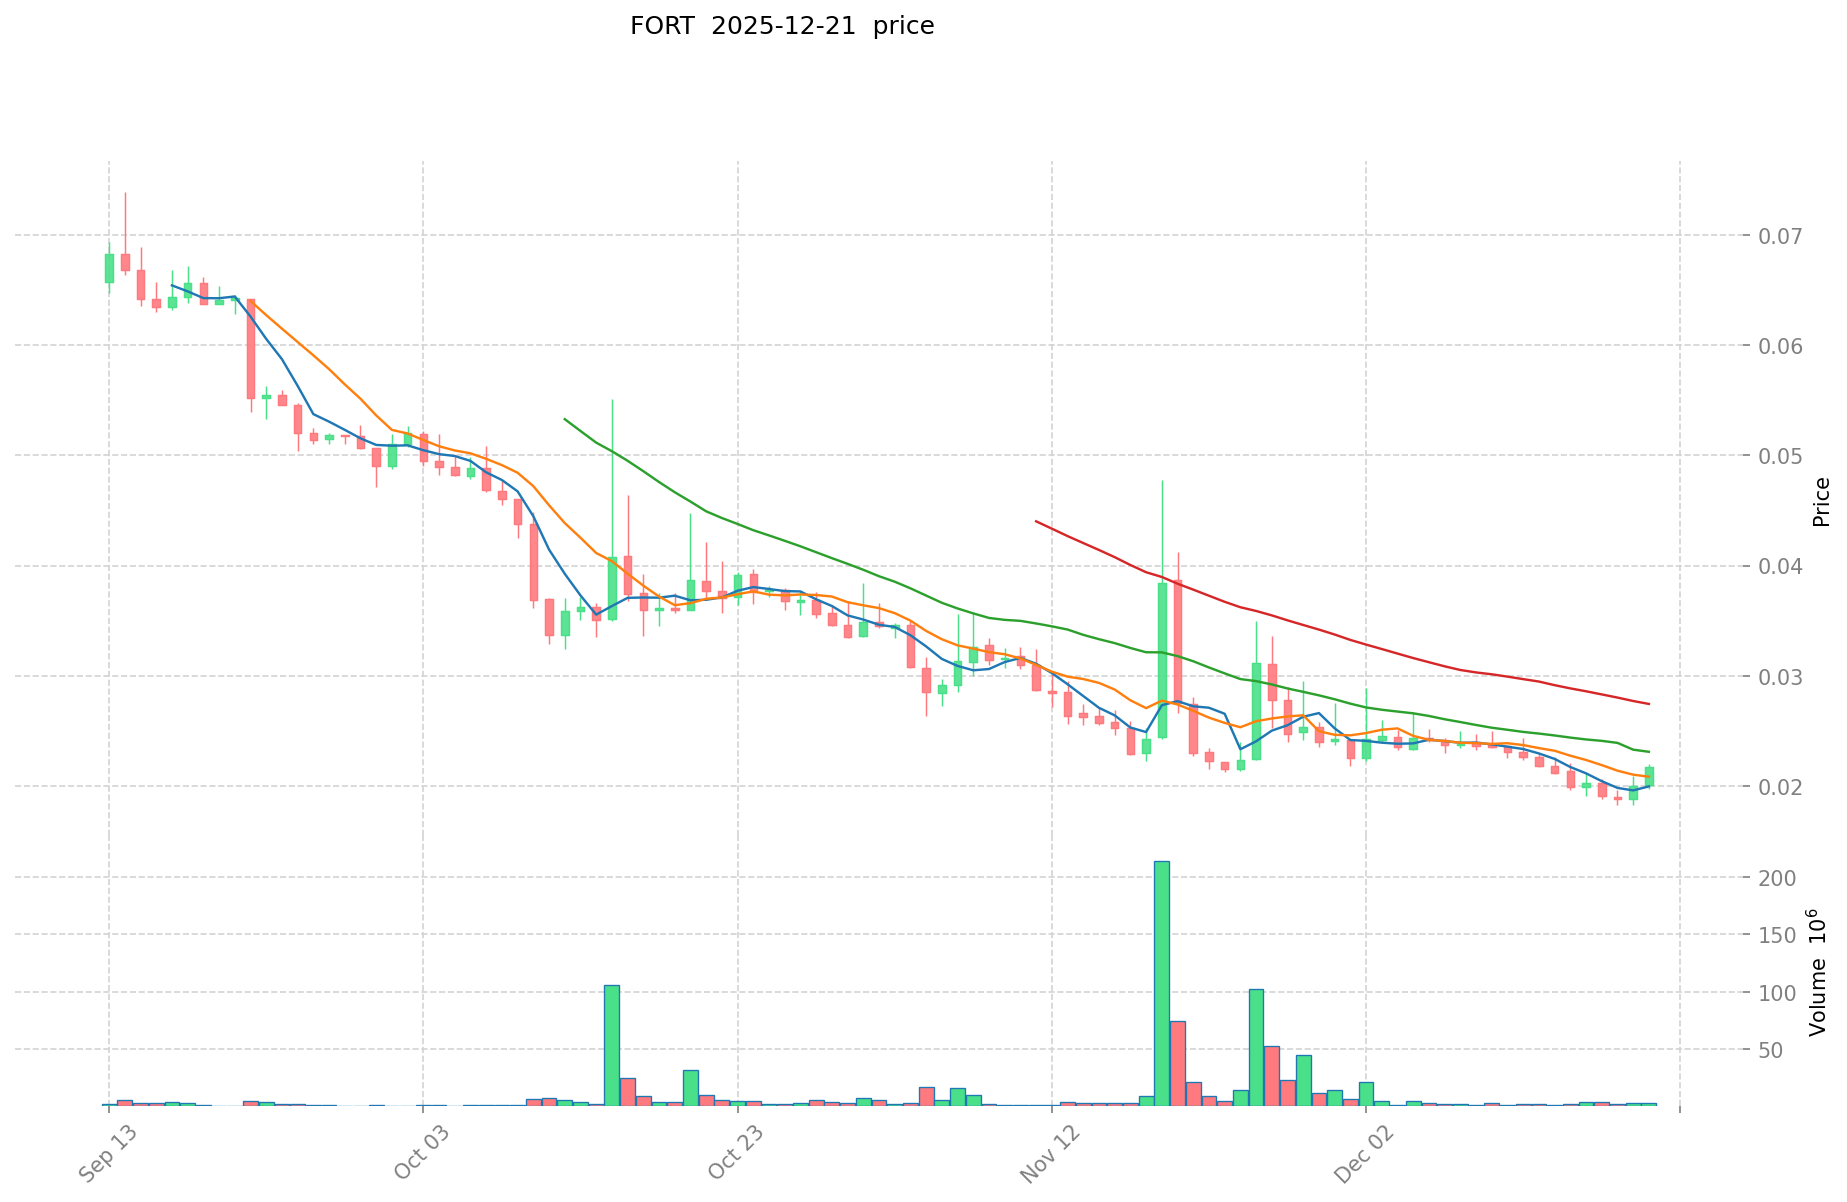
FORT Historical Price Trends and Investment Returns
- June 2022: Reached all-time high of $0.964645 on June 16, 2022 → Early investors achieved substantial returns
- 2023: Market weakness → Price declined from peak to $0.02257419 (November 18, 2023 low)
- 2025: Partial recovery → As of December 21, 2025, price rebounded to $0.02099
Current FORT Investment Market Status (December 21, 2025)
- Current Price: $0.02099
- 24-Hour Price Change: +2.63% ($0.000538 increase)
- 7-Day Price Change: -3.96%
- 30-Day Price Change: -21.48%
- 1-Year Price Change: -83.39%
| Metric |
Value |
| 24-Hour Trading Volume |
$81,763.31 |
| Market Capitalization |
$20,990,000 |
| Circulating Supply |
623,391,380.28 FORT |
| Total Supply |
1,000,000,000 FORT |
| Market Capitalization Ratio |
62.34% of fully diluted valuation |
| 24-Hour High |
$0.02261 |
| 24-Hour Low |
$0.02048 |
| All-Time High |
$0.964645 (June 16, 2022) |
| All-Time Low |
$0.01832485 (December 19, 2025) |
| Market Dominance |
0.00065% |
| Token Holders |
5,404 |
II. Project Overview
Project Introduction
Forta is a real-time detection network designed for security and operational monitoring of blockchain activities. As a decentralized monitoring network, Forta detects threats and anomalies across DeFi, NFT, governance, bridges, and other Web3 systems in real-time.
Through timely and relevant alerts regarding the safety and health of owned or dependent systems, the protocol and investors can respond quickly to eliminate threats and prevent or minimize financial losses.
Token Specifications
- Token Name: FORT
- Token Type: ERC-20 token on Ethereum mainnet
- Contract Address (Ethereum): 0x41545f8b9472D758bB669ed8EaEEEcD7a9C4Ec29
- Contract Address (Polygon): 0x9ff62d1FC52A907B6DCbA8077c2DDCA6E6a9d3e1
- Launch Date: June 15, 2022
- Initial Launch Price: $0.25
III. Market Data and On-Chain Metrics
Token Distribution
| Metric |
Value |
| Circulating Supply |
623,391,380.28 FORT (62.34% of total) |
| Total Supply |
1,000,000,000 FORT |
| Maximum Supply |
1,000,000,000 FORT |
| Fully Diluted Market Cap |
$20,990,000 |
- Exchange Listings: 8 major exchanges
- Market Rank: 1,048
IV. Official Resources and Links
Official Channels
Block Explorers
V. Key Observations
Market Performance Context
The FORT token has experienced significant volatility since its launch. After reaching its peak of $0.9646 in mid-2022, the token declined substantially through 2023 and into 2025, with the all-time low recorded on December 19, 2025. The recent modest recovery to $0.02099 represents a partial rebound from these lows, though the token remains trading significantly below its historical highs.
Current Market Position
With a market capitalization of approximately $21 million and a relatively small trading volume of $81,763 in the past 24 hours, FORT maintains a minor position within the broader cryptocurrency ecosystem. The token's dominance ratio of 0.00065% reflects its limited market share.
Data Updated: December 21, 2025, 14:21:25 UTC
Forta (FORT) Investment Analysis Report
I. Project Overview
Forta is a real-time detection network designed for security and operational monitoring of blockchain activities. As a decentralized monitoring network, Forta detects threats and anomalies across DeFi, NFT, governance, bridges, and other Web3 systems in real time. Through timely and relevant alerts regarding the safety and health of systems, protocols and investors can respond quickly to eliminate threats and prevent or minimize fund losses.
FORT is an ERC-20 token deployed on the Ethereum mainnet, with additional presence on the Polygon network.
Token Metrics (As of December 21, 2025)
| Metric |
Value |
| Current Price |
$0.02099 |
| 24-Hour Change |
+2.63% |
| Market Capitalization |
$13,084,985.07 |
| Fully Diluted Valuation |
$20,990,000.00 |
| Circulating Supply |
623,391,380.28 FORT |
| Total Supply |
1,000,000,000 FORT |
| Circulating Ratio |
62.34% |
| Market Dominance |
0.00065% |
| 24-Hour Volume |
$81,763.31 |
| Market Ranking |
1,048 |
| Number of Holders |
5,404 |
| Trading Exchanges |
8 |
Historical Price Points:
- All-Time High: $0.964645 (June 16, 2022)
- All-Time Low: $0.01832485 (December 19, 2025)
- Initial Launch Price: $0.25 (June 16, 2022)
Price Trends:
| Timeframe |
Change |
Absolute Change |
| 1 Hour |
+0.29% |
+$0.000061 |
| 24 Hours |
+2.63% |
+$0.000538 |
| 7 Days |
-3.96% |
-$0.000865 |
| 30 Days |
-21.48% |
-$0.005742 |
| 1 Year |
-83.39% |
-$0.105380 |
FORT has experienced significant long-term depreciation, declining 83.39% over the past year from approximately $0.125 to the current $0.02099. The token reached its all-time low on December 19, 2025, just two days before the data collection date.
II. Core Factors Affecting FORT Investment Potential
Supply Mechanism and Scarcity
FORT operates with a fixed maximum supply of 1,000,000,000 tokens. The circulating supply currently represents 62.34% of total supply, indicating that approximately 376.6 million tokens remain in reserve or are subject to vesting schedules. This relatively high inflation rate—with over one-third of tokens not yet in circulation—represents a potential source of downward price pressure as additional tokens enter the market.
The significant gap between current price ($0.02099) and historical pricing ($0.25 launch price, $0.964645 ATH) suggests that inflationary supply dynamics may have contributed to the token's substantial depreciation.
Technical Architecture and Network Utility
Forta operates as a decentralized monitoring infrastructure designed to detect security threats and operational anomalies across blockchain networks. The network's utility derives from its role in:
- Real-time threat detection across DeFi protocols
- NFT ecosystem monitoring
- Governance system anomaly detection
- Cross-chain bridge security monitoring
- General Web3 system operational oversight
The fundamental value proposition rests on whether protocols and blockchain participants find the monitoring service essential enough to generate sustained demand for FORT tokens through participation in the network economy.
Market Adoption and Institutional Interest
Current market indicators show limited institutional engagement:
- Only 5,404 FORT token holders suggests a relatively concentrated holder base
- Trading activity across 8 exchanges indicates moderate but not extensive exchange support
- Daily trading volume of $81,763 represents minimal liquidity relative to market capitalization
- Market capitalization of $13.08 million ranks FORT at position 1,048 by market cap
The limited number of holders and modest trading volume suggest that Forta has not achieved significant mainstream adoption within the cryptocurrency investment community.
Macroeconomic Environment Considerations
The cryptocurrency sector's broader market conditions influence FORT's investment profile:
- Ongoing regulatory uncertainty in major jurisdictions affects sentiment toward blockchain security infrastructure
- Competition from established security providers in traditional IT sectors
- Integration challenges with existing DeFi and Web3 ecosystems
- Dependency on overall cryptocurrency market health and protocol security spending priorities
Ecosystem Development Status
Forta's long-term investment thesis depends on continued development and adoption of its detection network. Key considerations include:
- Active development presence on GitHub indicates ongoing technical work
- Community presence on Twitter and Facebook suggests ongoing project engagement
- Integration into Web3 security infrastructure requires sustained protocol partnerships
- Network effect dynamics—the value of detection services increases with the number of monitored protocols
III. Investment Sentiment and Price Predictions
Analyst predictions for FORT show divergent outlooks:
Short-term (2025) Forecasts:
- Price range estimates: $0.0199 to $0.0263
- Technical analysis signals: Multiple sources indicate bearish technical indicators
- Current trading patterns: "Strong Sell" signals from moving average analysis
Medium to Long-term (2030-2032) Forecasts:
- Predicted price ranges: $0.076 to $0.20735
- Base scenario for 2030: $0.076 to $0.135
- Timeframe expectations: 2025-2031 identified as significant growth period
These predictions reflect substantial uncertainty, with forecasts ranging from modest appreciation to potential 2-3x increases over multi-year horizons, though no consensus exists among analysts.
IV. Risk Factors
Liquidity Risk
The combination of modest daily trading volume ($81,763) relative to market cap suggests potential liquidity challenges for significant position accumulation or liquidation.
Dilution Risk
With 376.6 million unreleased tokens (37.66% of supply), future token releases could exert downward pressure on price if market demand does not increase proportionally with supply expansion.
Competitive Risk
Forta operates in the blockchain security monitoring space, facing competition from both specialized security providers and integrated security features offered by major protocols.
Adoption Risk
The investment thesis depends on protocols and blockchain participants valuing real-time threat detection services sufficiently to justify sustained token holdings or network participation.
Market Risk
The 83.39% annual depreciation and recent all-time low prices indicate that market sentiment regarding FORT remains negative despite the project's continued operations.
V. Summary
Forta represents a specialized infrastructure project within the blockchain security domain. The project maintains active development and operates a functional network. However, current market metrics—including substantial long-term price depreciation, limited holder base, modest trading volume, and negative technical signals—suggest cautious positioning regarding near-term investment prospects.
Longer-term investment potential depends on achieving measurable increases in protocol adoption, network utilization, and sustained demand for monitoring services within the Web3 ecosystem. Prospective participants should carefully evaluate liquidity constraints, supply dilution risks, and competitive dynamics within the blockchain security landscape.
Data as of: December 21, 2025, 14:21:25 UTC
Sources: On-chain data, market cap aggregators, technical analysis platforms
III. FORT Future Investment Predictions and Price Outlook (Is Forta(FORT) worth investing in 2025-2030)
Short-term Investment Prediction (2025, short-term FORT investment outlook)
- Conservative Forecast: $0.01343 - $0.02099
- Neutral Forecast: $0.02099 - $0.02613
- Optimistic Forecast: $0.02614 - $0.03128
Mid-term Investment Outlook (2026-2028, mid-term Forta(FORT) investment forecast)
-
Market Stage Expectation: Forta continues its consolidation phase with gradual recovery potential as the decentralized monitoring network expands its utility across DeFi, NFT, and governance sectors.
-
Investment Return Projections:
- 2026: $0.01986 - $0.03685
- 2027: $0.02141 - $0.04409
-
Key Catalysts: Enhanced adoption of real-time threat detection across Web3 protocols, increased institutional integration, expansion of monitoring capabilities across multiple blockchain networks, and strengthened security infrastructure for decentralized systems.
Long-term Investment Outlook (Is Forta a good long-term investment?)
-
Base Case Scenario: $0.02536 - $0.04284 USD (Corresponding to steady protocol adoption and mainstream security integration across Web3 infrastructure)
-
Optimistic Scenario: $0.04284 - $0.06430 USD (Corresponding to widespread enterprise adoption and substantial increase in decentralized monitoring demand)
-
Risk Scenario: $0.01500 - $0.02000 USD (Extreme conditions including competition from alternative monitoring solutions or regulatory constraints on blockchain monitoring services)
Click to view FORT long-term investment and price predictions: Price Prediction
2025-12-21 - 2030 Long-term Outlook
-
Base Case: $0.02536 - $0.04528 USD (Corresponding to steady ecosystem development and moderate security infrastructure adoption)
-
Optimistic Scenario: $0.03724 - $0.06430 USD (Corresponding to accelerated Web3 adoption and significantly increased demand for decentralized monitoring solutions)
-
Transformative Scenario: $0.06430 USD and above (In the event of breakthrough developments in threat detection technology and mainstream blockchain security adoption)
-
Predicted High Point by 2030-12-31: $0.06430 USD (Based on optimistic development assumptions)
Disclaimer: This analysis is provided for informational purposes only and does not constitute investment advice. Cryptocurrency markets are highly volatile and subject to regulatory, technological, and macroeconomic risks. Past performance and predictions do not guarantee future results. Investors should conduct thorough research and consult with qualified financial advisors before making investment decisions.
| 年份 |
预测最高价 |
预测平均价格 |
预测最低价 |
涨跌幅 |
| 2025 |
0.0312751 |
0.02099 |
0.0134336 |
0 |
| 2026 |
0.0368468955 |
0.02613255 |
0.019860738 |
24 |
| 2027 |
0.04408561185 |
0.03148972275 |
0.02141301147 |
50 |
| 2028 |
0.046856707452 |
0.0377876673 |
0.02645136711 |
80 |
| 2029 |
0.04824729360864 |
0.042322187376 |
0.03724352489088 |
101 |
| 2030 |
0.064304331499094 |
0.04528474049232 |
0.025359454675699 |
115 |
Forta (FORT) Research Report
I. Project Overview
Forta is a real-time detection network for security and operational monitoring of blockchain activities. As a decentralized monitoring network, Forta detects threats and anomalies across DeFi, NFT, governance, bridges, and other Web3 systems in real time.
Token Details:
- Token Name: FORT
- Token Type: ERC-20 on Ethereum Mainnet
- Current Price: $0.02099 (as of December 21, 2025)
- Total Supply: 1,000,000,000 FORT
- Circulating Supply: 623,391,380.2822056 FORT
- Circulation Ratio: 62.34%
Project Purpose
By providing timely and relevant alerts regarding the safety and health of systems owned or relied upon, Forta enables protocols and investors to respond quickly to eliminate threats and prevent or minimize fund losses.
Current Market Status
- Market Capitalization: $20,990,000 (Fully Diluted)
- Market Cap (Circulating): $13,084,985.07
- 24-Hour Volume: $81,763.31
- Market Dominance: 0.00065%
- Market Ranking: 1048
- Number of Holders: 5,404
- Exchange Listings: 8
| Timeframe |
Change |
Price Movement |
| 1 Hour |
+0.29% |
+$0.000061 |
| 24 Hours |
+2.63% |
+$0.000538 |
| 7 Days |
-3.96% |
-$0.000865 |
| 30 Days |
-21.48% |
-$0.005742 |
| 1 Year |
-83.39% |
-$0.105380 |
Price Range
- All-Time High: $0.964645 (June 16, 2022)
- All-Time Low: $0.01832485 (December 19, 2025)
- 24-Hour Range: $0.02048 - $0.02261
- Distance from ATH: -97.82%
- Distance from ATL: +14.56%
III. Token Economics & Distribution
Supply Dynamics
- Total Supply: 1,000,000,000 FORT
- Maximum Supply: 1,000,000,000 FORT
- Circulating Supply: 623,391,380.28 FORT
- Market Cap to FDV Ratio: 62.34%
The circulating supply represents 62.34% of total supply, indicating that approximately 37.66% of tokens remain in vesting or reserve.
Project Launch
- Launch Date: June 10, 2022
- Initial Price: $0.25
- Price Decline from Launch: -91.60%
IV. Investment Strategy & Risk Management
Investment Methodology
- Long-term HODL Strategy: Suitable for conservative investors who believe in Forta's long-term role as a critical monitoring infrastructure for Web3 security.
- Active Trading: Requires technical analysis given the token's high volatility and current market recovery phase from all-time lows.
Risk Management Considerations
- Asset Allocation: Given the extreme volatility and market ranking, allocation should be conservative relative to overall portfolio size.
- Storage Security: For significant holdings, hardware wallet storage is recommended. FORT is available on Ethereum and Polygon networks.
- Portfolio Diversification: Multi-asset composition with non-correlated assets recommended to mitigate concentration risk.
V. Investment Risks & Challenges
Market Risk
- Extreme Volatility: Token has experienced -83.39% decline over 12 months and currently trades 97.82% below all-time high.
- Low Liquidity: 24-hour volume of $81,763 represents low trading volume relative to market cap, which may result in significant slippage on large trades.
- Speculative Dynamics: Small holder base (5,404 holders) may result in price manipulation risk.
Technology & Operational Risk
- Network Security: As a security monitoring network, any operational failures or exploits could undermine user confidence.
- Adoption Risk: Forta's value depends on market adoption by protocols and DeFi platforms for real-time threat detection.
Regulatory Risk
- Policy Uncertainty: Evolving regulatory frameworks across jurisdictions could impact token classification and utility.
VI. Conclusion: Is FORT a Good Investment?
Investment Value Summary
FORT represents infrastructure-level technology for Web3 security monitoring with real-world utility. However, the token has experienced significant price deterioration, trading 97.82% below its all-time high. The current market conditions suggest the token may be in an early recovery phase or experiencing sustained adoption challenges.
Investor Guidance
✅ Beginners: Dollar-cost averaging with secure Ethereum or Polygon wallet storage; allocate only capital that can withstand total loss.
✅ Experienced Investors: Technical analysis for entry points near current lows; position sizing relative to infrastructure-tier crypto assets.
✅ Institutional Investors: Monitor adoption metrics and protocol integration rates before strategic allocation.
⚠️ Disclaimer: Cryptocurrency investment carries substantial risk. Forta has experienced extreme volatility with a -83.39% decline over one year. This report is for informational purposes only and does not constitute investment advice, financial recommendation, or solicitation to buy or sell any asset. Conduct independent due diligence and consult with qualified financial advisors before making investment decisions.
Data Last Updated: December 21, 2025, 14:21:25 UTC
Forta (FORT) Cryptocurrency Asset Research Report
FAQ
Q1: What is Forta (FORT) and what is its primary function in the blockchain ecosystem?
A: Forta is a real-time detection network designed for security and operational monitoring of blockchain activities. As a decentralized monitoring network, it detects threats and anomalies across DeFi protocols, NFT platforms, governance systems, bridges, and other Web3 applications in real-time. FORT is an ERC-20 token that operates on the Ethereum mainnet and Polygon network, enabling the network to function as an essential security infrastructure component that helps protocols and investors respond quickly to eliminate threats and prevent financial losses.
Q2: What is the current price and market position of FORT as of December 21, 2025?
A: As of December 21, 2025, FORT is trading at $0.02099 with a market capitalization of approximately $20.99 million (fully diluted valuation). The token ranks 1,048th in the cryptocurrency market by market cap, with a circulating supply of 623.39 million tokens (62.34% of the total 1 billion token supply). The 24-hour trading volume is $81,763.31, and the token maintains a presence on 8 major exchanges with 5,404 holders.
Q3: How has FORT's price performed historically, and what are the key price levels to monitor?
A: FORT has experienced significant price volatility since its June 2022 launch at $0.25. The token reached an all-time high of $0.964645 on June 16, 2022, representing the peak for early investors. However, it subsequently declined substantially, reaching an all-time low of $0.01832485 on December 19, 2025. Over the past year, FORT has declined 83.39%. The current price of $0.02099 represents a 97.82% decrease from the all-time high and a 14.56% increase from the recent all-time low, placing the token in a potentially volatile recovery phase.
Q4: What are the price predictions for FORT in the short-term (2025) and long-term (2030)?
A: Short-term predictions for 2025 range from $0.01343 to $0.03128, with a neutral forecast of $0.02099 to $0.02613. For medium-term horizons, 2026-2027 forecasts range from $0.01986 to $0.04409. Long-term predictions by 2030 show a base case scenario of $0.02536 to $0.04528, an optimistic scenario of $0.03724 to $0.06430, and a predicted high point of $0.06430 by December 31, 2030. These forecasts reflect uncertainty and depend heavily on protocol adoption rates and sustained demand for decentralized monitoring services.
Q5: What are the primary investment risks associated with FORT?
A: Key risks include liquidity risk due to modest daily trading volume of $81,763 relative to market capitalization, creating potential challenges for significant position accumulation. Dilution risk exists with 376.6 million unreleased tokens (37.66% of total supply) potentially exerting downward price pressure as they enter circulation. Adoption risk depends on whether protocols sufficiently value real-time threat detection to maintain network participation. Competitive risk stems from both specialized security providers and integrated security features from major protocols. Market risk is evidenced by the 83.39% annual depreciation and recent all-time low prices, indicating sustained negative market sentiment.
Q6: How much of FORT's total token supply is currently in circulation, and what does this mean for future price potential?
A: Currently, 623.39 million FORT tokens are in circulation, representing 62.34% of the total 1 billion token supply. This means approximately 376.6 million tokens (37.66%) remain in reserve or under vesting schedules. This relatively high inflation rate represents a potential source of downward price pressure as additional tokens enter the market over time. The gap between current price ($0.02099) and historical pricing ($0.25 launch price, $0.964645 ATH) suggests that inflationary supply dynamics may have contributed significantly to the token's substantial depreciation since launch.
Q7: Is FORT a suitable investment for cryptocurrency beginners, and what investment strategies are recommended?
A: For beginners, FORT may be suitable only with conservative allocation and strict risk management. Recommended approaches include dollar-cost averaging with secure storage on Ethereum or Polygon wallets, allocating only capital that can withstand total loss. Experienced investors may employ technical analysis for entry points near current support levels, while institutional investors should monitor adoption metrics and protocol integration rates before strategic allocation. All investors should conduct thorough independent due diligence and consult qualified financial advisors, as cryptocurrency markets are highly volatile and FORT has experienced extreme price fluctuations with no guarantee that historical predictions or performance will repeat.
Q8: What factors will determine whether Forta achieves adoption and becomes a valuable long-term infrastructure investment?
A: Forta's long-term investment success depends on several critical factors: measurable increases in protocol adoption and network utilization across DeFi, NFT, and governance ecosystems; sustained demand for real-time threat detection services among blockchain participants; successful integration into existing security infrastructure; competitive differentiation from alternative monitoring solutions; and favorable regulatory treatment of blockchain monitoring services. Additionally, the project requires continued technical development, active GitHub maintenance, and expanding partnerships with major protocols. Current metrics—including only 5,404 token holders, modest daily trading volume, and 97.82% decline from all-time highs—suggest the project has not yet achieved mainstream adoption, making long-term success contingent on executing these expansion objectives.
Disclaimer: This analysis is provided for informational purposes only and does not constitute investment advice, financial recommendation, or solicitation to buy or sell any asset. Cryptocurrency investment carries substantial risk. Past performance and predictions do not guarantee future results. Investors should conduct thorough independent due diligence and consult with qualified financial advisors before making investment decisions.
Data Last Updated: December 21, 2025, 14:21:25 UTC
* The information is not intended to be and does not constitute financial advice or any other recommendation of any sort offered or endorsed by Gate.