This article provides a comprehensive analysis of Maverick Protocol (MAV), a decentralized finance infrastructure that revolutionizes Automated Market Maker (AMM) design. It addresses the investment potential, price performance, and technological innovations that enhance market liquidity and capital efficiency. Targeted at investors and crypto enthusiasts, it evaluates MAV’s market position, risks, and opportunities for traders and liquidity providers. Structured into sections on price history, project overview, network accessibility, and investment strategies, the article concludes with projections for future growth and market dynamics. Key themes include dynamic liquidity and directional strategies.
Introduction: Maverick Protocol (MAV) Investment Position and Market Prospects
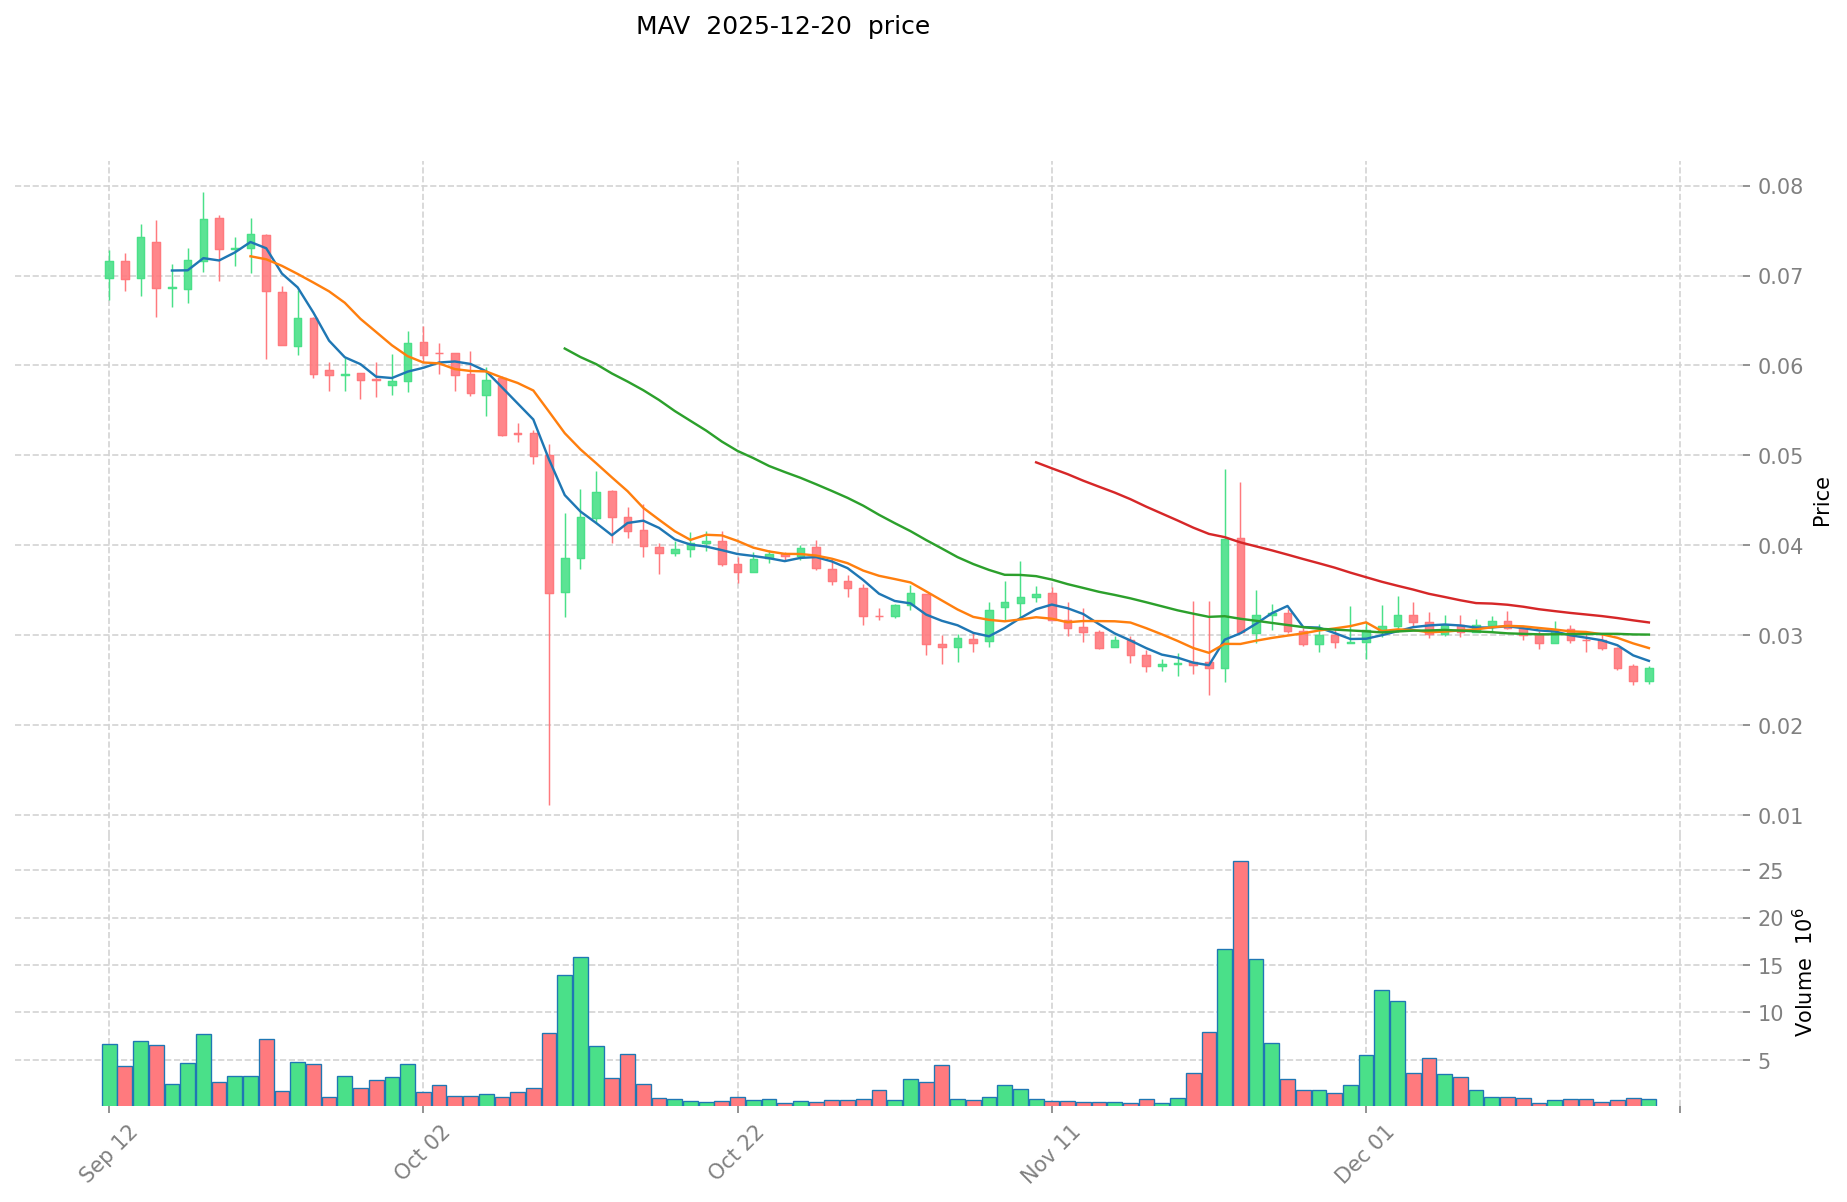
Maverick Protocol (MAV) represents an important infrastructure development in decentralized finance, having been launched in June 2023. The protocol has gained traction in the automated market maker (AMM) space with its innovative dynamic liquidity distribution model. As of December 20, 2025, MAV maintains a market capitalization of approximately $21.03 million, with a circulating supply of approximately 792.72 million tokens out of a total supply of 2 billion tokens. The current price stands at $0.02653, reflecting significant volatility from its all-time high of $0.8186 reached on April 1, 2024, to its recent low of $0.01108 on October 10, 2025.
Maverick Protocol distinguishes itself through its revolutionary Dynamic Distribution AMM architecture, which automates liquidity concentration as prices move, thereby maximizing capital efficiency for liquidity providers while reducing gas fees associated with manual position adjustments. The protocol also enables directional liquidity strategies, allowing participants to make single-sided bets on asset price trajectories. These technological innovations represent a paradigm shift in how smart contracts manage liquidity across decentralized markets, establishing Maverick as a foundational infrastructure layer for traders, liquidity providers, DAO treasuries, and developers seeking enhanced market liquidity.
This comprehensive analysis examines Maverick's investment value proposition, historical price performance, future price projections, and associated investment risks to provide investors with substantive reference material for their evaluation of this protocol and its native token.
Maverick (MAV) Cryptocurrency Asset Research Report
I. Maverick (MAV) Price History Review and Current Investment Status
- April 1, 2024: Reached all-time high of $0.8186
- October 10, 2025: Declined to all-time low of $0.01108
- One-year performance: Declined 86.47% from launch price of $0.05
Current MAV Market Status (December 20, 2025)
| Metric |
Value |
| Current Price |
$0.02653 |
| 24-Hour Change |
+3.95% |
| 7-Day Change |
-9.3% |
| 30-Day Change |
-2.42% |
| 1-Year Change |
-86.47% |
| Market Capitalization |
$21,030,787.98 |
| Fully Diluted Valuation (FDV) |
$53,060,000 |
| 24-Hour Trading Volume |
$26,218.73 |
| Market Ranking |
#846 |
| Market Dominance |
0.0016% |
Price Range (24H): Low $0.02531 → High $0.02668
- Market Emotion Indicator: Positive (Score: 1)
- Circulating Supply: 792,717,225.18 MAV (39.64% of total supply)
- Total Supply: 2,000,000,000 MAV
- Number of Token Holders: 10,801
- Listed on 25 Exchanges
Access real-time MAV market pricing
II. Project Overview
Protocol Architecture and Core Innovation
Maverick Protocol provides infrastructure for decentralized finance, designed to deliver the most liquid markets for traders, liquidity providers, DAO treasuries, and developers. The protocol is powered by a revolutionary Automated Market Maker (AMM).
Key Technological Features
I. Dynamic Liquidity Concentration
- Maverick AMM automatically concentrates liquidity as prices move
- Maximizes capital efficiency for users
- Reduces gas fees associated with manual position adjustments
II. Directional Liquidity Strategies
- Liquidity providers can track asset prices in single directions
- Enables directional bets on specific token price trajectories
- Allows single-sided liquidity exposure within pools
III. Automation Paradigm
- First Dynamic Distribution AMM implementation
- Automates liquidity strategies previously requiring daily maintenance
- Eliminates need for meta-protocol integration
Market Benefits
- For Traders: Better price execution through increased liquidity
- For Liquidity Providers: Enhanced fee generation and reduced operational overhead
- For DAOs and Developers: Access to highly liquid market infrastructure
III. Network Deployment and Accessibility
Blockchain Integration
| Chain |
Contract Address |
Explorer |
| Ethereum |
0x7448c7456a97769f6cd04f1e83a4a23ccdc46abd |
Etherscan |
| Base |
0x64b88c73A5DfA78D1713fE1b4c69a22d7E0faAa7 |
BaseScan |
Official Resources
IV. Market Analysis Summary
Supply and Valuation Metrics
- Circulating Supply Ratio: 39.64% of maximum supply
- Circulating Value: $21,030,787.98
- Price-to-FDV Ratio: Circulating market cap represents 39.64% of fully diluted valuation
Recent Market Dynamics
Short-term momentum shows positive movement with +3.95% gain over 24 hours, though the asset remains down significantly over longer timeframes. The 792.7 million circulating tokens and 10,801 active holders indicate an established but niche market position within the DeFi sector.
Report Date: December 20, 2025
Data Source: Gate.com Market Data
Disclaimer: This report presents factual market data and project information. It does not constitute investment advice or price predictions. Cryptocurrency markets remain highly volatile, and investors should conduct independent research before making asset allocation decisions.
Maverick Protocol (MAV) Investment Analysis Report
Report Date: December 20, 2025
I. Executive Summary
Maverick Protocol (MAV) is a decentralized finance infrastructure project built on a revolutionary Automated Market Maker (AMM) model. As of December 20, 2025, MAV is trading at $0.02653, with a market capitalization of $21.03 million and a fully diluted valuation of $53.06 million. The token has experienced significant price volatility, declining 86.47% over the past year from its all-time high of $0.8186 (April 1, 2024) to its current levels.
II. Core Factors Influencing MAV as an Investment
Supply Mechanism and Scarcity
Maverick Protocol operates with a fixed total supply of 2 billion MAV tokens, with 792.72 million tokens currently in circulation (representing 39.64% of total supply). The remaining 1.21 billion tokens represent future supply expansion, which could impact price dynamics as these tokens enter circulation.
Key Supply Metrics:
- Total Supply: 2,000,000,000 MAV
- Circulating Supply: 792,717,225 MAV
- Circulation Ratio: 39.64%
- Launch Price: $0.05
The gradual release mechanism of remaining tokens presents a long-term dilution factor that investors should consider when evaluating price appreciation potential.
Technology and Ecosystem Development
Maverick Protocol introduces a Dynamic Distribution AMM as its core technological innovation. Key features include:
Automated Liquidity Concentration:
- The protocol automatically concentrates liquidity as prices move, maximizing capital efficiency for liquidity providers
- This automation eliminates the need for manual position adjustments, reducing gas fee expenditures
Directional Liquidity Strategies:
- Liquidity providers can now employ single-sided liquidity strategies, enabling directional bets on specific token price trajectories
- Users maintain mostly or entirely exposure to a single asset within designated pools
Paradigm Shift in Liquidity Management:
- Maverick represents the first Dynamic Distribution AMM capable of automating liquidity strategies that previously required daily maintenance or metaprotocol interventions
- This technological approach addresses a fundamental inefficiency in traditional AMM designs
Multi-Chain Deployment:
- MAV is deployed on Ethereum (ETH) and Base EVM networks, indicating ecosystem expansion efforts
- Current exchange availability across 25 trading venues suggests adequate liquidity infrastructure
Recent Price Action:
- 24-hour change: +3.95%
- 7-day change: -9.3%
- 30-day change: -2.42%
- 1-year change: -86.47%
- 1-hour change: +0.49%
Price Range Analysis:
- Current Price: $0.02653
- 24-hour High: $0.02668
- 24-hour Low: $0.02531
- All-time High: $0.8186 (April 1, 2024)
- All-time Low: $0.01108 (October 10, 2025)
Liquidity Metrics:
- 24-hour Trading Volume: $26,218.73
- Market Position: Rank 846 by market cap
- Market Dominance: 0.0016%
The substantial decline from historical highs indicates significant price compression, which may reflect broader market conditions or project-specific challenges.
User Adoption and Network Activity
- Total Token Holders: 10,801
- The relatively modest holder count suggests early-stage adoption, with potential for growth as the protocol gains market traction
III. Market Position and Competitive Landscape
Market Capitalization Context
With a market cap of $21.03 million and FDMC of $53.06 million, Maverick Protocol operates in the mid-to-lower tier of the DeFi protocol rankings. The significant gap between current market cap and FDMC indicates market skepticism regarding near-term token distribution or adoption acceleration.
Trading Infrastructure
MAV maintains presence on 25 exchanges, providing reasonable accessibility for interested participants. Primary trading venues include major crypto exchanges, suggesting institutional infrastructure support.
IV. Risk Considerations
Downside Factors:
- Extreme price volatility: 86.47% annual decline demonstrates significant drawdown risk
- Low market capitalization relative to total supply: Limited market depth
- Early-stage adoption: Nascent token holder base suggests execution risks
- Supply dilution: Remaining 60.36% of tokens not yet in circulation present future selling pressure
- Whale sensitivity: Protocol's price noted as "highly sensitive to whale behavior and supply dynamics"
Technical Considerations:
- AMM competition: Established protocols like Uniswap, Curve, and others command substantially larger liquidity
- User acquisition: Converting liquidity providers from established AMMs requires compelling value proposition
V. Protocol Fundamentals
Value Proposition:
Maverick Protocol addresses legitimate inefficiencies in traditional AMM designs through dynamic liquidity concentration and directional liquidity strategies. These features potentially provide superior capital efficiency compared to competitors, which could drive liquidity provider adoption.
Target Markets:
- Active traders seeking improved pricing
- Liquidity providers optimizing capital deployment
- DAO treasuries requiring efficient market infrastructure
- Protocol developers building DeFi applications
VI. Key Resources
Official Channels:
Smart Contract Addresses:
- Ethereum: 0x7448c7456a97769f6cd04f1e83a4a23ccdc46abd
- Base EVM: 0x64b88c73A5DfA78D1713fE1b4c69a22d7E0faAa7
VII. Conclusion
Maverick Protocol presents a technically differentiated approach to AMM design with genuine innovations in automated liquidity management. However, investors should recognize that the protocol remains in early adoption phases with significant technical competition from established DeFi infrastructure providers. The 86.47% annual price decline and modest market capitalization indicate substantial execution risks and market uncertainty regarding long-term viability.
The decision to allocate capital to MAV should be contingent upon comprehensive risk assessment, individual investment horizon, and conviction regarding the protocol's competitive advantages materializing into meaningful market share within the DeFi ecosystem.
III. Maverick (MAV) Future Investment Predictions and Price Outlook
Short-term Investment Predictions (2025, short-term MAV investment outlook)
- Conservative forecast: $0.0252 - $0.0265
- Neutral forecast: $0.0265 - $0.0371
- Optimistic forecast: $0.0371 - $0.0410
Mid-term Investment Outlook (2026-2028, mid-term Maverick (MAV) investment forecast)
-
Market phase expectations: MAV enters a recovery and consolidation phase, with the protocol continuing to establish its position as a dynamic distribution AMM in decentralized finance markets. Increased adoption among liquidity providers and the integration of directional liquidity strategies may drive incremental growth.
-
Investment return predictions:
- 2026: $0.0264 - $0.0385
- 2027: $0.0183 - $0.0464
-
Key catalysts: Protocol adoption growth, expansion across blockchain networks (ETH, Base), institutional participation from DAO treasuries, competitive developments in the AMM landscape, and overall DeFi market sentiment.
Long-term Investment Outlook (Is Maverick (MAV) a good long-term investment?)
-
Base case scenario: $0.0295 - $0.0595 (assuming steady ecosystem adoption, maintaining market share among AMM protocols, and moderate growth in total value locked)
-
Optimistic scenario: $0.0410 - $0.0821 (assuming breakthrough in institutional adoption, successful expansion to additional Layer 2 networks, and favorable macroeconomic conditions for DeFi)
-
Risk scenario: $0.0180 - $0.0300 (reflecting extreme market downturns, increased competition from rival AMM solutions, or limited adoption of directional liquidity strategies)
View MAV long-term investment and price predictions: Price Prediction
2025-12-20 to 2030 Long-term Outlook
-
Base case: $0.0300 - $0.0504 USD (corresponding to steady ecosystem development and mainstream DeFi adoption progression)
-
Optimistic case: $0.0504 - $0.0821 USD (corresponding to large-scale institutional adoption and favorable market environment)
-
Transformative case: $0.1000 USD and above (if breakthrough ecosystem developments occur and mainstream integration accelerates)
-
2030-12-31 predicted high: $0.0595 USD (based on optimistic development assumptions)
Disclaimer: This analysis is based on available data and market predictions from multiple sources. Cryptocurrency markets are highly volatile and subject to rapid change. Price predictions are inherently uncertain and should not be considered as financial advice. Past performance does not guarantee future results. Investors should conduct their own research and risk assessment before making any investment decisions.
| 年份 |
预测最高价 |
预测平均价格 |
预测最低价 |
涨跌幅 |
| 2025 |
0.037142 |
0.02653 |
0.0252035 |
0 |
| 2026 |
0.03852156 |
0.031836 |
0.02642388 |
20 |
| 2027 |
0.0464359896 |
0.03517878 |
0.0182929656 |
32 |
| 2028 |
0.048152714064 |
0.0408073848 |
0.025300578576 |
53 |
| 2029 |
0.05560006179 |
0.044480049432 |
0.03024643361376 |
67 |
| 2030 |
0.05954766617709 |
0.050040055611 |
0.02952363281049 |
88 |
Maverick Protocol (MAV) Investment Analysis Report
I. Project Overview
Maverick Protocol is a decentralized finance infrastructure protocol built on a revolutionary Automated Market Maker (AMM) designed to provide the most liquid markets for traders, liquidity providers, DAO treasuries, and developers.
| Metric |
Value |
| Token Name |
Maverick |
| Token Symbol |
MAV |
| Current Price |
$0.02653 |
| Market Cap |
$21,030,787.98 |
| Fully Diluted Valuation |
$53,060,000 |
| Circulating Supply |
792,717,225.18 MAV |
| Total Supply |
2,000,000,000 MAV |
| Market Ranking |
#846 |
| Trading Volume (24H) |
$26,218.73 |
| Available Exchanges |
25 |
Core Technology & Innovation
Maverick Protocol introduces several technological innovations:
- Dynamic Distribution AMM: The first AMM capable of automating liquidity strategies that previously required daily maintenance or metaprotocols
- Automatic Liquidity Concentration: Automatically concentrates liquidity as prices move, maximizing capital efficiency for users
- Capital Efficiency Enhancement: Higher capital efficiency leads to more liquid markets, better prices for traders, and higher fees for liquidity providers
- Gas Fee Reduction: Built-in features help LPs eliminate high gas fees associated with manual position adjustments
- Directional Liquidity Strategies: LPs can choose to track asset prices in a single direction, making directional bets on specific token price trajectories, similar to single-sided liquidity strategies
Price Trends
| Period |
Price Change |
Amount Change |
| 1 Hour |
+0.49% |
+$0.000129 |
| 24 Hours |
+3.95% |
+$0.001008 |
| 7 Days |
-9.3% |
-$0.002720 |
| 30 Days |
-2.42% |
-$0.000658 |
| 1 Year |
-86.47% |
-$0.169553 |
Historical Price Levels
- All-Time High: $0.8186 (April 1, 2024)
- All-Time Low: $0.01108 (October 10, 2025)
- 24H High: $0.02668
- 24H Low: $0.02531
- Launch Price: $0.05 (June 27, 2023)
Market Position
- Market Dominance: 0.0016%
- Circulating Supply Ratio: 39.64%
- Holders: 10,801
- Price vs. ICO: -46.94%
III. Network & Accessibility
Blockchain Deployments
MAV token is deployed on multiple blockchain networks:
-
Ethereum (ETH)
-
Base (BASEEVM)
Official Resources
IV. Investment Strategy and Risk Management
Investment Methodology
- Long-term Holding (HODL MAV): Suitable for conservative investors who believe in the protocol's long-term potential for optimizing AMM efficiency and liquidity provision
- Active Trading: Requires technical analysis and monitoring of MAV's significant price volatility; suitable for experienced traders
Risk Management
- Asset Allocation: Conservative investors should maintain MAV as a small percentage (under 5%) of crypto portfolio; active traders may allocate up to 10-15%; professional investors should conduct thorough due diligence before position sizing
- Hedging Strategies: Diversify across multiple DeFi protocols and AMM solutions; consider stablecoin holdings for volatility hedging
- Secure Storage:
- Hot wallets for active trading (MetaMask, Trust Wallet)
- Cold storage solutions for long-term holdings (Ledger, Trezor)
- Self-custody recommended over exchange holdings given protocol-specific positions
V. Investment Risks and Challenges
Market Risk
- High Volatility: MAV has experienced -86.47% decline over one year, indicating extreme price fluctuations
- Liquidity Risk: 24-hour trading volume of $26,218.73 is relatively modest given market capitalization, potentially affecting exit liquidity during adverse conditions
- Price Manipulation: Lower liquidity relative to larger-cap tokens increases susceptibility to price movements
Regulatory Risk
- Unclear Regulatory Status: DeFi protocols face evolving regulatory frameworks across different jurisdictions
- Policy Uncertainty: Changes in regulations affecting smart contracts, AMMs, or token trading could impact protocol viability
- Jurisdictional Variations: Different countries implement varying crypto regulatory approaches
Technology Risk
- Smart Contract Risk: As the first Dynamic Distribution AMM, Maverick faces technology validation risks
- Security Vulnerabilities: AMM protocols face potential exploitation risks; audits and formal verification status not specified in available data
- Protocol Upgrade Risk: Implementation of new features or protocol modifications could introduce unforeseen risks
VI. Conclusion: Is Maverick Protocol (MAV) a Good Investment?
Investment Value Summary
Maverick Protocol presents an innovative approach to AMM design with genuine technological differentiation through dynamic liquidity distribution. However, the token has experienced severe price depreciation (-86.47% annually), trading 67.6% below its launch price, indicating significant market sentiment challenges despite technological merit.
Long-term potential exists for investors believing in AMM infrastructure evolution, but short-term price volatility remains acute, with the token trading near 3.2x its all-time low.
Investor Recommendations
✅ New Investors: Dollar-cost averaging (DCA) strategy with secure hardware wallet storage; limit allocation to 2-3% of crypto portfolio; focus on long-term protocol adoption thesis
✅ Experienced Investors: Swing trading opportunities around technical support/resistance levels; consider accumulation during extreme pessimism; maintain portfolio diversification across multiple DeFi protocols
✅ Institutional Investors: Strategic long-term allocation contingent on protocol adoption metrics and competitive positioning analysis; conduct comprehensive smart contract audits and technology risk assessment
⚠️ Disclaimer: Cryptocurrency investments carry substantial risk, including potential total loss of capital. This analysis is provided for informational purposes only and does not constitute investment advice. Conduct independent research and consult qualified financial advisors before making investment decisions. Past performance does not guarantee future results.
Report Generated: December 20, 2025
Maverick Protocol (MAV) - Frequently Asked Questions
I. What is Maverick Protocol (MAV) and how does it differ from other AMM solutions?
Answer: Maverick Protocol is a decentralized finance infrastructure project featuring a revolutionary Dynamic Distribution Automated Market Maker (AMM) launched in June 2023. Unlike traditional AMMs, Maverick automatically concentrates liquidity as prices move, maximizing capital efficiency without requiring manual position adjustments. The protocol enables directional liquidity strategies, allowing liquidity providers to make single-sided bets on asset price trajectories. This represents the first automated AMM capable of handling liquidity strategies that previously required daily maintenance or meta-protocol interventions.
II. What is the current market position of MAV token as of December 20, 2025?
Answer: As of December 20, 2025, MAV is trading at $0.02653 with a market capitalization of $21.03 million and a fully diluted valuation of $53.06 million. The token has a circulating supply of 792.72 million MAV out of a total supply of 2 billion tokens (39.64% circulation ratio). MAV is ranked #846 by market cap and is listed on 25 exchanges. The 24-hour trading volume stands at $26,218.73, with 10,801 active token holders.
III. Why has MAV experienced such significant price decline, and what are the primary risk factors?
Answer: MAV has declined 86.47% over the past year from its launch price of $0.05, with an all-time high of $0.8186 (April 1, 2024) declining to an all-time low of $0.01108 (October 10, 2025). Primary risk factors include: extreme price volatility, low market capitalization relative to total supply, early-stage adoption with only 10,801 holders, pending supply dilution from 60.36% of tokens not yet in circulation, intense competition from established AMMs, and sensitivity to whale market behavior. Additionally, regulatory uncertainty surrounding DeFi protocols and smart contract security risks contribute to downside pressure.
IV. What are the price predictions for MAV in the short-term, mid-term, and long-term?
Answer: Price projections are provided as illustrative scenarios based on available market data:
Short-term (2025): Conservative forecast $0.0252-$0.0265; Neutral forecast $0.0265-$0.0371; Optimistic forecast $0.0371-$0.0410
Mid-term (2026-2028): 2026 projected range $0.0264-$0.0385; 2027 projected range $0.0183-$0.0464
Long-term (2030): Base case $0.0300-$0.0504; Optimistic case $0.0504-$0.0821; Transformative case $0.1000 and above
These projections depend on protocol adoption growth, institutional participation, competitive developments, and overall DeFi market sentiment. All price predictions carry significant uncertainty and should not be considered investment advice.
V. How does the supply mechanics of MAV affect long-term investment potential?
Answer: Maverick Protocol operates with a fixed total supply of 2 billion tokens, with only 792.72 million (39.64%) currently in circulation. The remaining 1.21 billion tokens represent future supply expansion that will gradually enter the market. This supply dilution mechanism presents a significant long-term consideration, as increased token circulation could exert downward pressure on price unless adoption and demand metrics scale proportionally. Investors should monitor token unlock schedules and vesting releases, as accelerated supply entry could compress valuations without corresponding fundamental improvements.
VI. What are the recommended investment strategies for different investor profiles?
Answer:
Conservative Investors: Dollar-cost averaging (DCA) strategy with allocation limited to 2-3% of crypto portfolio; utilize secure hardware wallet storage; focus on protocol adoption thesis rather than short-term price movements.
Experienced Traders: Swing trading around technical support and resistance levels; accumulation during periods of extreme pessimism; maintain portfolio diversification across multiple DeFi protocols.
Long-term Holders: Strategic position sizing reflecting conviction in AMM infrastructure evolution; emphasis on secure custody practices; acceptance of significant short-term volatility for potential long-term appreciation.
All investors should implement risk management through diversification, avoid leverage given volatility levels, and consider hedging strategies using stablecoin allocations.
VII. What network deployments and accessibility options are available for MAV trading?
Answer: Maverick Protocol is deployed on multiple blockchain networks: Ethereum (contract address 0x7448c7456a97769f6cd04f1e83a4a23ccdc46abd) and Base EVM (contract address 0x64b88c73A5DfA78D1713fE1b4c69a22d7E0faAa7). MAV is listed on 25 exchanges, providing reasonable accessibility for interested participants. The protocol's official application is accessible at https://app.mav.xyz/, with comprehensive protocol information available through the whitepaper and official Twitter account (@mavprotocol). This multi-chain and multi-exchange presence suggests adequate infrastructure support, though users should verify platform security and conduct due diligence before trading.
VIII. Is Maverick Protocol suitable as a long-term investment given current market conditions?
Answer: Maverick Protocol presents a technically differentiated AMM solution with genuine innovations in automated liquidity management. However, investors should recognize the protocol remains in early adoption phases with significant technical competition from established DeFi infrastructure providers. The 86.47% annual price decline and modest market capitalization indicate substantial execution risks. Long-term investment suitability depends on individual risk tolerance, conviction regarding the protocol's competitive advantages materializing into meaningful market share, and portfolio context. Conservative investors should maintain exposure below 5% of total crypto allocation. The decision to invest should be contingent upon comprehensive independent research, personal risk assessment, and consultation with qualified financial advisors. This analysis is informational only and does not constitute investment advice.
* The information is not intended to be and does not constitute financial advice or any other recommendation of any sort offered or endorsed by Gate.


