This comprehensive analysis compares J and LINK, two distinct blockchain solutions targeting different market needs. J, launched in 2025, represents an emerging mobile-first crypto network with significant volatility—declining 98% from peak to $0.0235. LINK, operating since 2017, serves established decentralized oracle infrastructure with demonstrated utility, currently at $10.87 after a 79% decline. The article examines critical investment factors including historical price trends, supply mechanisms, institutional adoption, and technological ecosystems. Price predictions through 2031 suggest both assets may recover, with LINK showing more stability due to superior liquidity ($6.9M vs $23K daily volume) and longer operational history. Investment recommendations vary by investor profile: conservative investors should favor LINK with 80-90% allocation, while experienced investors may diversify across both assets. The analysis emphasizes risk management, regulatory considerations, and suitability assessment acro
Introduction: Investment Comparison Between J and LINK
In the cryptocurrency market, the comparison between J and LINK remains a focal point for investors. These two assets differ significantly in market cap ranking, application scenarios, and price performance, representing distinct positioning within the crypto asset landscape.
J (Jambo): Launched in 2025, this token aims to build the world's largest mobile-first crypto network, starting with the JamboPhone initiative.
LINK (Chainlink): Operating since 2017, LINK serves as an ERC20 standardized token on the Ethereum blockchain, designed to facilitate decentralized oracle networks by compensating node operators for data retrieval, formatting, and off-chain computation.
This article will examine historical price trends, supply mechanisms, institutional adoption, technological ecosystems, and future projections to provide a comprehensive analysis of the investment value comparison between J and LINK, while addressing the question that concerns investors most:
"Which is the better buy right now?"
I. Price History Comparison and Market Status
J (Jambo) and LINK (Chainlink) Historical Price Trends
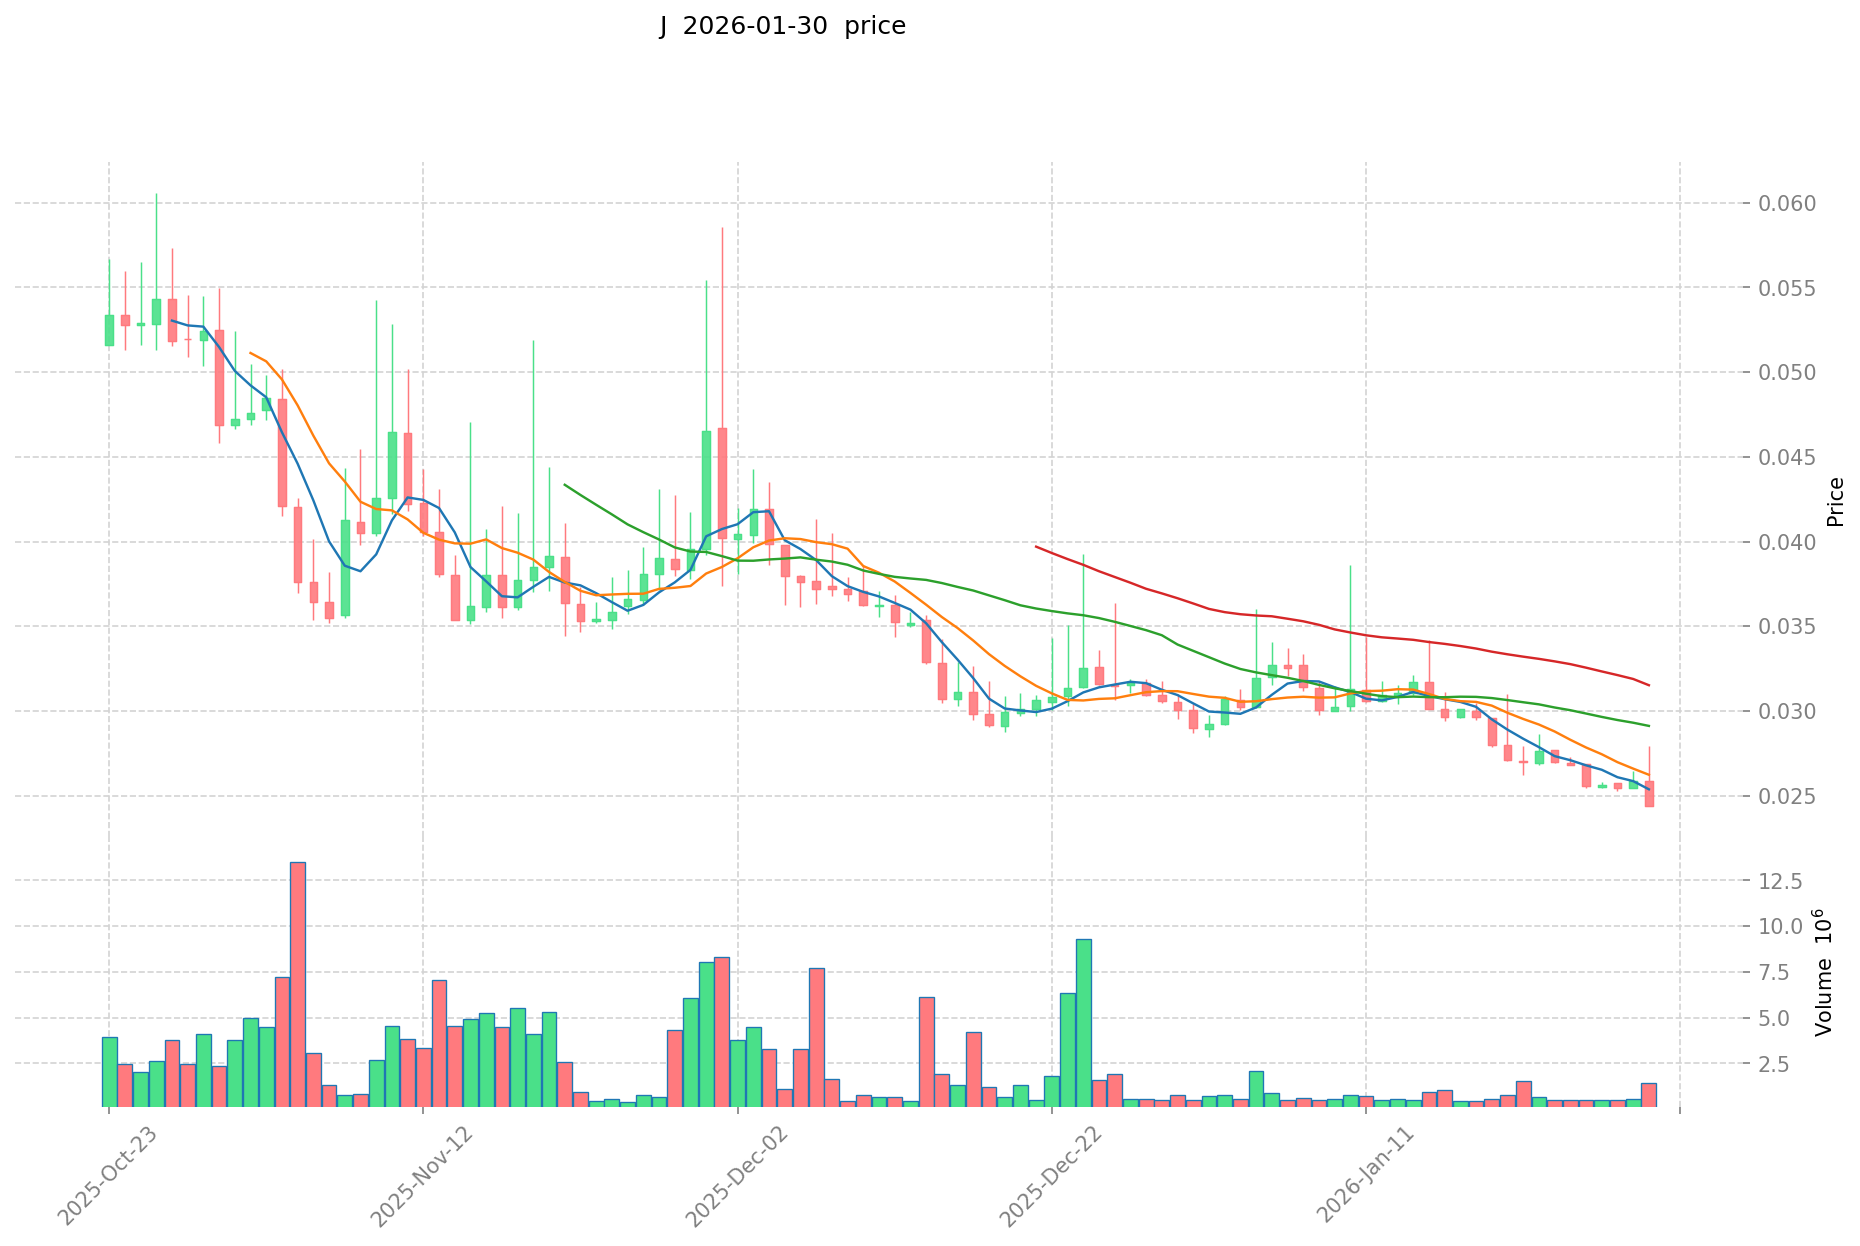
- 2025: J launched on January 22, 2025, reaching its all-time high of $1.50 on the same day. The token experienced significant volatility in its initial trading period.
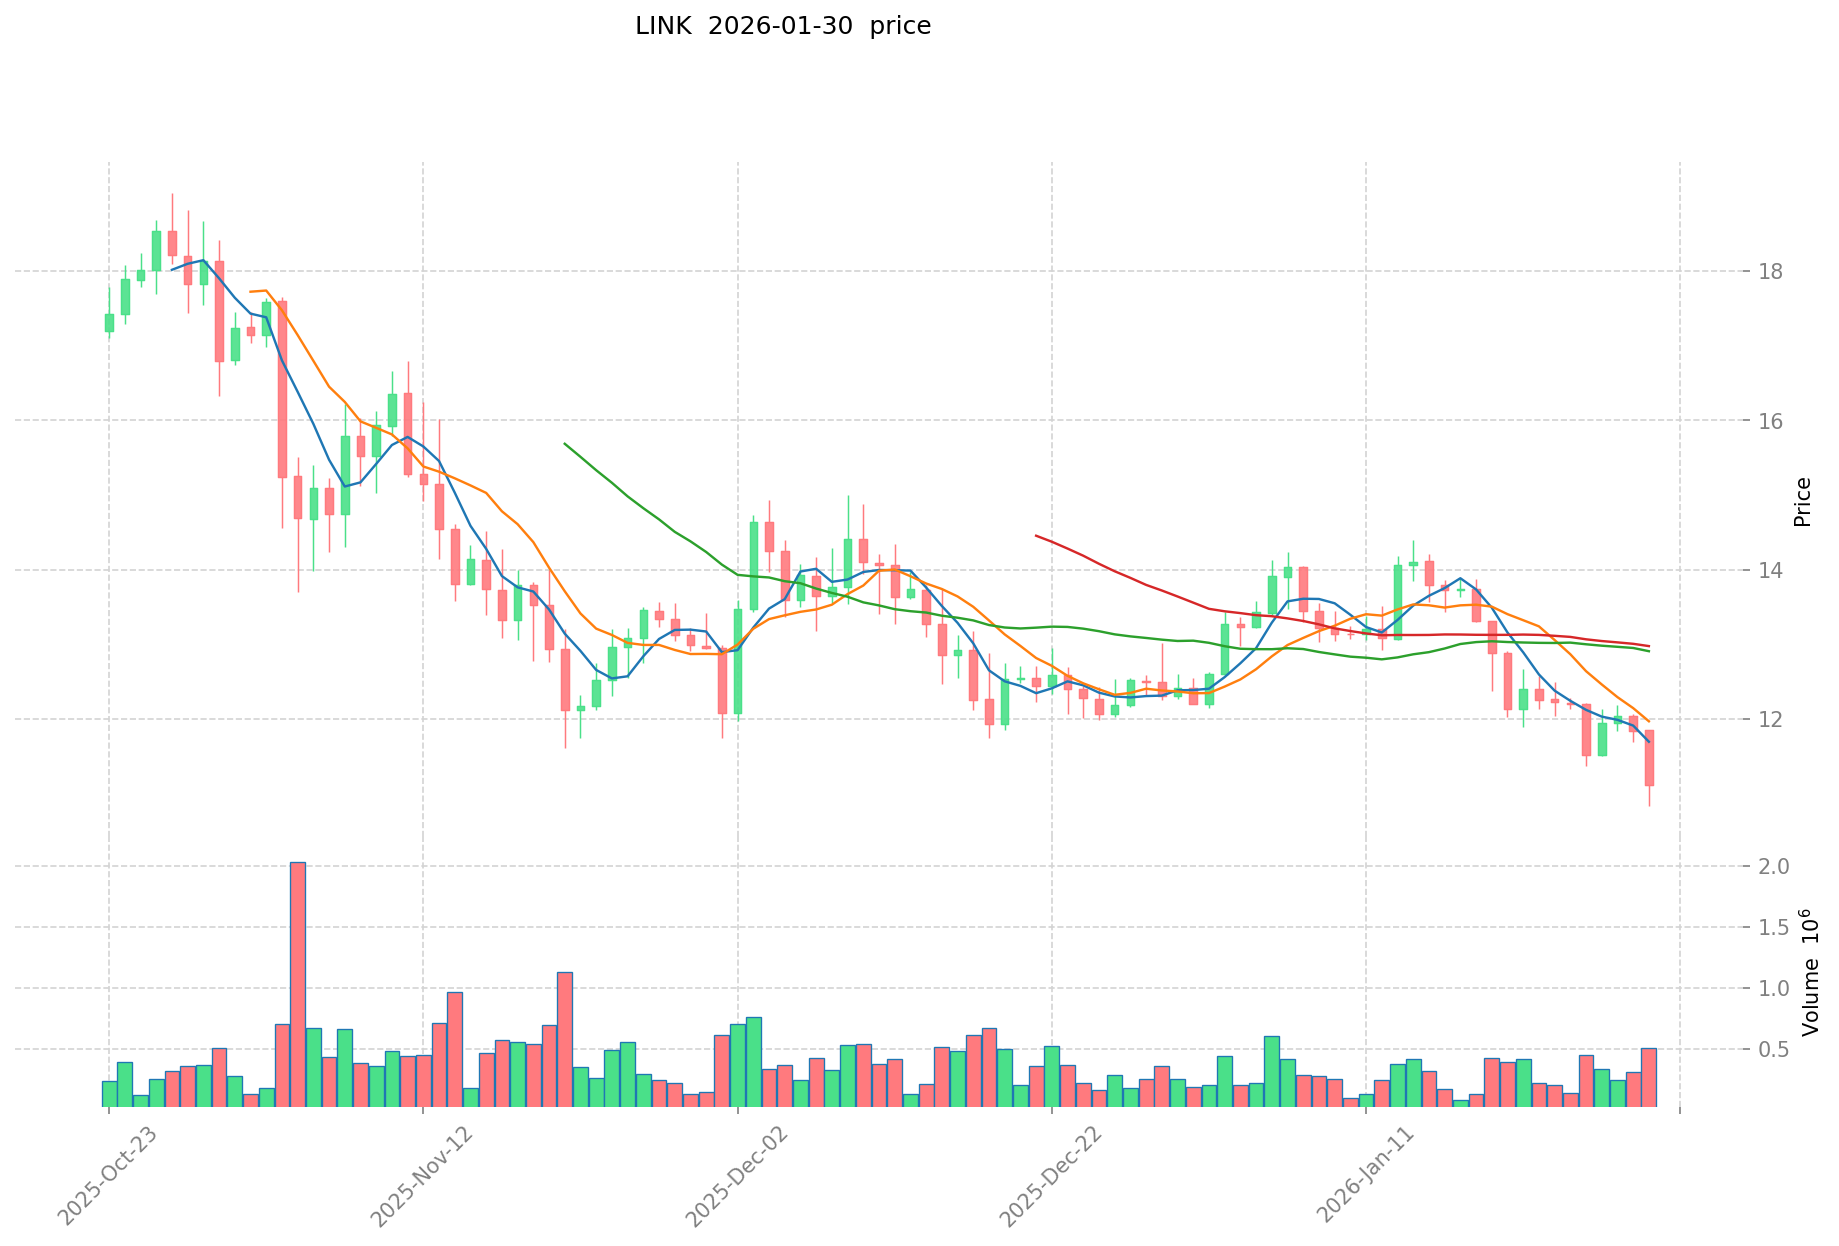
- 2021: LINK reached its all-time high of $52.70 on May 10, 2021, during the broader cryptocurrency bull market. The token has since retraced substantially from these levels.
- Comparative analysis: During the recent market cycle, J declined from its peak of $1.50 to a low of $0.0231 (recorded on January 30, 2026), representing a decline of over 98%. Meanwhile, LINK has experienced a decline from its historical high of $52.70 to current levels around $10.87, reflecting a decrease of approximately 79% from its peak.
Current Market Situation (January 31, 2026)
- J current price: $0.02351
- LINK current price: $10.871
- 24-hour trading volume: J recorded $23,791.11 vs LINK's $6,926,705.98
- Market sentiment index (Fear & Greed Index): 16 (Extreme Fear)
View real-time prices:
II. Core Factors Affecting J and LINK Investment Value
Supply Mechanism Comparison (Tokenomics)
Based on the available reference materials, specific tokenomics details for J and LINK are not provided. The materials primarily discuss general investment principles, fund management strategies, and asset allocation approaches rather than cryptocurrency supply mechanisms.
Without concrete data on supply models, emission schedules, or token distribution mechanisms for these specific assets, it would not be appropriate to make definitive statements about their tokenomics characteristics.
Institutional Adoption and Market Application
The reference materials emphasize that investment value derives from fundamental aspects including current profitability, future earning capacity, management skills, and competitive advantages. These factors collectively constitute an asset's earning potential, which represents its core value.
However, the materials do not contain specific information regarding:
- Institutional holdings comparison between J and LINK
- Enterprise adoption in cross-border payments or settlement systems
- Regulatory attitudes from different jurisdictions toward these specific assets
Technology Development and Ecosystem Building
The available materials focus on traditional investment fund strategies, including active management approaches, risk assessment frameworks, and portfolio construction methodologies. They discuss concepts such as:
- Combining top-down and bottom-up analysis approaches
- Evaluating macroeconomic outlooks and country selection
- Assessing individual security default risk and relative value
However, specific technical upgrade plans, DeFi integration, NFT applications, payment system implementations, or smart contract deployment details for J and LINK are not addressed in the provided references.
Macroeconomic Environment and Market Cycles
The materials highlight the importance of macroeconomic factors in investment decision-making, including considerations of:
- Inflation trends and interest rate environments
- Economic growth prospects
- Geopolitical issues
The investment strategies described emphasize long-term growth orientation, downside risk management, and diversification across global markets. However, specific comparative analysis of how J versus LINK performs under different inflation scenarios, monetary policy shifts, or geopolitical conditions is not available in the reference materials.
III. 2026-2031 Price Prediction: J vs LINK
Short-term Prediction (2026)
- J: Conservative $0.017-$0.024 | Optimistic $0.024-$0.030
- LINK: Conservative $6.83-$10.84 | Optimistic $10.84-$15.06
Mid-term Prediction (2028-2029)
- J may enter a growth phase, with estimated price range of $0.016-$0.044 in 2028 and $0.028-$0.052 in 2029
- LINK may enter an expansion phase, with estimated price range of $7.76-$19.12 in 2028 and $9.73-$20.44 in 2029
- Key drivers: institutional capital inflows, ETF developments, ecosystem expansion
Long-term Prediction (2030-2031)
- J: Base scenario $0.030-$0.045 | Optimistic scenario $0.045-$0.066
- LINK: Base scenario $10.71-$20.22 | Optimistic scenario $20.22-$24.46
View detailed price predictions for J and LINK
Disclaimer
Price predictions are based on historical data analysis and market trends. Cryptocurrency markets are highly volatile and unpredictable. These projections should not be considered as investment advice. Past performance does not guarantee future results. Investors should conduct their own research and consult with financial advisors before making investment decisions.
J:
| Year |
Predicted High Price |
Predicted Average Price |
Predicted Low Price |
Price Change |
| 2026 |
0.030315 |
0.0235 |
0.01692 |
0 |
| 2027 |
0.03390345 |
0.0269075 |
0.01453005 |
14 |
| 2028 |
0.0443919935 |
0.030405475 |
0.01550679225 |
29 |
| 2029 |
0.051610253265 |
0.03739873425 |
0.02842303803 |
59 |
| 2030 |
0.046729718445375 |
0.0445044937575 |
0.029818010817525 |
89 |
| 2031 |
0.06568863278607 |
0.045617106101437 |
0.031475803209991 |
94 |
LINK:
| Year |
Predicted High Price |
Predicted Average Price |
Predicted Low Price |
Price Change |
| 2026 |
15.06065 |
10.835 |
6.82605 |
0 |
| 2027 |
14.7605205 |
12.947825 |
8.67504275 |
18 |
| 2028 |
19.118758395 |
13.85417275 |
7.75833674 |
26 |
| 2029 |
20.4432173099 |
16.4864655725 |
9.727014687775 |
50 |
| 2030 |
21.973161315028 |
18.4648414412 |
10.709608035896 |
68 |
| 2031 |
24.46499166751794 |
20.219001378114 |
15.77082107492892 |
84 |
IV. Investment Strategy Comparison: J vs LINK
Long-term vs Short-term Investment Strategies
- J: May be suitable for investors with higher risk tolerance who are interested in emerging mobile-first crypto network projects and willing to accept significant volatility during early development stages
- LINK: May be suitable for investors seeking exposure to established decentralized oracle infrastructure with a longer operational history and demonstrated market presence
Risk Management and Asset Allocation
- Conservative investors: J: 10-20% vs LINK: 80-90%
- Aggressive investors: J: 40-50% vs LINK: 50-60%
- Hedging instruments: Stablecoin allocation, options strategies, cross-asset portfolio combinations
V. Potential Risk Comparison
Market Risk
- J: High volatility risk given the token's recent launch in 2025 and substantial price decline exceeding 98% from its peak of $1.50 to approximately $0.0231. Limited trading history and lower 24-hour trading volume of $23,791.11 may indicate liquidity constraints
- LINK: Moderate to high volatility risk with approximately 79% decline from its historical high of $52.70 to current levels around $10.87. Higher trading volume of $6,926,705.98 suggests relatively better liquidity conditions
Technical Risk
- J: Scalability uncertainties and network stability considerations for the mobile-first crypto network infrastructure during early development phases
- LINK: Network stability considerations related to decentralized oracle operations and potential smart contract vulnerabilities in data retrieval and off-chain computation processes
Regulatory Risk
- Global regulatory frameworks continue to evolve, potentially affecting both tokens differently based on their respective use cases. J's mobile-first network approach and LINK's oracle infrastructure may face distinct regulatory considerations across different jurisdictions
VI. Conclusion: Which Is the Better Buy?
📌 Investment Value Summary:
- J advantages: Early-stage positioning in mobile-first crypto network development, potential for growth if adoption increases, lower entry price point
- LINK advantages: Established operational history since 2017, demonstrated utility in decentralized oracle networks, higher trading volume indicating better liquidity
✅ Investment Recommendations:
- Beginner investors: Consider starting with LINK due to its longer operational track record and relatively higher liquidity. Limit initial exposure and prioritize understanding market dynamics before making allocation decisions
- Experienced investors: May consider diversified allocation between both assets based on risk tolerance. LINK could serve as a core holding while J might represent a smaller, speculative position
- Institutional investors: Conduct thorough due diligence on both assets' fundamentals, regulatory compliance, and ecosystem development. Consider gradual position building with appropriate risk management frameworks
⚠️ Risk Warning: The cryptocurrency market exhibits extreme volatility. This article does not constitute investment advice.
VII. FAQ
Q1: What is the main difference between J and LINK in terms of their core functionality?
J is a mobile-first crypto network token launched in 2025, while LINK is a decentralized oracle network token operating since 2017. J focuses on building mobile-centric crypto infrastructure starting with the JamboPhone initiative, whereas LINK facilitates data connectivity between blockchain smart contracts and real-world information by compensating node operators for data retrieval, formatting, and off-chain computation services.
Q2: Which asset has experienced greater price volatility since launch?
J has experienced greater volatility, declining over 98% from its all-time high of $1.50 to approximately $0.0231. LINK has declined approximately 79% from its peak of $52.70 to current levels around $10.87. J's more dramatic price movement reflects its status as a newly launched token with limited trading history, while LINK's volatility, though significant, has been moderated by its longer operational track record and higher liquidity.
Q3: What are the liquidity differences between J and LINK?
LINK demonstrates substantially higher liquidity with a 24-hour trading volume of $6,926,705.98 compared to J's $23,791.11. This approximately 291x difference in trading volume indicates that LINK offers significantly better market depth, easier position entry and exit, and reduced slippage risk for traders. Lower liquidity in J may result in wider bid-ask spreads and greater difficulty executing large orders without impacting market price.
Q4: How should conservative investors allocate between J and LINK?
Conservative investors should consider a J: 10-20% vs LINK: 80-90% allocation ratio. This approach prioritizes exposure to LINK's established infrastructure and operational history while maintaining limited experimental allocation to J. The higher LINK weighting reflects its longer track record, better liquidity conditions, and demonstrated utility in the decentralized oracle ecosystem, which aligns with risk-averse investment principles.
Q5: What are the primary regulatory risks facing J and LINK?
Both tokens face evolving global regulatory frameworks, but potentially in different ways. J's mobile-first network approach may encounter regulatory scrutiny related to mobile telecommunications, cross-border data transfer, and consumer protection laws. LINK's oracle infrastructure may face regulation concerning data authenticity, smart contract compliance, and financial services integration. Regulatory treatment may vary significantly across jurisdictions as authorities develop specific frameworks for blockchain infrastructure and decentralized network services.
Q6: What market conditions would favor J over LINK for investment?
J may outperform LINK during conditions favoring early-stage technology adoption, particularly if mobile-first crypto infrastructure gains mainstream traction. Scenarios include increased smartphone penetration in emerging markets, successful JamboPhone deployment, strategic partnership announcements, or broader acceptance of mobile-centric blockchain solutions. Additionally, during risk-on market environments where investors favor higher-beta assets with greater upside potential, J's lower price point and early development stage might attract speculative capital.
Q7: How do the 2031 price predictions compare between J and LINK?
By 2031, J's predicted price ranges from $0.031475803 (low) to $0.06568863 (high) with an average of $0.045617106, representing a potential 94% increase from 2026 levels. LINK's predicted range extends from $15.77082 (low) to $24.46499 (high) with an average of $20.219001, representing an 84% potential increase. While both projections suggest positive long-term trends, these predictions remain speculative and subject to numerous market variables including adoption rates, competitive dynamics, and macroeconomic conditions.
Q8: What factors should institutional investors prioritize when comparing J and LINK?
Institutional investors should conduct comprehensive due diligence focusing on: operational track record (LINK's 8+ years vs J's recent launch), liquidity depth for position building and exit strategies, regulatory compliance frameworks in target jurisdictions, ecosystem development and partnership quality, technical infrastructure robustness, team expertise and governance structures, and custodial solution availability. Additionally, institutions should assess correlation with broader portfolio holdings, volatility impact on risk-adjusted returns, and alignment with investment mandate constraints regarding experimental versus established digital assets.
* The information is not intended to be and does not constitute financial advice or any other recommendation of any sort offered or endorsed by Gate.