# Article Overview: KCAL vs BTC Energy Cost Comparison
This comprehensive analysis compares KCAL and Bitcoin (BTC) across investment fundamentals, price trajectories, and market positioning. The article addresses critical questions for cryptocurrency investors evaluating which asset offers better value. Through historical price data, tokenomics analysis, institutional adoption metrics, and 2026-2031 price forecasts, readers gain actionable insights into both assets' growth potential and risk profiles.
**Key Topics Covered:**
- Historical price performance: KCAL's 98% decline versus BTC's institutional resilience
- Supply mechanisms: Bitcoin's fixed 21M cap versus KCAL's limited transparency
- Market adoption: Enterprise integration and regulatory landscape
- Investment strategies: Portfolio allocation frameworks for conservative to aggressive investors
- Risk assessment: Liquidity, technical, and regulatory considerations
**Ideal For:** Beginner to experienced investors seeking comparative analysis on cryp
Introduction: KCAL vs BTC Investment Comparison
In the cryptocurrency market, the comparison between KCAL and BTC has always been a topic investors cannot avoid. The two differ significantly in market ranking, application scenarios, and price performance, representing different positioning within crypto assets.
KCAL is an in-game token for Step.app, a gamified metaverse platform for the fitness economy that supports staking, lottery, repair, minting new sneakers, upgrading, and accelerating sneakers.
Bitcoin (BTC), since its introduction by Satoshi Nakamoto in 2008, has been recognized as digital gold and is the world's highest traded and highest market cap cryptocurrency, operating as a decentralized P2P payment system based on open-source software and blockchain technology.
This article will provide a comprehensive analysis of KCAL vs BTC investment value comparison across historical price trends, supply mechanisms, market adoption, and ecosystem development, attempting to address the question investors care most about:
"Which is the better buy right now?"
I. Price History Comparison and Current Market Status
KCAL and BTC Historical Price Trends
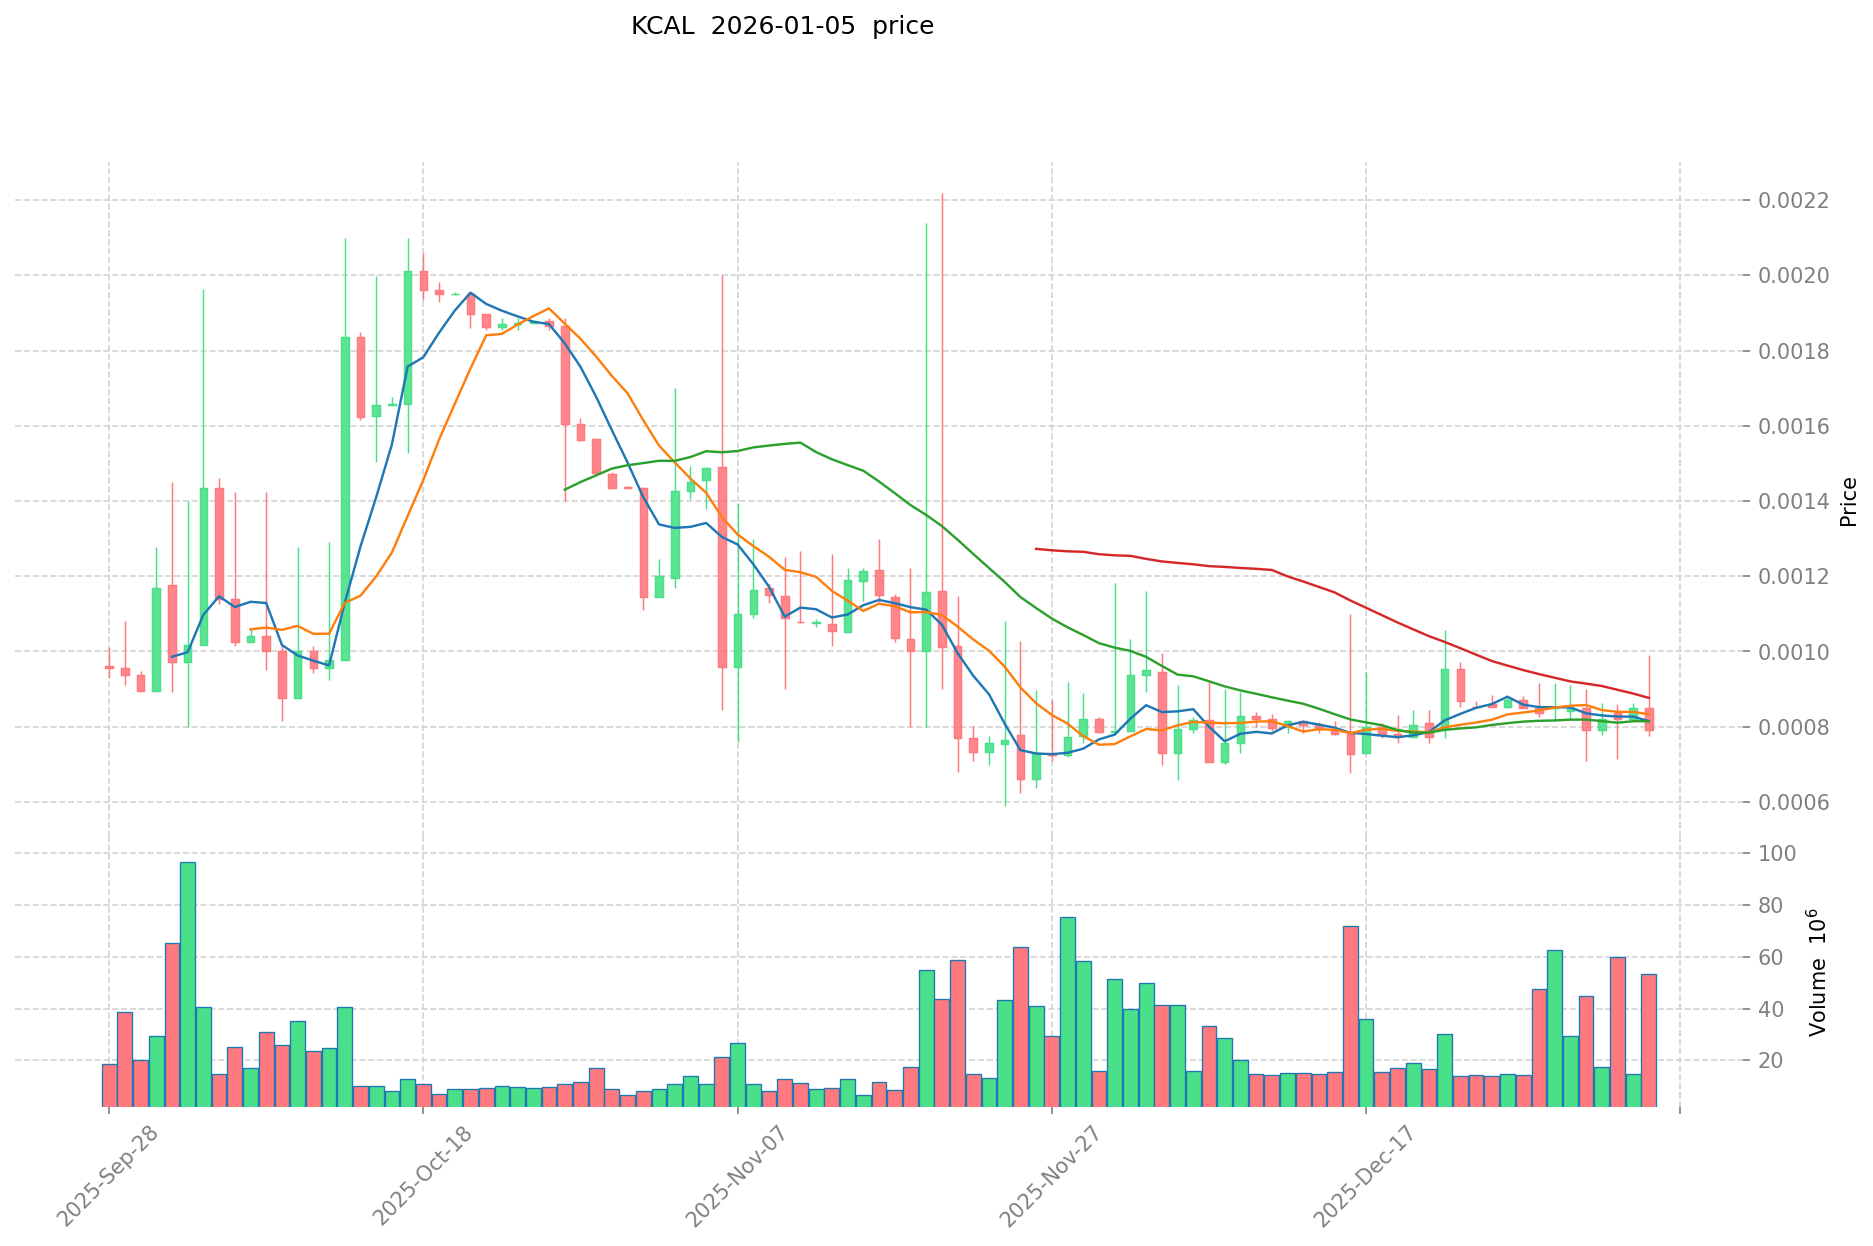
- 2022: KCAL reached its all-time high of $5 on November 8, 2022, reflecting early market enthusiasm for the Step.app fitness gaming ecosystem.
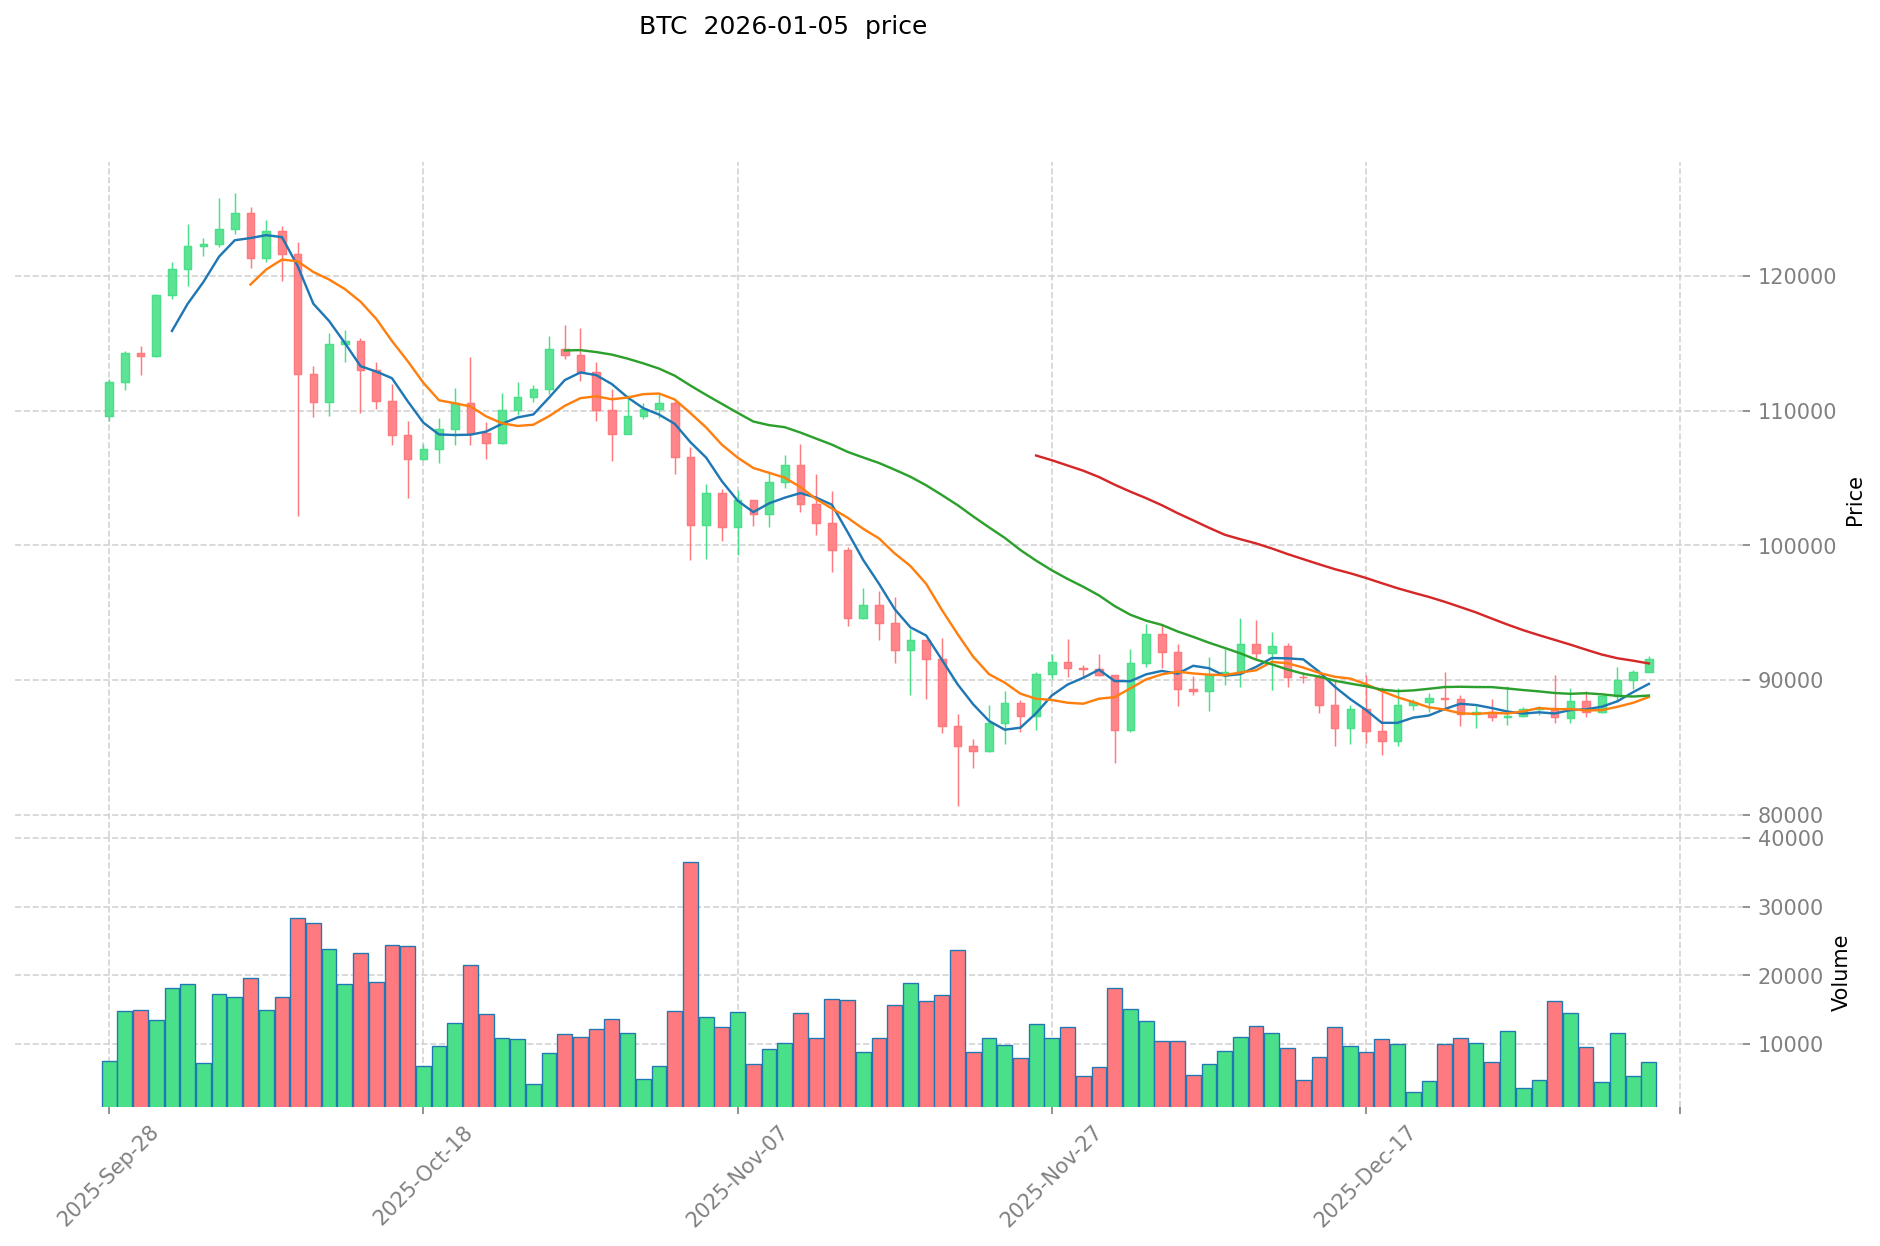
- 2025: BTC achieved its all-time high of $126,080 on October 7, 2025, driven by institutional adoption and macroeconomic tailwinds.
- Comparative Analysis: In the 2022-2025 market cycle, KCAL experienced a dramatic decline from its $5 peak to $0.00059812 (November 24, 2025), representing a 98.01% loss over one year. In contrast, BTC demonstrated greater resilience, fluctuating between $67.81 (all-time low in 2013) and $126,080, maintaining significantly stronger price stability and recovery potential despite market volatility.
Current Market Status (January 6, 2026)
- KCAL current price: $0.0007993
- BTC current price: $93,972
- 24-hour trading volume: KCAL $80,537.57 vs BTC $1,082,643,125.20
- Market Sentiment Index (Fear & Greed Index): 26 (Fear)
Click to view real-time prices:
- View KCAL current price Market Price
- View BTC current price Market Price
影响 KCAL vs BTC 投资价值的核心因素
供应机制对比(Tokenomics)
- Bitcoin: Fixed supply mechanism with a maximum of 21 million BTC that will never be increased. Bitcoin implements a halving schedule approximately every four years, which reduces block rewards and creates a deflationary supply model. This scarcity design is fundamental to Bitcoin's value proposition.
- KCAL: Limited information available regarding specific tokenomics and supply mechanisms in the provided materials.
- 📌 Historical Pattern: Bitcoin's fixed supply of 21 million coins combined with its halving mechanism has historically created cyclical price movements, with each halving event marking significant market inflection points.
机构采用与市场应用
- Institutional Holdings: Bitcoin has achieved significant institutional adoption, with various governments and major financial institutions now including it in their asset portfolios and balance sheets.
- 企业应用: According to the reference materials, as of 2022, global cryptocurrency users exceeded 320 million, representing approximately 4.2% of the global population. The current development stage of cryptocurrency is roughly equivalent to the internet in the late 1990s. Major Web2 companies including Starbucks (27.4 million members), Nike (over 300 million members), Visa and Mastercard (over 600 million cardholders) are actively embracing Web3 technologies, indicating potential for cryptocurrency penetration into mainstream business applications.
- 国家政策: Bitcoin faces value volatility concerns and remains subject to varying regulatory approaches across different jurisdictions.
技术发展与生态建设
- Bitcoin Technology Development: Since its inception in 2009, Bitcoin has experienced frequent and significant price fluctuations influenced by market sentiment, policy changes, and technological advancements. These fluctuations reflect investors' evolving understanding of Bitcoin's value.
- KCAL Technology: Specific technological development details are not available in the provided materials.
- 生态对比: The cryptocurrency ecosystem continues to develop across multiple areas including decentralized finance (DeFi), non-fungible tokens (NFT), payment solutions, and smart contract implementations.
宏观经济与市场周期
- 通胀环境下的表现: Cryptocurrencies face value stability issues. Bitcoin's fixed supply of 21 million coins creates an inverse relationship with global monetary expansion. When central banks increase money supply, Bitcoin's scarcity becomes relatively more valuable. However, cryptocurrency assets remain highly volatile and are not universally recognized as reliable inflation hedges.
- 宏观货币政策: Interest rate changes, US dollar index movements, and central bank monetary policy decisions directly influence cryptocurrency valuations. The relationship between global M2 growth and Bitcoin price demonstrates cryptocurrency sensitivity to macroeconomic conditions.
- 地缘政治因素: Cross-border transaction demands and international geopolitical situations influence cryptocurrency adoption and usage patterns.
III. 2026-2031 Price Forecast: KCAL vs BTC
Short-term Forecast (2026)
- KCAL: Conservative $0.000631-$0.000799 | Optimistic $0.000863
- BTC: Conservative $57,251-$93,855 | Optimistic $104,179
Mid-term Forecast (2028-2029)
- KCAL may experience consolidation phase, with expected price range $0.000519-$0.001194
- BTC may enter bull market phase, with expected price range $96,641-$172,504
- Key drivers: institutional capital inflows, spot ETF adoption, ecosystem development, market sentiment cycles
Long-term Forecast (2030-2031)
- KCAL: Base case $0.000863-$0.001235 | Optimistic scenario $0.001361-$0.001654
- BTC: Base case $150,796-$183,336 | Optimistic scenario $207,939-$247,503
View detailed KCAL and BTC price predictions
KCAL:
| 年份 |
预测最高价 |
预测平均价格 |
预测最低价 |
涨跌幅 |
| 2026 |
0.000863244 |
0.0007993 |
0.000631447 |
0 |
| 2027 |
0.00089777376 |
0.000831272 |
0.00069826848 |
4 |
| 2028 |
0.0011757511168 |
0.00086452288 |
0.000518713728 |
8 |
| 2029 |
0.001193560288128 |
0.0010201369984 |
0.000581478089088 |
27 |
| 2030 |
0.001361423831214 |
0.001106848643264 |
0.000863341941745 |
38 |
| 2031 |
0.0016537425579 |
0.001234136237239 |
0.000987308989791 |
54 |
BTC:
| 年份 |
预测最高价 |
预测平均价格 |
预测最低价 |
涨跌幅 |
| 2026 |
104179.05 |
93855 |
57251.55 |
0 |
| 2027 |
142584.516 |
99017.025 |
77233.2795 |
5 |
| 2028 |
169121.0787 |
120800.7705 |
96640.6164 |
28 |
| 2029 |
172503.500274 |
144960.9246 |
107271.084204 |
54 |
| 2030 |
207939.19829247 |
158732.212437 |
150795.60181515 |
68 |
| 2031 |
247503.20224239225 |
183335.705364735 |
122834.92259437245 |
95 |
四、投资策略对比:KCAL vs BTC
长期 vs 短期投资策略
- KCAL:适合关注生态潜力、寻求高成长机会的投资者,但需承受Step.app平台发展不确定性和高波动性风险
- BTC:适合寻求资产保值、抗通胀属性的投资者,以及追求市场流动性和机构级别投资机会的长期持有者
风险管理与资产配置
- 保守型投资者:KCAL 5% vs BTC 95%,强调BTC作为基础资产的稳定性和流动性优势
- 激进型投资者:KCAL 25% vs BTC 75%,在保持BTC核心配置基础上,适度配置KCAL以获取潜在高收益
- 对冲工具:稳定币配置用于风险管理、期权策略应对BTC波动、跨币种组合降低单一资产风险
五、潜在风险对比
市场风险
- KCAL:从2022年$5高位下跌98.01%至$0.00059812,面临流动性不足(24小时交易量$80,537.57)、生态依赖Step.app平台发展、市场认可度偏低的风险
- BTC:虽具较强抗风险能力,但仍面临市场情绪波动(当前恐惧指数为26)、宏观经济环境变化、跨境政策管制等系统性风险
技术风险
- KCAL:参考资料未提供技术发展详情,存在平台稳定性、游戏经济模型可持续性的未知风险
- BTC:运行超过16年已证明网络稳定性,但面临算力集中度问题、挖矿难度调整机制、潜在的量子计算威胁
监管风险
- 全球监管政策对BTC关注度更高,各国政府态度存在差异,但主流金融机构已逐步认可;KCAL作为游戏生态代币,面临游戏监管、虚拟资产监管的多重不确定性
六、结论:Which Is the Better Buy?
📌 投资价值总结:
- KCAL优势:作为Step.app生态代币,具有GameFi应用场景、潜在成长机会;2030-2031年预测涨幅可达38%-54%
- BTC优势:21百万固定供应量的稀缺性、四年减半的通胀对冲机制、全球机构采用、市场流动性充足(24小时交易量超10亿美元)、2030-2031年预测涨幅可达68%-95%
✅ 投资建议:
- 新手投资者:优先选择BTC作为主要配置,原因是流动性强、信息透明、风险相对可控,配置比例70%-80%;可配置少量KCAL(10%-20%)以学习生态代币特性
- 有经验投资者:根据风险偏好采用BTC+KCAL组合策略,保守策略以BTC为核心(85%+),积极策略可增加KCAL配置至25%-30%;通过定期调整比例进行风险管理
- 机构投资者:以BTC作为核心资产配置,通过现货ETF、期货等标准化工具获取敞口;对KCAL的评估需基于Step.app平台的商业模式、用户增长、代币经济学深入研究
⚠️ 风险提示:加密货币市场波动性极高,本文不构成投资建议。KCAL历史表现反映其高风险属性,BTC虽具相对稳定性但仍受宏观经济、政策变化影响。投资前应充分了解自身风险承受能力,建议咨询专业财务顾问。
FAQ
KCAL是什么?与BTC比特币有什么区别?
KCAL是一种加密货币资产,BTC是市值最大的比特币。两者在价格、市值、流通供应量和生态应用场景上存在显著差异。KCAL专注于特定领域生态,而BTC是全球公认的价值储存标的。
KCAL和BTC在技术架构上有哪些主要差异?
BTC采用工作量证明(PoW)共识机制,KCAL基于绿色能源区块链架构。BTC区块生成约10分钟,KCAL更快。BTC总量2100万枚,KCAL专注可再生能源应用场景,技术设计目标差异明显。
KCAL相比BTC的优势和劣势分别是什么?
KCAL优势:运动挖矿机制,激励用户健身;劣势:市场认可度低,流动性小。BTC优势:全球公认价值储存,流动性强;劣势:波动性大,无实际应用场景。
KCAL和BTC哪个更适合投资?风险分别是什么?
BTC作为主流加密货币,流动性强且相对稳定,适合保守投资者。KCAL作为功能型代币,增长潜力大但波动性较高。BTC风险在于市场饱和,KCAL风险在于应用依赖性。根据风险偏好选择。
KCAL的市场流动性和交易额与BTC相比如何?
KCAL的市场流动性和交易额远低于BTC。BTC作为全球最大加密货币,交易额和市场流动性持续处于行业最高水平,而KCAL则处于相对较小的体量。
KCAL和BTC的共识机制有什么不同?
KCAL采用DPoS共识机制,通过选举验证节点确认交易;BTC采用PoW共识机制,通过计算哈希解谜验证交易。DPoS效率更高,BTC安全性更强。
* The information is not intended to be and does not constitute financial advice or any other recommendation of any sort offered or endorsed by Gate.