This comprehensive guide explores the Long Wick Candlestick pattern, a powerful price action indicator revealing market psychology and potential trend reversals. The article dissects how extended shadows—2-3 times the candle body—signal strong rejection by buyers or sellers at critical price levels. It explains bullish reversals (Hammer patterns with lower wicks) during downtrends and bearish signals (Shooting Star patterns with upper wicks) during uptrends, demonstrating the intense battle between bulls and bears. Essential for traders, this guide emphasizes combining long wick patterns with support/resistance zones, volume confirmation, moving averages, and risk management protocols. Learn to set precise stop-loss and take-profit levels on Gate exchange while avoiding false signals through multi-indicator validation and understanding market cycles across uptrends, downtrends, and consolidation phases.
Key Takeaways
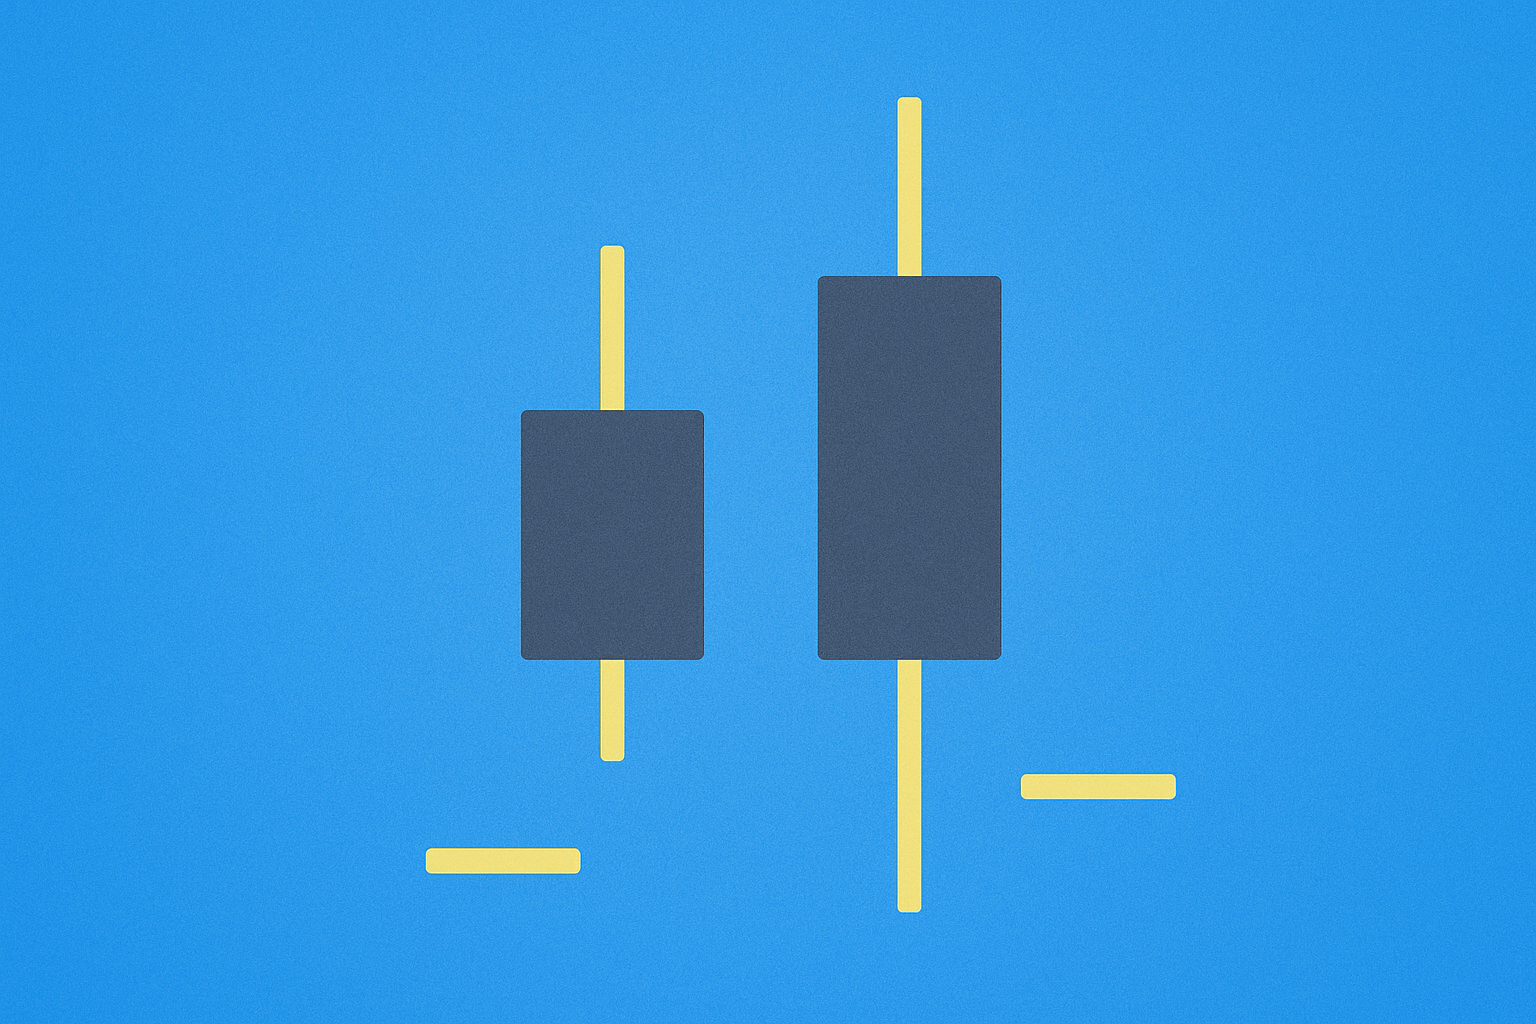
The "John Wick Candle" (Long Wick) represents one of the most straightforward yet powerful price action indicators, signaling potential sharp reversals in market trends with remarkable accuracy.
- Long wicks feature shadows that extend 2-3 times beyond the candle body, visually representing strong rejection by either buyers or sellers and revealing underlying market psychology.
- Bullish long wicks (lower shadows) appearing at the end of downtrends suggest potential upward reversals, while bearish long wicks (upper shadows) at uptrend peaks warn of possible downward corrections.
- These patterns should not be used in isolation, as false signals are common. Traders should combine them with trend analysis, volume confirmation, subsequent price action, and other technical indicators for validation.
- Stop-loss and take-profit levels should be carefully set based on the wick's extremities and significant support or resistance zones to manage risk effectively.
A long wick candlestick pattern has earned its reputation among traders as a reliable signal for trend reversals. The defining characteristic of this pattern is the extended shadow (wick) that protrudes significantly from the candle's real body.
As a bullish reversal signal, the long wick typically emerges during the final stages of a downtrend. This formation, also known as a "Hammer," features a small real body positioned near the top of the candle, minimal or no upper shadow, and an extended lower shadow. This structure demonstrates that although selling pressure initially drove prices substantially lower during the session, buyers aggressively stepped in to push prices back up, resulting in a close near the session's higher levels.
Conversely, the bearish reversal signal manifests during the conclusion of an uptrend. This pattern, referred to as a "Shooting Star," displays a small real body near the bottom of the candle, minimal or no lower shadow, and a prominent upper shadow. This configuration indicates that buyers attempted to drive prices higher, but sellers seized control and forced the closing price significantly lower.
These long wick patterns serve as visual representations of intense battles between bulls and bears, with the extended shadows marking the rejected price levels where one side overwhelmed the other. Understanding the context in which these patterns appear—whether at trend extremes or within consolidation phases—is crucial for accurate interpretation and successful trading decisions.
Why Is It Called the "John Wick Candle"?
The term "John Wick Candle" serves as a powerful metaphor that perfectly captures the intense and decisive action witnessed in financial markets. In the popular film series, Keanu Reeves portrays John Wick as a legendary assassin who stands at the pinnacle of his profession. His character embodies extraordinary efficiency, relentless determination, and the ability to instantly reverse seemingly impossible situations, fundamentally altering the course of battle.
Long Wick as the Weapon of Rejection
The most distinctive feature of this candlestick pattern is its extended wick, which serves as a visible record of an intense struggle in the marketplace.
-
During Uptrends (Bearish John Wick/Shooting Star): The elongated upper shadow reveals that bulls (buyers) aggressively pushed prices higher during the trading session. However, powerful selling pressure suddenly emerged, completely overwhelming the bullish momentum and rejecting those elevated price levels. This dramatic reversal demonstrates the bears' ability to seize control with precision and force, much like the titular character's swift and decisive actions.
-
During Downtrends (Bullish John Wick/Hammer): The extended lower shadow tells the opposite story. Bears (sellers) initially dominated the session, potentially triggering panic selling and driving prices to new lows. Yet, in a sudden and overwhelming display of strength, substantial buying power emerged to aggressively push prices back up. This represents the bulls' capacity to reverse a dire situation in moments, mirroring the protagonist's ability to turn the tables against overwhelming odds.
The length and position of these wicks serve as forensic evidence of market psychology, revealing the exact price levels where one side's conviction proved insufficient against the other's determination. The more extreme the wick, the more violent the rejection, and the stronger the signal of potential reversal.
Small Body Equals Professional Efficiency
A characteristic John Wick Candle typically features a relatively small real body compared to its extended wick. Despite significant price volatility during the session, the difference between opening and closing prices remains limited. This efficiency symbolizes the precision and effectiveness of the reversal, much like a professional assassin's economical use of resources to achieve maximum impact.
The compact body indicates that after all the dramatic price movement represented by the long shadow, the market settled near where it started, suggesting that the attempted move in one direction was completely negated. This rejection efficiency makes the pattern particularly powerful when it appears at critical support or resistance levels, signaling that a major shift in market sentiment may be underway.
The Psychology Behind Long Wick Candles
Long wick candles provide a window into the collective psychology of market participants, revealing the emotional battles that unfold within a single trading session.
-
Bullish Long Wick (Extended Lower Shadow): When this pattern emerges during a downtrend, it tells a story of initial capitulation followed by determined recovery. Sellers initially dominated, driving prices to new lows and potentially triggering stop-loss orders and panic selling. However, at these depressed levels, buyers recognized value and aggressively entered the market. This buying pressure was sufficiently strong to not only halt the decline but to push prices back up significantly, closing near the session's higher levels. The rejection of lower prices signals that sellers may have exhausted their strength and that buyers are beginning to assert control, potentially marking a trend reversal point.
-
Bearish Long Wick (Extended Upper Shadow): This formation appears during uptrends and reveals a different psychological dynamic. Buyers initially pushed prices higher with enthusiasm, possibly breaking through resistance levels and attracting momentum traders. However, at these elevated prices, sellers emerged in force—whether through profit-taking by existing holders or new short positions being established. The selling pressure proved strong enough to completely reverse the session's gains, pushing the close back down near the opening level. This rejection of higher prices suggests that buyers may be losing conviction and that sellers are gaining strength, potentially signaling an impending downward reversal.
-
Spinning Top (Extended Shadows on Both Sides): When a candle displays long wicks extending both above and below a small real body, it represents market indecision and equilibrium between bulls and bears. This pattern frequently appears at inflection points or during consolidation phases, indicating that neither side has established clear dominance. The market tested both higher and lower prices during the session but ultimately settled near where it began, suggesting uncertainty about future direction. Spinning tops often precede significant moves as the market resolves this indecision in one direction or the other.
Understanding these psychological dynamics helps traders recognize not just the technical pattern but the underlying sentiment shift that may drive subsequent price action. The longer the wick and the smaller the body, the more emphatic the rejection and the stronger the psychological message being conveyed by the market.
Candles With Long Wicks on Both Sides
Certain candlestick formations feature extended shadows projecting from both the upper and lower extremities of the candle. These patterns are distinguished from standard "long wick" candles and are specifically identified as "Spinning Tops." The defining characteristics include a small real body positioned centrally
FAQ
What is a long wick candle? What does it represent in technical analysis?
A long wick candle indicates significant price movement during a trading session. It represents strong buyer or seller pressure depending on direction. Long wicks suggest potential trend reversals or resistance/support rejection in market analysis.
What are the common trading signals and patterns of long wick candles? How to identify buying and selling opportunities?
Long wick candles signal strong buying or selling pressure. Two consecutive candles with long wicks often predict reversals. Use long wicks to identify supply/demand zones and confirm entry/exit points at key resistance and support levels.
What risks should be noted in long wick candlestick trading strategy? How to set stop loss and take profit?
Monitor market volatility risk carefully. Set stop loss below 5% and take profit between 10%-15%. Use strict position sizing and avoid trading during low liquidity periods. Always plan exits before entering trades.
What is the difference between long wick candles and other candlestick patterns such as hammer and hanging man?
Long wick candles differ from hammer and hanging man patterns in structure. Hammers and hanging man have distinct upper and lower wicks with small bodies, while long wick candles feature extended wicks on one or both sides with varying body positions, serving different technical analysis purposes in trading.
How is the signal effect of long wick candles in different market cycles (uptrend, downtrend, sideways market)?
In uptrends, long wicks signal potential reversals or consolidation. In downtrends, they indicate exhaustion and possible trend change. In sideways markets, long wicks suggest indecision between buyers and sellers, helping identify breakout opportunities.
How to combine other technical indicators (such as support/resistance levels and moving averages) to enhance long wick candlestick trading signals?
Combine long wick signals with support/resistance confirmation and moving average trends. Use RSI for momentum validation. Multiple indicator alignment strengthens entry signals and improves trading accuracy.
* The information is not intended to be and does not constitute financial advice or any other recommendation of any sort offered or endorsed by Gate.