This comprehensive analysis compares MAY and UNI across critical investment dimensions, addressing which asset suits different investor profiles. MAY, launched in 2025 as an AI-powered DeFi assistant on Solana, trades at $0.01128 with $2.45M market cap, representing emerging innovation with elevated volatility and limited liquidity ($20,653 daily volume). UNI, the established Ethereum-based AMM protocol since 2020, trades at $3.992 with $2.53B market cap and substantial liquidity ($3.6M daily volume), offering infrastructure maturity and token burn mechanisms for value capture. The article examines historical price trends, tokenomics differences, ecosystem positioning, and 2026-2031 price forecasts, revealing MAY's potential upside alongside heightened risks, while UNI provides stability through proven DeFi infrastructure. Investment strategy recommendations differentiate between conservative investors favoring UNI and aggressive investors considering MAY exposure for portfolio diversification, accounting for
Introduction: MAY vs UNI Investment Comparison
In the cryptocurrency market, the comparison between MAY and UNI continues to attract investor attention. The two projects show notable differences in market cap rankings, application scenarios, and price performance, representing distinct positioning within the crypto asset landscape.
Mayflower (MAY): Launched in 2025, this project positions itself as an AI-powered assistant layer for DeFi operations. Built on Solana, Mayflower AI converts natural language requests into real-time on-chain actions, automating tasks and streamlining multichain exploration through integration with protocols like Jupiter.
Uniswap (UNI): Since its launch in 2020, UNI has established itself as a pioneering automated market maker protocol on Ethereum. With 387,770 holders and listings on 65 exchanges, it represents one of the established DeFi infrastructure projects in the crypto ecosystem.
This article examines the investment comparison between MAY and UNI across multiple dimensions including historical price trends, supply mechanisms, adoption metrics, technical ecosystems, and market positioning, addressing a key question for investors:
"Which asset presents different risk-return characteristics for portfolio consideration?"
As of February 1, 2026, MAY trades at $0.01128 with a market cap of $2.45 million (ranked #1936), while UNI trades at $3.992 with a market cap of $2.53 billion (ranked #39). The substantial differences in market maturity, liquidity, and ecosystem development create distinct considerations for investment analysis.
I. Historical Price Comparison and Current Market Status
MAY (Coin A) and UNI (Coin B) Historical Price Trends
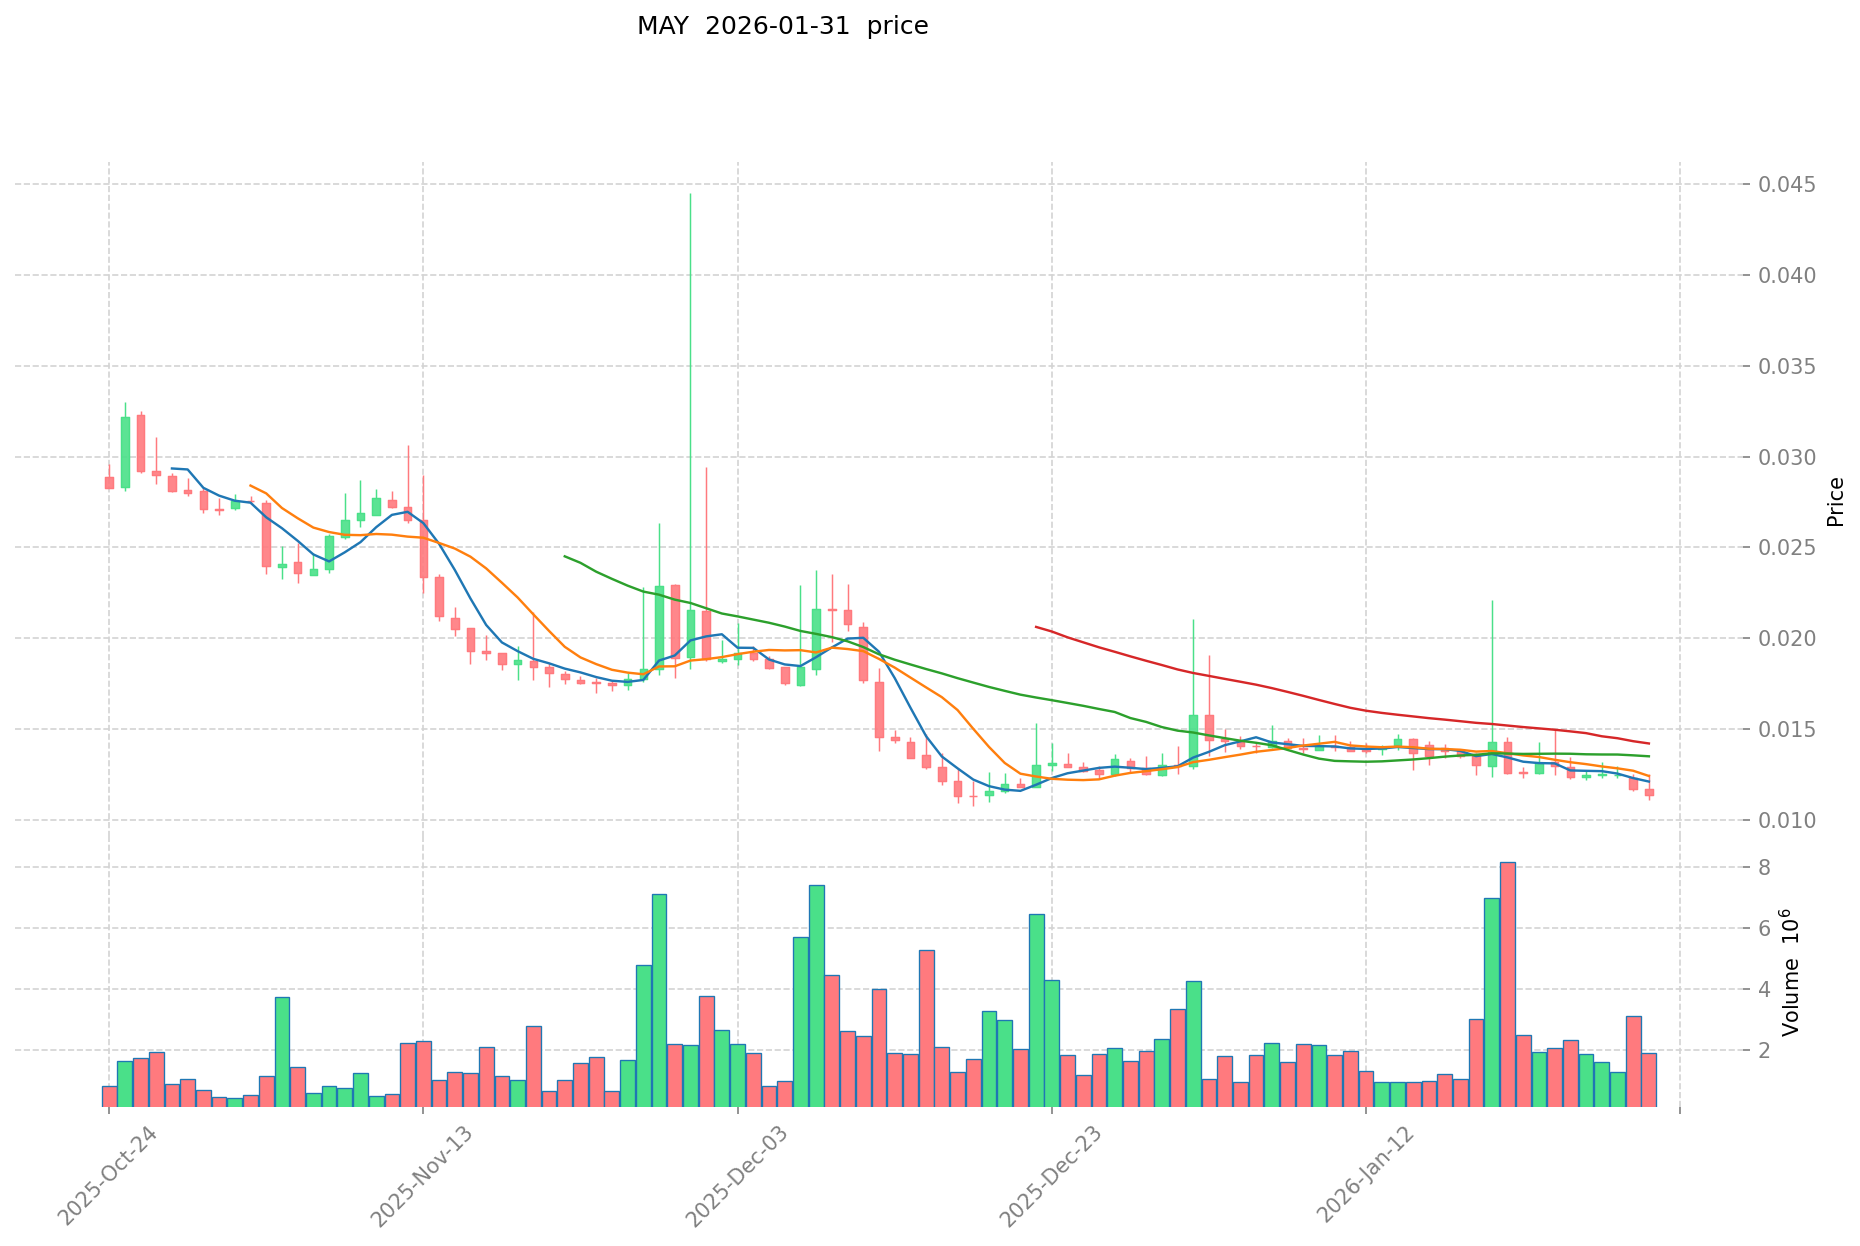
- 2025: MAY experienced significant volatility following its launch in July 2025, reaching an all-time high of $0.07318 on July 4, 2025, before declining.
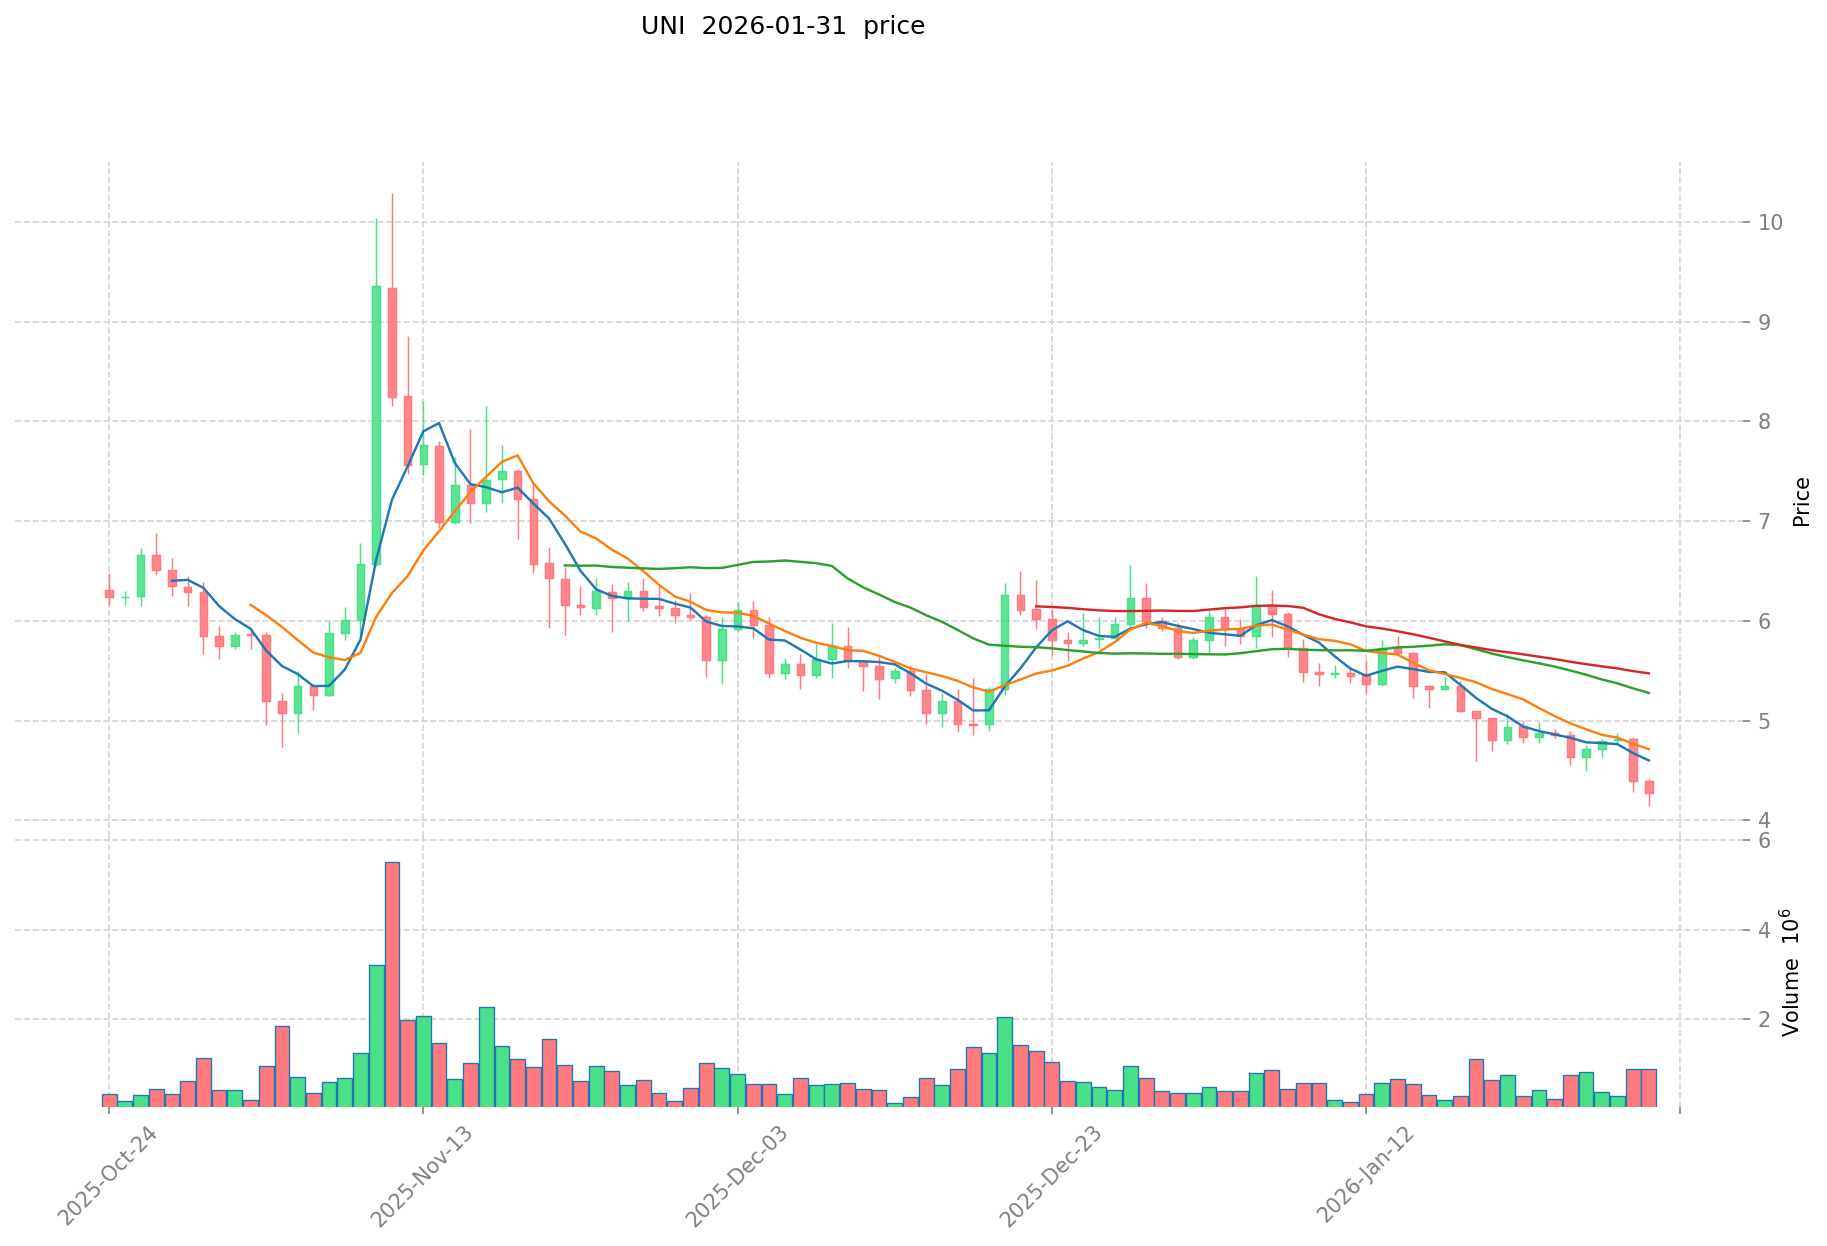
- 2021: UNI was influenced by the Uniswap V2 launch milestone, with the price reaching an all-time high of $44.92 on May 3, 2021.
- Comparative Analysis: During the recent market cycle, MAY declined from its peak of $0.07318 to a low of $0.01074 on December 18, 2025, representing a substantial correction. In contrast, UNI has shown more moderate fluctuations, declining from its 2021 high of $44.92 to current levels around $3.992, reflecting longer-term price adjustment.
Current Market Situation (2026-02-01)
- MAY current price: $0.01128
- UNI current price: $3.992
- 24-hour trading volume: MAY $20,653.09 vs UNI $3,604,670.85
- Market Sentiment Index (Fear & Greed Index): 20 (Extreme Fear)
View real-time prices:
II. Core Factors Influencing MAY vs UNI Investment Value
Supply Mechanism Comparison (Tokenomics)
-
UNI: The protocol implements a token burn mechanism where fees generated by the protocol are used to programmatically burn UNI tokens, creating value accumulation for token holders. The fee distribution model between liquidity providers (LPs) and the protocol has been established since inception.
-
MAY: Specific supply mechanism information was not available in the materials.
-
📌 Historical Pattern: Token burn mechanisms can potentially create deflationary pressure, influencing price dynamics through reduced circulating supply over time.
Institutional Adoption and Market Application
-
Institutional Holdings: The materials did not provide specific comparative data on institutional preference between MAY and UNI.
-
Enterprise Adoption: UNI operates within the decentralized finance (DeFi) ecosystem, primarily serving as a governance token for the Uniswap protocol. Information regarding enterprise adoption in cross-border payments, settlement, or portfolio integration was not detailed in the materials.
-
National Policies: Regulatory attitudes toward these assets vary across jurisdictions, though specific comparative analysis was not available in the reference materials.
Technology Development and Ecosystem Building
-
UNI Technology: The protocol features a fee switch mechanism that enables protocol-level value capture through systematic token burns. The fee allocation framework between liquidity providers and protocol operations represents a core structural element.
-
MAY Technology: Technology development details were not available in the reference materials.
-
Ecosystem Comparison: UNI operates within the DeFi sector with established liquidity provision infrastructure. The protocol's relationship configuration, distribution channels, and financial technology components form barriers to market entry. Specific comparative analysis of DeFi, NFT, payment, and smart contract implementation was not detailed in the materials.
Macroeconomic Factors and Market Cycles
-
Performance in Inflationary Environments: The materials noted that multiple factors contribute to financial market dynamics, including innovation patterns, global liquidity conditions, and extended periods of macroeconomic and financial imbalances. However, specific comparative analysis of inflation-hedging properties was not available.
-
Macroeconomic Monetary Policy: Asset portfolio returns correlate with market factor exposure, which fluctuates with business cycles, interest rates, and technological developments. Risk and return symmetry represents a core investment concept, though specific impact analysis on MAY and UNI was not detailed.
-
Geopolitical Factors: Global economic interconnectedness and international production fragmentation influence financial markets. Cross-border transaction demand and international conditions represent relevant considerations, though specific comparative analysis was not available in the reference materials.
III. 2026-2031 Price Prediction: MAY vs UNI
Short-term Forecast (2026)
- MAY: Conservative $0.0087-$0.0113 | Optimistic $0.0113-$0.0159
- UNI: Conservative $2.52-$4.00 | Optimistic $4.00-$4.48
Mid-term Forecast (2028-2029)
- MAY may enter a consolidation phase with potential accumulation, with projected price range of $0.0090-$0.0235 in 2028 and $0.0144-$0.0224 in 2029
- UNI may experience gradual growth momentum, with projected price range of $3.24-$5.99 in 2028 and $3.39-$6.98 in 2029
- Key drivers: institutional capital flows, ETF developments, ecosystem expansion
Long-term Forecast (2030-2031)
- MAY: Base scenario $0.0194-$0.0210 | Optimistic scenario $0.0222-$0.0274
- UNI: Base scenario $4.39-$6.10 | Optimistic scenario $6.80-$8.23
View detailed price predictions for MAY and UNI
Disclaimer
MAY:
| Year |
Predicted High Price |
Predicted Average Price |
Predicted Low Price |
Price Change |
| 2026 |
0.0158625 |
0.01125 |
0.0086625 |
0 |
| 2027 |
0.018165375 |
0.01355625 |
0.007320375 |
20 |
| 2028 |
0.0234740025 |
0.0158608125 |
0.009040663125 |
41 |
| 2029 |
0.02242084455 |
0.0196674075 |
0.014357207475 |
74 |
| 2030 |
0.0273573638325 |
0.021044126025 |
0.019360595943 |
87 |
| 2031 |
0.0271048343202 |
0.02420074492875 |
0.02226468533445 |
115 |
UNI:
| Year |
Predicted High Price |
Predicted Average Price |
Predicted Low Price |
Price Change |
| 2026 |
4.48336 |
4.003 |
2.52189 |
0 |
| 2027 |
4.6250662 |
4.24318 |
4.1158846 |
5 |
| 2028 |
5.986066185 |
4.4341231 |
3.236909863 |
10 |
| 2029 |
6.98152682095 |
5.2100946425 |
3.386561517625 |
29 |
| 2030 |
8.22934448782875 |
6.095810731725 |
4.388983726842 |
52 |
| 2031 |
7.807209594656793 |
7.162577609776875 |
6.804448729288031 |
78 |
IV. Investment Strategy Comparison: MAY vs UNI
Long-term vs Short-term Investment Strategies
-
MAY: May suit investors with higher risk tolerance seeking early-stage DeFi innovation exposure. The asset's relatively recent launch in July 2025 and smaller market capitalization suggest characteristics associated with emerging projects in the AI-powered DeFi assistant sector.
-
UNI: May suit investors seeking exposure to established DeFi infrastructure with demonstrated longevity. Operating since 2020 with significant holder base (387,770 holders) and exchange listings (65 exchanges), UNI represents positioning within mature decentralized exchange governance.
Risk Management and Asset Allocation
-
Conservative Investors: A conservative approach might consider larger allocation to UNI given its established market presence, liquidity depth ($3.6 million 24h volume vs MAY's $20,653), and longer operational history. MAY allocation would represent a smaller portfolio component due to higher volatility characteristics.
-
Aggressive Investors: Risk-seeking profiles might consider increased MAY allocation to capture potential upside from early-stage positioning, while maintaining UNI exposure for portfolio stability. This approach acknowledges the substantial price correction MAY experienced from $0.07318 to current $0.01128 levels.
-
Hedging Tools: Portfolio risk management may incorporate stablecoin allocations for liquidity preservation, derivative instruments where available, and cross-asset diversification strategies to mitigate concentration risk.
V. Potential Risk Comparison
Market Risk
-
MAY: The asset demonstrates high volatility characteristics, having declined substantially from its July 2025 peak of $0.07318 to current levels around $0.01128. Limited liquidity with 24-hour trading volume of $20,653 may amplify price movements. Market cap ranking at #1936 indicates exposure to broader market sentiment shifts.
-
UNI: While showing more moderate price fluctuations compared to MAY, UNI experienced significant adjustment from its May 2021 high of $44.92 to current $3.992 levels. The asset's correlation with broader DeFi sector performance and Ethereum network dynamics represents ongoing market exposure.
Technical Risk
-
MAY: Technical development details were not available in the reference materials, limiting assessment of infrastructure maturity, security audit status, or potential technical vulnerabilities.
-
UNI: As an Ethereum-based protocol, UNI's technical framework relates to underlying network performance, smart contract security, and protocol governance mechanisms. The fee switch mechanism and token burn implementation represent structural elements requiring ongoing technical maintenance.
Regulatory Risk
- Regulatory frameworks for decentralized finance protocols continue evolving across jurisdictions, potentially affecting both assets differently based on their operational characteristics and market positioning. UNI's established presence and governance token classification may face different regulatory considerations compared to MAY's AI-powered assistant positioning. Compliance requirements, reporting obligations, and jurisdictional restrictions represent ongoing considerations for both projects.
VI. Conclusion: Which Is the Better Buy?
📌 Investment Value Summary:
-
MAY Characteristics: Represents early-stage positioning in AI-powered DeFi assistance with Solana infrastructure. The project's launch in 2025 and current market cap of $2.45 million indicate emerging project status with associated risk-return profile.
-
UNI Characteristics: Demonstrates established DeFi infrastructure positioning with operational history since 2020, substantial holder base (387,770), extensive exchange presence (65 listings), and systematic value capture through fee mechanisms and token burns.
✅ Investment Considerations:
-
Novice Investors: May consider prioritizing established projects with demonstrated operational history and higher liquidity to facilitate portfolio management and risk assessment learning.
-
Experienced Investors: Might evaluate portfolio allocation across both established infrastructure (UNI) and emerging innovations (MAY) based on individual risk tolerance, investment horizon, and portfolio diversification objectives.
-
Institutional Investors: May focus on liquidity depth, regulatory clarity, operational history, and infrastructure maturity when evaluating exposure to decentralized finance protocols.
⚠️ Risk Disclosure: Cryptocurrency markets exhibit substantial volatility. This analysis does not constitute investment advice. Investment decisions should incorporate individual financial circumstances, risk tolerance assessment, and independent research.
VII. FAQ
Q1: What are the main differences between MAY and UNI in terms of market maturity?
UNI represents an established DeFi infrastructure project launched in 2020 with 387,770 holders and 65 exchange listings, while MAY is an emerging project launched in July 2025 with significantly lower liquidity and market presence. UNI's market cap of $2.53 billion (ranked #39) contrasts sharply with MAY's $2.45 million market cap (ranked #1936), reflecting fundamentally different stages of project development. UNI has demonstrated operational longevity through multiple market cycles, including the 2021 bull market where it reached an all-time high of $44.92, whereas MAY's track record spans less than one year since launch.
Q2: How do the trading volumes of MAY and UNI compare, and why does this matter?
UNI demonstrates substantially higher liquidity with 24-hour trading volume of $3,604,670.85 compared to MAY's $20,653.09—approximately 175 times greater. This liquidity differential matters significantly for investors as higher trading volumes typically enable easier position entry and exit without substantial price impact, reduce bid-ask spreads, and indicate greater market participation. Lower liquidity assets like MAY may experience amplified price volatility during periods of buying or selling pressure, potentially complicating execution of larger trades and risk management strategies.
Q3: What technological differences exist between MAY and UNI?
UNI operates as an automated market maker protocol on Ethereum with established technical infrastructure including a fee switch mechanism that enables protocol-level value capture through systematic token burns. The protocol allocates fees between liquidity providers and protocol operations as a core structural element. MAY positions itself as an AI-powered assistant layer for DeFi operations built on Solana, converting natural language requests into real-time on-chain actions and integrating with protocols like Jupiter. The fundamental difference lies in UNI serving as decentralized exchange infrastructure versus MAY functioning as an AI interface layer for DeFi interaction.
Q4: How have MAY and UNI performed from their respective all-time highs?
MAY declined approximately 84.6% from its all-time high of $0.07318 (July 4, 2025) to current levels around $0.01128, representing substantial correction within a relatively short timeframe. UNI experienced an 91.1% decline from its all-time high of $44.92 (May 3, 2021) to current $3.992 levels, though this adjustment occurred over a longer period spanning multiple years. These substantial drawdowns from peak prices reflect different market cycle dynamics—MAY's rapid decline following launch versus UNI's extended adjustment through changing DeFi landscape and broader market conditions.
Q5: What risk profiles should investors consider when comparing MAY and UNI?
MAY presents higher risk characteristics including extreme volatility (84.6% decline from peak), limited liquidity ($20,653 daily volume), emerging project status with minimal operational history, and substantially smaller market capitalization. UNI demonstrates more moderate risk characteristics with established operational history since 2020, higher liquidity depth, broader exchange accessibility, and demonstrated ability to maintain market presence through multiple cycles. Conservative investors might prioritize UNI's established positioning, while risk-tolerant investors might consider MAY's early-stage potential alongside the associated elevated risk factors.
Q6: How do the price predictions for 2026-2031 differ between MAY and UNI?
Price projections suggest MAY could range from $0.0087-$0.0274 depending on scenario (2026-2031), representing potential upside from current $0.01128 levels but remaining well below its all-time high. UNI projections indicate potential range of $2.52-$8.23 (2026-2031), with optimistic scenarios approaching approximately double current prices. Both projections incorporate conservative and optimistic scenarios reflecting uncertainty in cryptocurrency markets. The substantial percentage potential returns for MAY reflect its smaller base price, while UNI's projections suggest more measured growth expectations consistent with established project characteristics.
Q7: What factors should determine allocation percentage between MAY and UNI?
Portfolio allocation should reflect individual risk tolerance, investment horizon, and diversification objectives. Conservative investors might consider minimal or zero MAY allocation given elevated risk factors, focusing primarily on established projects like UNI. Aggressive investors might allocate smaller percentages to MAY (potentially 5-15% of crypto portfolio) to capture early-stage positioning while maintaining larger UNI allocation (potentially 20-40%) for stability. Allocation decisions should also incorporate liquidity needs, as MAY's limited trading volume may complicate exit strategies, and total cryptocurrency exposure relative to overall investment portfolio.
Q8: How does the current market sentiment (Extreme Fear at 20) affect investment decisions for MAY and UNI?
The Fear & Greed Index reading of 20 (Extreme Fear) as of February 1, 2026, suggests widespread negative market sentiment, which historically has coincided with both opportunity and risk. Lower liquidity assets like MAY may experience amplified downside during fear-driven selling, potentially creating entry opportunities for risk-tolerant investors but also representing heightened volatility risk. UNI's higher liquidity may provide more stability during fearful market conditions, though established projects also experience sentiment-driven price adjustments. Extreme Fear conditions warrant particular caution regarding position sizing and risk management regardless of asset selection.
* The information is not intended to be and does not constitute financial advice or any other recommendation of any sort offered or endorsed by Gate.