This comprehensive analysis compares MET and ZIL, two distinct blockchain assets with different market positions and technological foundations. MET, a newly launched Solana-based decentralized exchange (October 2025), demonstrates higher trading volume and recent momentum, trading at $0.2983 with 15.35% 24-hour gains, while ZIL, an established layer-1 blockchain since 2018, operates at $0.005619 with proven multi-year track records. The article examines historical price trends, supply mechanisms, institutional adoption, technological ecosystems, and risk factors to determine investment suitability. Price forecasts project MET ranging from $0.2576-$0.3243 through 2026, while ZIL could reach $0.0072, with detailed recommendations for conservative, aggressive, and institutional investors based on risk tolerance and portfolio objectives. Critical considerations include MET's ecosystem dependency risks versus ZIL's sharding complexity, market volatility patterns, and regulatory uncertainties affecting both assets
Introduction: Investment Comparison Between MET and ZIL
In the cryptocurrency market, the comparison between MET vs ZIL has consistently been a topic of interest for investors. Both assets exhibit notable differences in market capitalization ranking, application scenarios, and price performance, representing distinct positioning within the crypto asset landscape.
Meteora (MET): Launched in 2025, this decentralized exchange has gained market recognition by focusing on delivering secure, sustainable, and composable liquidity infrastructure for the Solana ecosystem and the broader DeFi space.
Zilliqa (ZIL): Since its inception in 2018, Zilliqa has been recognized as a high-throughput public blockchain platform, extending performance to thousands of transactions per second through innovative sharding technology.
This article will provide a comprehensive analysis of MET vs ZIL investment value comparison, examining historical price trends, supply mechanisms, technological ecosystems, and future outlook, attempting to address the question that concerns investors most:
"Which is the better buy right now?"
I. Historical Price Comparison and Current Market Situation
MET (Meteora) and ZIL (Zilliqa) Historical Price Trends
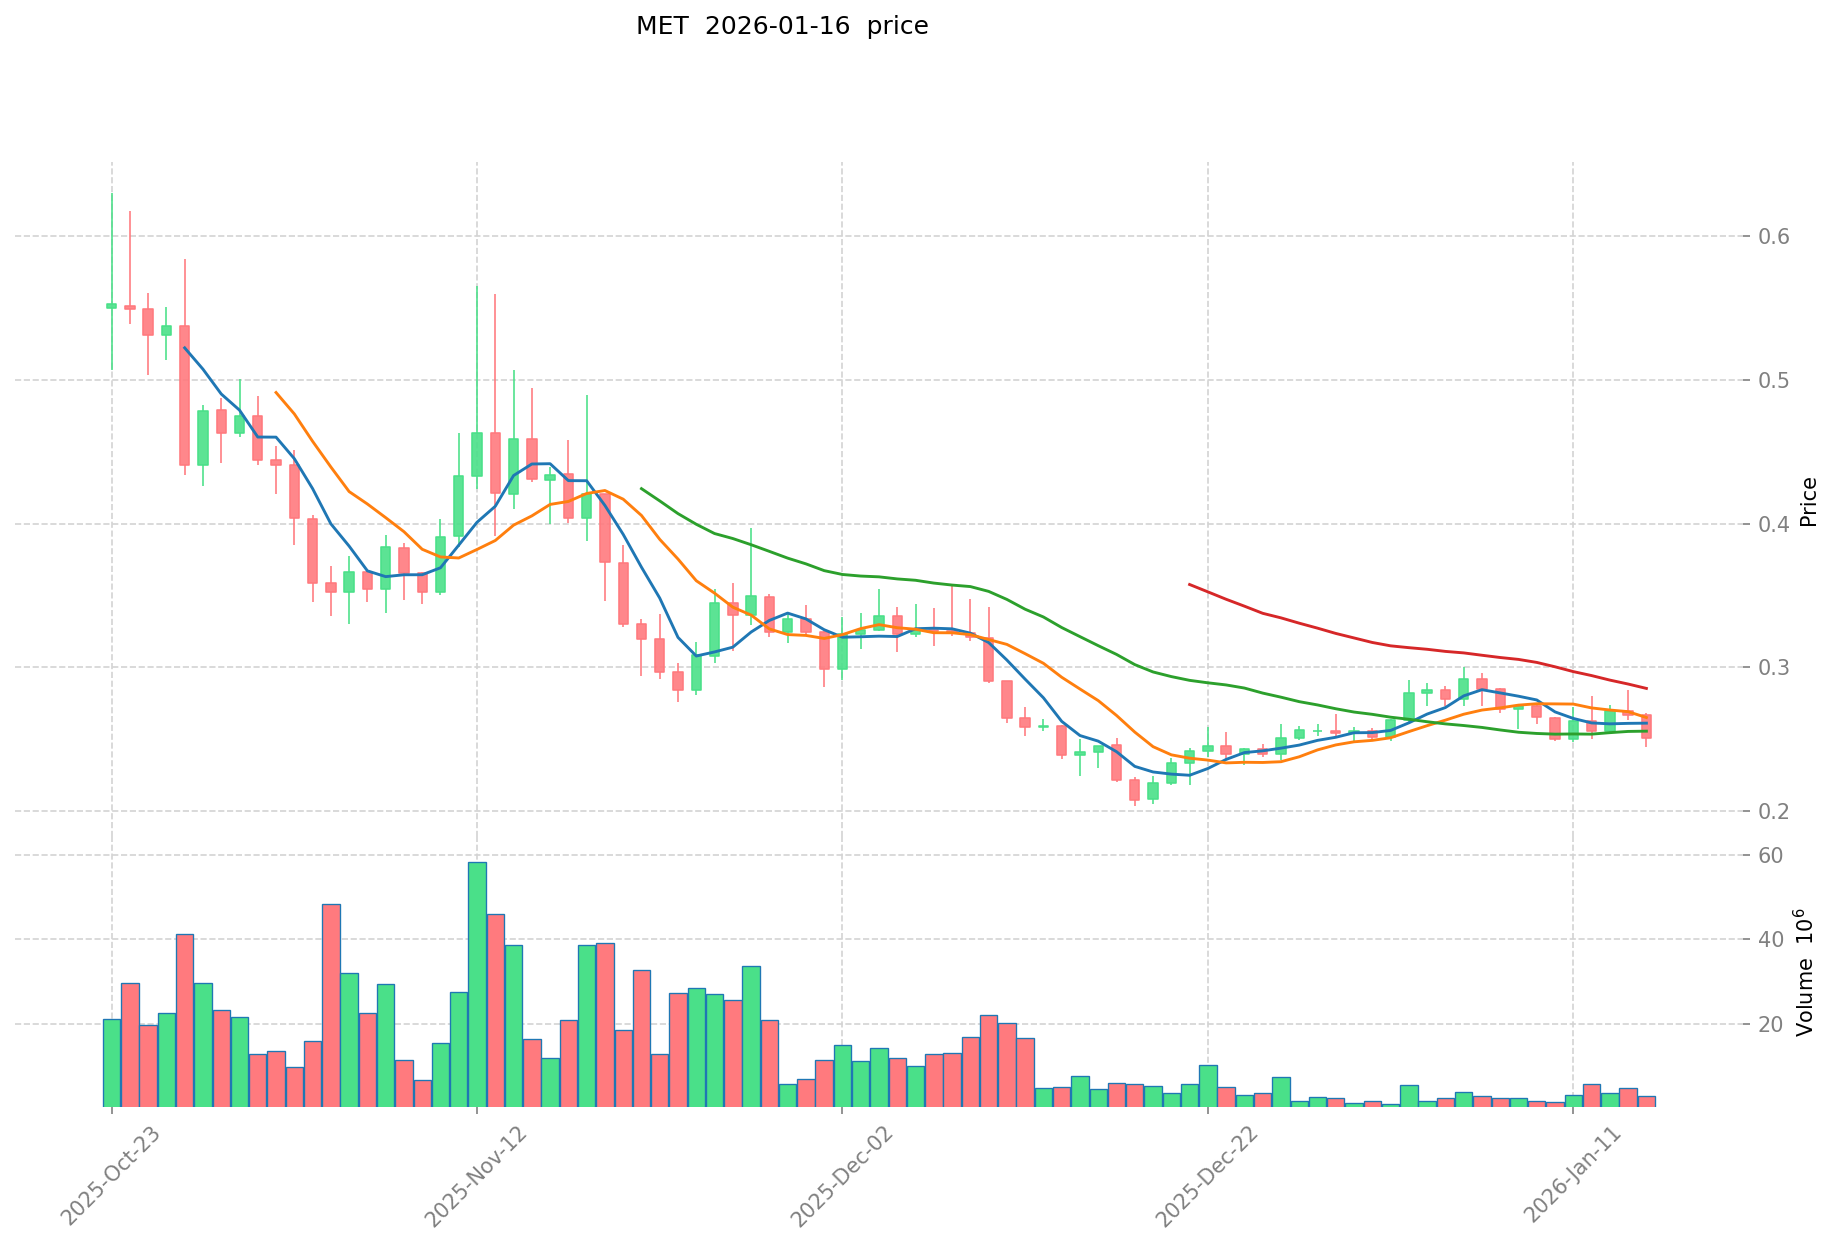
- 2025: MET experienced price volatility following its launch in October 2025, reaching an all-time high of $0.6304 on October 23, 2025.
- 2021: ZIL reached its all-time high of $0.255376 on May 7, 2021, during a broader market uptrend in the crypto sector.
- 2020: ZIL recorded its all-time low of $0.00239616 on March 13, 2020, during a period of market-wide correction.
- 2025: MET hit its all-time low of $0.2034 on December 18, 2025, reflecting post-launch price discovery and market adjustment.
- Comparative Analysis: During recent market cycles, MET declined from its peak of $0.6304 to $0.2034, representing significant volatility in its early trading period. Meanwhile, ZIL has shown more established price patterns, trading between its 2020 low and 2021 high over a multi-year period.
Current Market Situation (January 16, 2026)
- MET current price: $0.2983
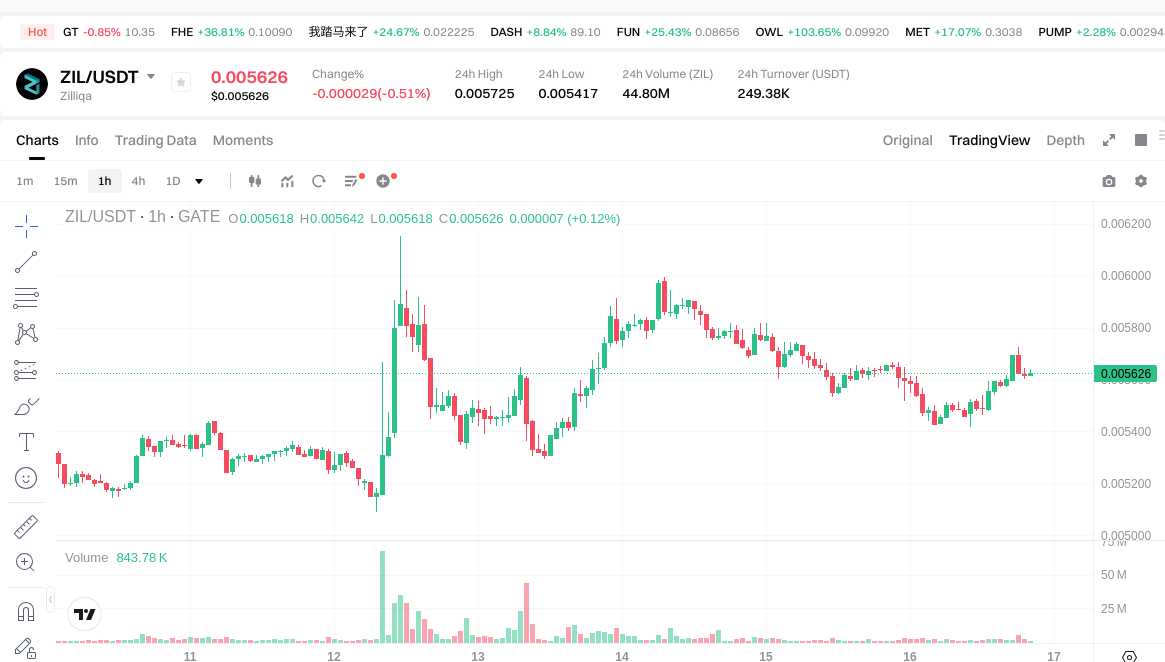
- ZIL current price: $0.005619
- 24-hour trading volume: MET recorded $2,623,592.78 vs ZIL at $245,614.37
- Market sentiment index (Fear & Greed Index): 49 (Neutral)
- MET 24-hour price change: +15.35%
- ZIL 24-hour price change: -0.31%
- MET market capitalization: $142,509,173.21
- ZIL market capitalization: $110,415,254.65
View real-time prices:
II. Core Factors Influencing MET vs ZIL Investment Value
Supply Mechanism Comparison (Tokenomics)
- MET: The c-MET target displays mutations primarily consisting of METex14 mutations and MET gene amplification, with distinct pharmacological characteristics for each mutation type.
- ZIL: Information regarding ZIL's supply mechanism was not found in the available materials.
- 📌 Historical Pattern: Supply mechanisms play a role in driving price cycle variations through structural changes in token availability.
Institutional Adoption and Market Application
- Institutional Holdings: Investment evaluation typically relies on preclinical and clinical data for MET-targeted therapeutics.
- Enterprise Adoption: MET therapeutics demonstrate applications in targeted cancer treatment, particularly for non-small cell lung cancer with MET exon 14 skipping mutations. Savolitinib (ORPATHYS®) generated market sales of $45.5 million in 2024.
- National Policies: Pharmaceutical products face regulatory frameworks, including FDA approval processes for clinical trials, as evidenced by the IND approval for elzovantinib combined with aumolertinib.
Technology Development and Ecosystem Building
- MET Technology Advancement: Recent developments include fatty acid terminal modification technology, which has become a prominent direction for ultra-long-acting drug development following Pfizer's acquisition of Metsera.
- ZIL Technology Development: Specific technical development information was not available in the reference materials.
- Ecosystem Comparison: MET-targeted therapies participate in the broader pharmaceutical ecosystem, with clinical applications in oncology and ongoing research collaborations between pharmaceutical companies.
Macroeconomic Environment and Market Cycles
- Performance in Inflationary Environments: Investment value assessment incorporates analysis of securities and related products, including valuation methods and market trend analysis.
- Macroeconomic Monetary Policy: Tax policies, corporate income tax rates, and investment incentives influence the pharmaceutical sector, with France offering research and development tax credits up to 30% of annual R&D expenditure.
- Geopolitical Factors: International investment frameworks and cross-border collaboration in pharmaceutical research impact market dynamics, as demonstrated by partnerships between Chinese and international pharmaceutical companies.
III. 2026-2031 Price Forecast: MET vs ZIL
Short-term Forecast (2026)
- MET: Conservative $0.2576 - $0.3031 | Optimistic $0.3031 - $0.3243
- ZIL: Conservative $0.0029 - $0.0056 | Optimistic $0.0056 - $0.0072
Mid-term Forecast (2028-2029)
- MET may enter a consolidation phase with projected price range of $0.1928 - $0.5218
- ZIL may enter a gradual growth phase with projected price range of $0.0062 - $0.0125
- Key drivers: institutional capital inflows, ETF developments, ecosystem expansion
Long-term Forecast (2030-2031)
- MET: Baseline scenario $0.3705 - $0.4631 | Optimistic scenario $0.5442 - $0.6965
- ZIL: Baseline scenario $0.0061 - $0.0106 | Optimistic scenario $0.0115 - $0.0161
View detailed price predictions for MET and ZIL
Disclaimer
MET:
| Year |
Predicted High Price |
Predicted Average Price |
Predicted Low Price |
Price Change |
| 2026 |
0.324317 |
0.3031 |
0.257635 |
1 |
| 2027 |
0.442328985 |
0.3137085 |
0.285474735 |
5 |
| 2028 |
0.43094136645 |
0.3780187425 |
0.192789558675 |
26 |
| 2029 |
0.52177927027275 |
0.404480054475 |
0.32358404358 |
35 |
| 2030 |
0.625225044204731 |
0.463129662373875 |
0.3705037298991 |
55 |
| 2031 |
0.696547012210307 |
0.544177353289303 |
0.34283173257226 |
82 |
ZIL:
| Year |
Predicted High Price |
Predicted Average Price |
Predicted Low Price |
Price Change |
| 2026 |
0.00721536 |
0.005637 |
0.00293124 |
0 |
| 2027 |
0.0091251756 |
0.00642618 |
0.0058478238 |
14 |
| 2028 |
0.009408570138 |
0.0077756778 |
0.006842596464 |
38 |
| 2029 |
0.01254450099474 |
0.008592123969 |
0.00618632925768 |
52 |
| 2030 |
0.012364925603787 |
0.01056831248187 |
0.009511481233683 |
87 |
| 2031 |
0.01605326665996 |
0.011466619042829 |
0.006077308092699 |
103 |
IV. Investment Strategy Comparison: MET vs ZIL
Long-term vs Short-term Investment Strategies
-
MET: Suitable for investors seeking early-stage DeFi infrastructure exposure with tolerance for volatility. The token launched in October 2025, positioning it as a newer entrant focused on Solana ecosystem liquidity solutions. Short-term traders may capitalize on price volatility evidenced by the 15.35% 24-hour gain, while long-term holders might benefit from ecosystem expansion as the platform matures.
-
ZIL: Suitable for investors preferring established blockchain platforms with multi-year track records. Since its 2018 inception, ZIL has demonstrated operational continuity through various market cycles. The platform's sharding technology foundation appeals to those evaluating mature infrastructure plays with relatively lower short-term volatility compared to newer tokens.
Risk Management and Asset Allocation
-
Conservative Investors: MET 20-30% vs ZIL 70-80%. This allocation reflects ZIL's longer operational history and more established price patterns, while maintaining limited exposure to MET's potential upside.
-
Aggressive Investors: MET 60-70% vs ZIL 30-40%. Higher MET allocation captures potential growth in Solana DeFi infrastructure, while ZIL provides diversification across different blockchain architectures.
-
Hedging Tools: Stablecoin allocation (USDT, USDC) for liquidity management, options contracts where available for downside protection, cross-asset portfolio construction incorporating assets beyond MET and ZIL to reduce concentration risk.
V. Potential Risk Comparison
Market Risk
-
MET: Exhibits pronounced volatility characteristic of recently launched tokens, declining from $0.6304 to $0.2034 within approximately two months post-launch. The $142.51 million market capitalization indicates smaller market depth, potentially amplifying price movements during periods of concentrated buying or selling pressure. Trading volume of $2.62 million over 24 hours suggests moderate liquidity conditions.
-
ZIL: Demonstrates multi-year price range between $0.002396 (2020 low) and $0.255376 (2021 high), indicating significant historical volatility across market cycles. Current market capitalization of $110.42 million with 24-hour trading volume of $245,614 suggests lower immediate liquidity compared to MET, which may impact execution for larger position sizes.
Technical Risk
-
MET: As infrastructure focused on Solana ecosystem liquidity, technical risks include dependency on Solana network performance and stability. Network congestion or technical issues affecting Solana could impact MET protocol functionality and user adoption. The relatively recent launch means the protocol has limited operational history for assessing long-term technical resilience.
-
ZIL: Technical considerations center on sharding implementation and network coordination across shards. While the technology enables throughput scaling, complexity in shard management presents ongoing technical challenges. Network stability depends on continued development and maintenance of sharding infrastructure.
Regulatory Risk
-
Global regulatory frameworks continue evolving regarding DeFi protocols and blockchain platforms. MET's positioning as decentralized exchange infrastructure may face scrutiny under securities regulations in various jurisdictions, particularly regarding liquidity provision mechanisms and protocol governance.
-
ZIL's classification as a layer-1 blockchain platform subjects it to regulatory considerations surrounding network operation, validator participation, and potential classification frameworks for blockchain networks in different regulatory environments.
VI. Conclusion: Which Is the Better Buy?
📌 Investment Value Summary:
-
MET Advantages: Recent 24-hour performance showing 15.35% gain indicates near-term momentum. Focus on Solana ecosystem liquidity infrastructure positions the protocol within a growing DeFi segment. Market capitalization of $142.51 million suggests potential for growth as ecosystem adoption expands. Higher 24-hour trading volume relative to market cap indicates active market participation.
-
ZIL Advantages: Operational track record extending to 2018 provides historical performance data across multiple market cycles. Sharding technology foundation offers differentiated technical approach to scalability challenges. Multi-year price history enables more extensive technical and fundamental analysis compared to recently launched tokens.
✅ Investment Recommendations:
-
Novice Investors: Consider initial positions sized appropriately to risk tolerance, with emphasis on understanding both projects' fundamental value propositions before allocation. Educational focus on DeFi mechanics (for MET) and blockchain scalability approaches (for ZIL) supports informed decision-making. Dollar-cost averaging may help manage entry timing uncertainty.
-
Experienced Investors: Evaluate allocation based on portfolio construction objectives and existing exposures. MET may complement Solana ecosystem positions or DeFi infrastructure thesis, while ZIL offers layer-1 blockchain diversification. Consider correlation with broader portfolio holdings and rebalancing thresholds aligned with volatility expectations.
-
Institutional Investors: Assess liquidity profile against position size requirements, noting current trading volumes and market depth. Conduct comprehensive due diligence on protocol security audits (MET) and network validator distribution (ZIL). Evaluate regulatory considerations within applicable jurisdictions and compliance frameworks. Consider custody solutions appropriate for each asset type.
⚠️ Risk Warning: Cryptocurrency markets demonstrate pronounced volatility. This analysis does not constitute investment advice. Conduct independent research and consult qualified financial advisors before making investment decisions.
VII. FAQ
Q1: What are the primary differences between MET and ZIL in terms of blockchain infrastructure?
MET focuses on decentralized exchange liquidity infrastructure within the Solana ecosystem, while ZIL operates as an independent layer-1 blockchain platform utilizing sharding technology for scalability. MET launched in October 2025 as a DeFi protocol providing composable liquidity solutions specifically designed for Solana-based applications. In contrast, ZIL has operated since 2018 as a standalone blockchain network capable of processing thousands of transactions per second through its proprietary sharding implementation. The fundamental distinction lies in MET serving as an application layer protocol dependent on Solana's base infrastructure, whereas ZIL functions as a complete blockchain platform with its own consensus mechanism and validator network.
Q2: How does the market capitalization difference between MET and ZIL impact investment considerations?
MET currently holds a market capitalization of $142.51 million compared to ZIL's $110.42 million, though this difference primarily reflects distinct tokenomics and market positioning rather than direct comparative advantage. MET's slightly larger market cap coupled with significantly higher 24-hour trading volume ($2.62 million versus $245,614) suggests greater near-term liquidity and market activity. However, market capitalization alone does not determine investment merit—investors should evaluate this metric alongside trading volume patterns, price volatility characteristics, and protocol adoption metrics. Smaller market capitalizations in both cases indicate potential for price appreciation but also increased susceptibility to market manipulation and volatility compared to larger-cap crypto assets.
Q3: What factors should determine allocation percentages between MET and ZIL?
Allocation decisions should reflect individual risk tolerance, investment timeframe, and portfolio diversification objectives rather than following standardized percentages. Conservative investors typically favor higher ZIL allocation (70-80%) given its longer operational history and more established price patterns, with limited MET exposure (20-30%) for potential upside participation. Aggressive investors may reverse this allocation (60-70% MET, 30-40% ZIL) to capitalize on MET's early-stage growth potential within the expanding Solana DeFi ecosystem. Critical factors influencing allocation include existing portfolio exposure to Solana ecosystem assets, preference for DeFi versus layer-1 blockchain investments, liquidity requirements based on position size, and correlation with other holdings. Portfolio rebalancing thresholds should account for each asset's volatility characteristics.
Q4: How reliable are the 2026-2031 price forecasts for MET and ZIL?
Price forecasts represent statistical projections based on historical data and market modeling rather than guaranteed future outcomes, and cryptocurrency markets frequently deviate from projected ranges due to unpredictable factors. The MET forecast projects 2026 conservative ranges of $0.2576-$0.3031 with optimistic scenarios reaching $0.3243, while ZIL forecasts range from $0.0029-$0.0056 conservatively to $0.0072 optimistically. These projections incorporate historical volatility patterns, market cycle analysis, and ecosystem development trajectories but cannot account for regulatory changes, technological disruptions, macroeconomic shifts, or competitive dynamics. Investors should treat forecasts as reference points for scenario planning rather than precise targets, maintaining awareness that actual prices may fall outside projected ranges in either direction.
Q5: What specific risks differentiate MET from ZIL for potential investors?
MET faces concentrated ecosystem risk through Solana network dependency, meaning technical issues or performance degradation affecting Solana directly impact MET protocol functionality and user adoption. The protocol's recent October 2025 launch provides limited operational history for assessing long-term resilience, smart contract security, and market acceptance. ZIL's primary technical risk centers on sharding complexity—maintaining network coordination across multiple shards requires continuous development and presents potential attack vectors specific to sharded architectures. Additionally, ZIL's lower current trading volume ($245,614 versus MET's $2.62 million) may create execution challenges for larger position sizes. Both assets face evolving regulatory frameworks, though MET's DeFi protocol classification and ZIL's layer-1 platform status subject them to potentially different regulatory treatments across jurisdictions.
Q6: How do recent price movements inform short-term trading versus long-term holding strategies?
MET's 15.35% gain over 24 hours demonstrates near-term momentum suitable for short-term traders monitoring technical indicators and volume patterns, though such volatility also indicates elevated risk. The token's decline from $0.6304 to $0.2034 following launch suggests price discovery continues, creating opportunities for traders but uncertainty for long-term holders. ZIL's -0.31% 24-hour change reflects more stable near-term behavior characteristic of established projects, potentially favoring holders focused on multi-year appreciation rather than short-term gains. Long-term strategies for both assets should prioritize fundamental developments—protocol adoption metrics, ecosystem expansion, and technological advancement—over short-term price fluctuations. Investors combining both approaches might allocate separate position portions for trading versus holding, applying different exit strategies and timeframes to each component.
Q7: What role should stablecoin allocation play in a portfolio containing MET and ZIL?
Stablecoin reserves (USDT, USDC) serve multiple strategic functions within crypto portfolios, including liquidity management for opportunistic rebalancing, downside protection during market corrections, and dry powder for accumulation during price dips. Conservative investors might maintain 30-40% stablecoin allocation alongside MET and ZIL positions, enabling portfolio adjustments without forced selling during volatility. Aggressive investors may reduce stablecoin percentages to 10-20% to maximize exposure to potential appreciation, accepting reduced flexibility. Stablecoins also facilitate risk management by providing immediate liquidity for exit execution without converting to fiat currency, which may involve additional time delays and transaction costs. During periods of elevated market volatility or uncertainty, temporarily increasing stablecoin allocation protects capital while maintaining positioning for rapid redeployment when favorable entry points emerge.
Q8: How should institutional investors approach due diligence differently than individual investors for MET versus ZIL?
Institutional investors require comprehensive operational due diligence beyond price analysis, including formal security audits, smart contract verification (for MET), network validator distribution assessment (for ZIL), and custody solution compatibility. Position sizing must account for liquidity constraints—MET's $2.62 million daily volume and ZIL's $245,614 volume may limit institutional position sizes without significant market impact. Regulatory compliance frameworks necessitate legal analysis of each asset's classification status across relevant jurisdictions, particularly regarding securities law applicability and reporting requirements. Institutional governance procedures typically mandate documented investment theses, risk parameter definition, and approval workflows absent from individual investment processes. Additionally, institutions should evaluate counterparty risk in custody arrangements, insurance availability for digital assets, and operational procedures for corporate actions such as protocol upgrades or token migrations that may affect holdings.
* The information is not intended to be and does not constitute financial advice or any other recommendation of any sort offered or endorsed by Gate.