This comprehensive analysis compares NAORIS and SOL, two distinct blockchain assets operating at different market maturity levels. NAORIS, a newly launched post-quantum infrastructure protocol, trades at $0.02656 with 82.68% year-over-year decline and lower liquidity ($525k daily volume), while SOL, an established high-performance blockchain since 2020, maintains $127.87 price with higher stability and $94.2M daily trading volume. The article examines historical price trends, investment value factors, and 2026-2031 price forecasts showing SOL maintaining higher absolute levels ($238-$276 by 2031) versus NAORIS ($0.05-$0.07 by 2031). Risk assessment indicates NAORIS presents higher volatility and developmental uncertainties, while SOL offers established ecosystem adoption and institutional recognition. Investment recommendations vary by investor type: conservative investors favor SOL's stability (15-25% allocation), while experienced investors may diversify across both assets. Both assets currently face extrem
Introduction: NAORIS vs SOL Investment Comparison
In the cryptocurrency market, the comparison between NAORIS and SOL has become a topic of interest for investors. The two differ significantly in market cap ranking, application scenarios, and price performance, representing distinct positioning within the crypto asset landscape.
NAORIS Protocol (NAORIS): Launched in 2025, this project positions itself as a decentralized post-quantum infrastructure operating at the Sub-Zero Layer, focusing on trust and security architecture for Web3 and modern internet applications.
Solana (SOL): Established in 2020, Solana has been recognized as a high-performance blockchain protocol designed to provide scalability without compromising decentralization or security, becoming one of the widely traded cryptocurrencies.
This article examines the investment value comparison between NAORIS and SOL through historical price trends, supply mechanisms, institutional adoption, technical ecosystem, and future outlook, aiming to address investors' key question:
"Which represents a more suitable investment consideration at this time?"
I. Historical Price Comparison and Current Market Status
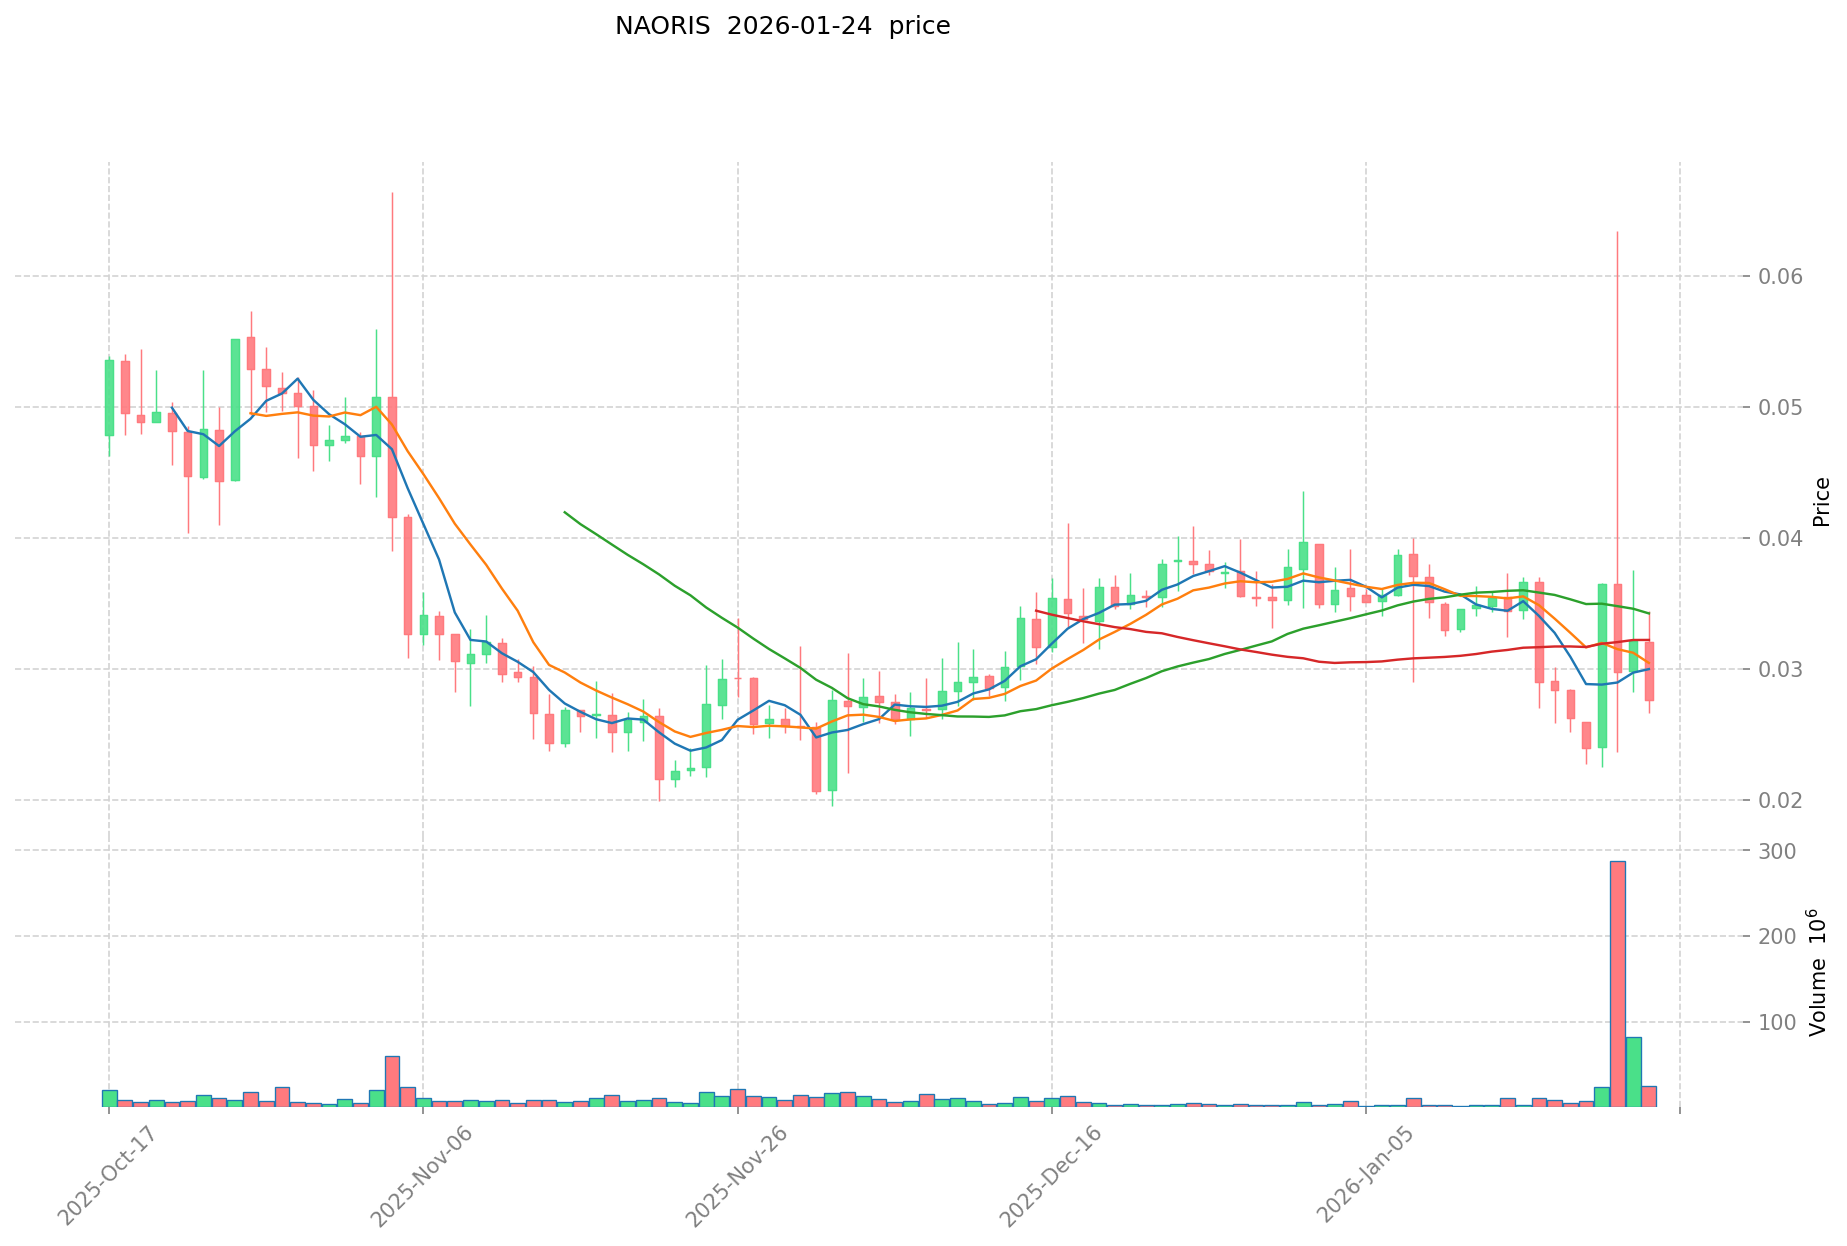
NAORIS (Coin A) and SOL (Coin B) Historical Price Trends
- 2025: NAORIS reached its all-time high on July 31, 2025 at $0.2238, followed by a significant decline to its all-time low of $0.00613 on October 10, 2025.
- 2020-2025: SOL experienced substantial growth from its all-time low of $0.500801 on May 12, 2020 to its peak of $293.31 on January 19, 2025.
- Comparative Analysis: During the recent market cycle, NAORIS declined from $0.2238 to its current level, showing a year-over-year decrease of 82.68%, while SOL declined from $293.31 to its current price level, reflecting a year-over-year decrease of 49.41%.
Current Market Status (January 24, 2026)
- NAORIS current price: $0.02656
- SOL current price: $127.87
- 24-hour trading volume: NAORIS $525,411.79 vs SOL $94,232,457.22
- Market Sentiment Index (Fear & Greed Index): 25 (Extreme Fear)
View real-time prices:
II. Core Factors Affecting NAORIS vs SOL Investment Value
Supply Mechanism Comparison (Tokenomics)
Due to insufficient reference materials regarding the supply mechanisms of NAORIS and SOL, this section cannot provide detailed analysis at this time.
Institutional Adoption and Market Applications
Without available data on institutional holdings, enterprise adoption, or national regulatory policies concerning NAORIS and SOL in the reference materials, a comparative analysis cannot be conducted in this section.
Technical Development and Ecosystem Building
The reference materials do not contain sufficient information regarding technical upgrades, ecosystem development, or application scenarios for NAORIS and SOL. Therefore, detailed comparisons in DeFi, NFT, payment systems, and smart contract implementations cannot be provided.
Macroeconomic Factors and Market Cycles
Given the absence of data in the reference materials concerning the performance of NAORIS and SOL under inflationary conditions, their response to monetary policy changes, or their relationship with geopolitical factors, this section cannot deliver substantive analysis.
III. 2026-2031 Price Prediction: NAORIS vs SOL
Short-term Forecast (2026)
- NAORIS: Conservative $0.0147-$0.0263 | Optimistic $0.0263-$0.0371
- SOL: Conservative $122.92-$128.04 | Optimistic $128.04-$151.09
Mid-term Forecast (2028-2029)
- NAORIS may enter a consolidation phase, with projected price range of $0.021-$0.059
- SOL may enter an expansion phase, with projected price range of $123.49-$239.89
- Key drivers: institutional capital inflows, ETF developments, ecosystem expansion
Long-term Forecast (2030-2031)
- NAORIS: Baseline scenario $0.025-$0.050 | Optimistic scenario $0.050-$0.068
- SOL: Baseline scenario $170.38-$238.53 | Optimistic scenario $238.53-$276.62
View detailed price predictions for NAORIS and SOL
Disclaimer
NAORIS:
| Year |
Predicted High Price |
Predicted Average Price |
Predicted Low Price |
Price Change |
| 2026 |
0.0370548 |
0.02628 |
0.0147168 |
-1 |
| 2027 |
0.043384338 |
0.0316674 |
0.018367092 |
19 |
| 2028 |
0.04315474935 |
0.037525869 |
0.02101448664 |
41 |
| 2029 |
0.0588968513955 |
0.040340309175 |
0.02622120096375 |
51 |
| 2030 |
0.051107137693807 |
0.04961858028525 |
0.025305475945477 |
86 |
| 2031 |
0.067989859635863 |
0.050362858989528 |
0.03626125847246 |
89 |
SOL:
| Year |
Predicted High Price |
Predicted Average Price |
Predicted Low Price |
Price Change |
| 2026 |
151.0872 |
128.04 |
122.9184 |
0 |
| 2027 |
173.058864 |
139.5636 |
124.211604 |
9 |
| 2028 |
165.68990592 |
156.311232 |
123.48587328 |
22 |
| 2029 |
239.8908477504 |
161.00056896 |
122.3604324096 |
25 |
| 2030 |
276.615077530176 |
200.4457083552 |
170.37885210192 |
56 |
| 2031 |
250.4569125898224 |
238.530392942688 |
219.44796150727296 |
86 |
IV. Investment Strategy Comparison: NAORIS vs SOL
Long-term vs Short-term Investment Strategies
- NAORIS: May be considered by investors interested in emerging post-quantum infrastructure projects with higher risk tolerance, given its relatively early stage and lower market capitalization
- SOL: May be considered by investors seeking exposure to established blockchain platforms with demonstrated ecosystem development and broader market adoption
Risk Management and Asset Allocation
- Conservative Investors: NAORIS 5-10% vs SOL 15-25%
- Aggressive Investors: NAORIS 15-25% vs SOL 30-40%
- Hedging Tools: Stablecoin allocation, options strategies, cross-asset portfolio diversification
V. Potential Risk Comparison
Market Risk
- NAORIS: Higher volatility evidenced by an 82.68% year-over-year decline, limited liquidity with 24-hour trading volume of $525,411.79, and sensitivity to broader market sentiment shifts
- SOL: Moderate volatility with a 49.41% year-over-year decline, higher liquidity with 24-hour trading volume of $94,232,457.22, and correlation with broader cryptocurrency market movements
Technical Risk
- NAORIS: Early-stage infrastructure development, network stability considerations as the protocol matures
- SOL: Network performance considerations, ecosystem scalability factors
Regulatory Risk
- Global regulatory developments may impact both assets differently based on their respective use cases, market positioning, and jurisdictional considerations
VI. Conclusion: Which Is the Better Buy?
📌 Investment Value Summary:
- NAORIS Advantages: Early-stage positioning in post-quantum infrastructure space, potential for growth from current lower price levels
- SOL Advantages: Established market presence, higher liquidity, demonstrated ecosystem development, broader institutional recognition
✅ Investment Recommendations:
- Beginner Investors: Consider focusing on more established assets with higher liquidity and market stability; if interested in NAORIS, limit exposure to a small portion of portfolio
- Experienced Investors: May consider diversified allocation across both assets based on risk tolerance, with SOL representing a more liquid position and NAORIS representing higher-risk, early-stage exposure
- Institutional Investors: Evaluate both assets within broader portfolio context, considering liquidity requirements, risk management frameworks, and strategic asset allocation objectives
⚠️ Risk Disclosure: The cryptocurrency market exhibits high volatility. This content does not constitute investment advice. Investors should conduct independent research and consider their own financial circumstances before making investment decisions.
VII. FAQ
Q1: What are the main differences between NAORIS and SOL in terms of market maturity?
NAORIS is an early-stage project launched in 2025 focusing on post-quantum infrastructure, while SOL is an established blockchain platform since 2020 with proven ecosystem adoption. NAORIS currently has a 24-hour trading volume of $525,411.79 and has experienced an 82.68% year-over-year decline from its all-time high of $0.2238. In contrast, SOL maintains significantly higher liquidity with a 24-hour trading volume of $94,232,457.22 and has broader institutional recognition, despite experiencing a 49.41% decline from its peak of $293.31 in January 2025.
Q2: How do the price predictions for 2026-2031 compare between NAORIS and SOL?
SOL demonstrates substantially higher projected price ranges across all timeframes compared to NAORIS. For 2026, NAORIS conservative estimates range from $0.0147-$0.0263, while SOL's range is $122.92-$128.04. By 2031, NAORIS optimistic scenarios project $0.050-$0.068, whereas SOL's optimistic range reaches $238.53-$276.62. The data indicates that while both assets show potential growth trajectories, SOL maintains significantly higher absolute price levels throughout the forecast period, though NAORIS shows percentage growth potential of 89% by 2031 compared to SOL's 86%.
Q3: Which asset presents higher risk for investors?
NAORIS presents higher risk characteristics due to several factors. The asset exhibits greater volatility with an 82.68% year-over-year decline compared to SOL's 49.41% decline. Additionally, NAORIS has significantly lower liquidity, with 24-hour trading volume approximately 179 times smaller than SOL's. As an early-stage infrastructure project, NAORIS also faces developmental uncertainties and network stability considerations. SOL, while subject to moderate volatility and ecosystem scalability factors, benefits from established market presence and broader adoption, making it relatively lower risk within the cryptocurrency asset class.
Q4: What allocation strategies are recommended for different investor types?
Conservative investors may consider allocating 5-10% to NAORIS and 15-25% to SOL within their cryptocurrency portfolio, while aggressive investors might increase exposure to 15-25% for NAORIS and 30-40% for SOL. Beginner investors are advised to focus on more established assets like SOL with higher liquidity and market stability, limiting NAORIS exposure to a small portion if interested. Institutional investors should evaluate both assets within their broader portfolio context, considering liquidity requirements and risk management frameworks, with SOL representing a more liquid position and NAORIS representing higher-risk, early-stage exposure.
Q5: What is the current market sentiment affecting both NAORIS and SOL?
As of January 24, 2026, the cryptocurrency market shows a Fear & Greed Index of 25, indicating "Extreme Fear" sentiment. This bearish sentiment affects both assets but with different impacts. NAORIS, trading at $0.02656, represents an 88.13% decline from its all-time high, while SOL at $127.87 shows a 56.40% decline from its peak. The extreme fear sentiment typically indicates market-wide caution and risk aversion, which disproportionately affects smaller-cap, early-stage projects like NAORIS compared to established platforms like SOL that maintain higher liquidity and institutional support.
Q6: How do regulatory risks differ between NAORIS and SOL?
Both NAORIS and SOL face regulatory considerations, but their exposure varies based on positioning and use cases. NAORIS, as a post-quantum infrastructure protocol operating at the Sub-Zero Layer, may encounter specific regulatory scrutiny related to security and cryptographic standards as regulations evolve. SOL, with its broader ecosystem adoption and established presence in DeFi and NFT sectors, faces regulatory considerations across multiple jurisdictions and use cases. Global regulatory developments may impact both assets differently depending on their respective market positioning, jurisdictional presence, and the evolving framework around blockchain infrastructure versus application-layer protocols.
Q7: What are the key technical considerations when comparing NAORIS and SOL?
NAORIS focuses on decentralized post-quantum infrastructure for Web3 and modern internet applications, positioning itself at the Sub-Zero Layer with emphasis on trust and security architecture. As an early-stage protocol, it faces developmental considerations regarding network stability and infrastructure maturation. SOL operates as a high-performance blockchain protocol designed for scalability without compromising decentralization or security, with an established ecosystem. Technical considerations for SOL include network performance optimization and ecosystem scalability. The fundamental difference lies in NAORIS's infrastructure-layer positioning versus SOL's platform-layer approach, representing distinct technical architectures and development stages.
Q8: What factors should investors monitor when tracking NAORIS and SOL performance?
Investors should monitor several key metrics for both assets. For NAORIS, focus on infrastructure development milestones, network adoption indicators, partnership announcements in the post-quantum security space, and trading volume trends given its current limited liquidity. For SOL, track ecosystem expansion metrics, institutional adoption patterns, network performance statistics, DeFi and NFT activity levels, and any ETF-related developments. Common factors for both include macroeconomic conditions affecting cryptocurrency markets, regulatory announcements, technological upgrades, and overall market sentiment indicators such as the Fear & Greed Index. Given the current extreme fear sentiment at 25, monitoring sentiment shifts becomes particularly relevant.
* The information is not intended to be and does not constitute financial advice or any other recommendation of any sort offered or endorsed by Gate.