This article offers a detailed comparison between two dominant blockchain data solutions, PlayDapp (PLA) and Quant (QNT). It evaluates their historical price trends, market status, investment values, and future predictions for 2025-2030. Key analysis includes the assets' market positioning, technology ecosystems, and macroeconomic impacts on investment potential. Ideal for investors seeking insights on risk management between PLA’s focus on blockchain gaming and QNT’s enterprise interoperability. Explore offerings from each token to identify which aligns with your investment strategy and risk tolerance on Gate.
Introduction: PLA vs QNT Investment Comparison
In the cryptocurrency market, the comparison between PlayDapp (PLA) and Quant (QNT) is an increasingly relevant topic for investors. The two assets not only exhibit significant differences in market capitalization rankings, application scenarios, and price performance, but also represent distinct positioning within the crypto asset ecosystem.
PlayDapp (PLA): Launched in 2020, it has gained market recognition by focusing on blockchain gaming infrastructure and interoperable NFT ecosystems, enabling cross-game asset utilization and in-game transactions.
Quant (QNT): Since its launch in 2018, it has been recognized as a leading enterprise-grade blockchain interoperability solution provider, with Overledger positioned as a global blockchain operating system designed for institutional adoption and trusted digital interaction.
This article will conduct a comprehensive analysis of PLA vs QNT investment value comparison across historical price trends, supply mechanisms, market positioning, technological ecosystems, and future outlook, while attempting to address the question that concerns investors most:
"Which asset offers better investment potential for different risk profiles?"
I. Price History Comparison and Market Status
PlayDapp (PLA) and Quant (QNT) Historical Price Trends
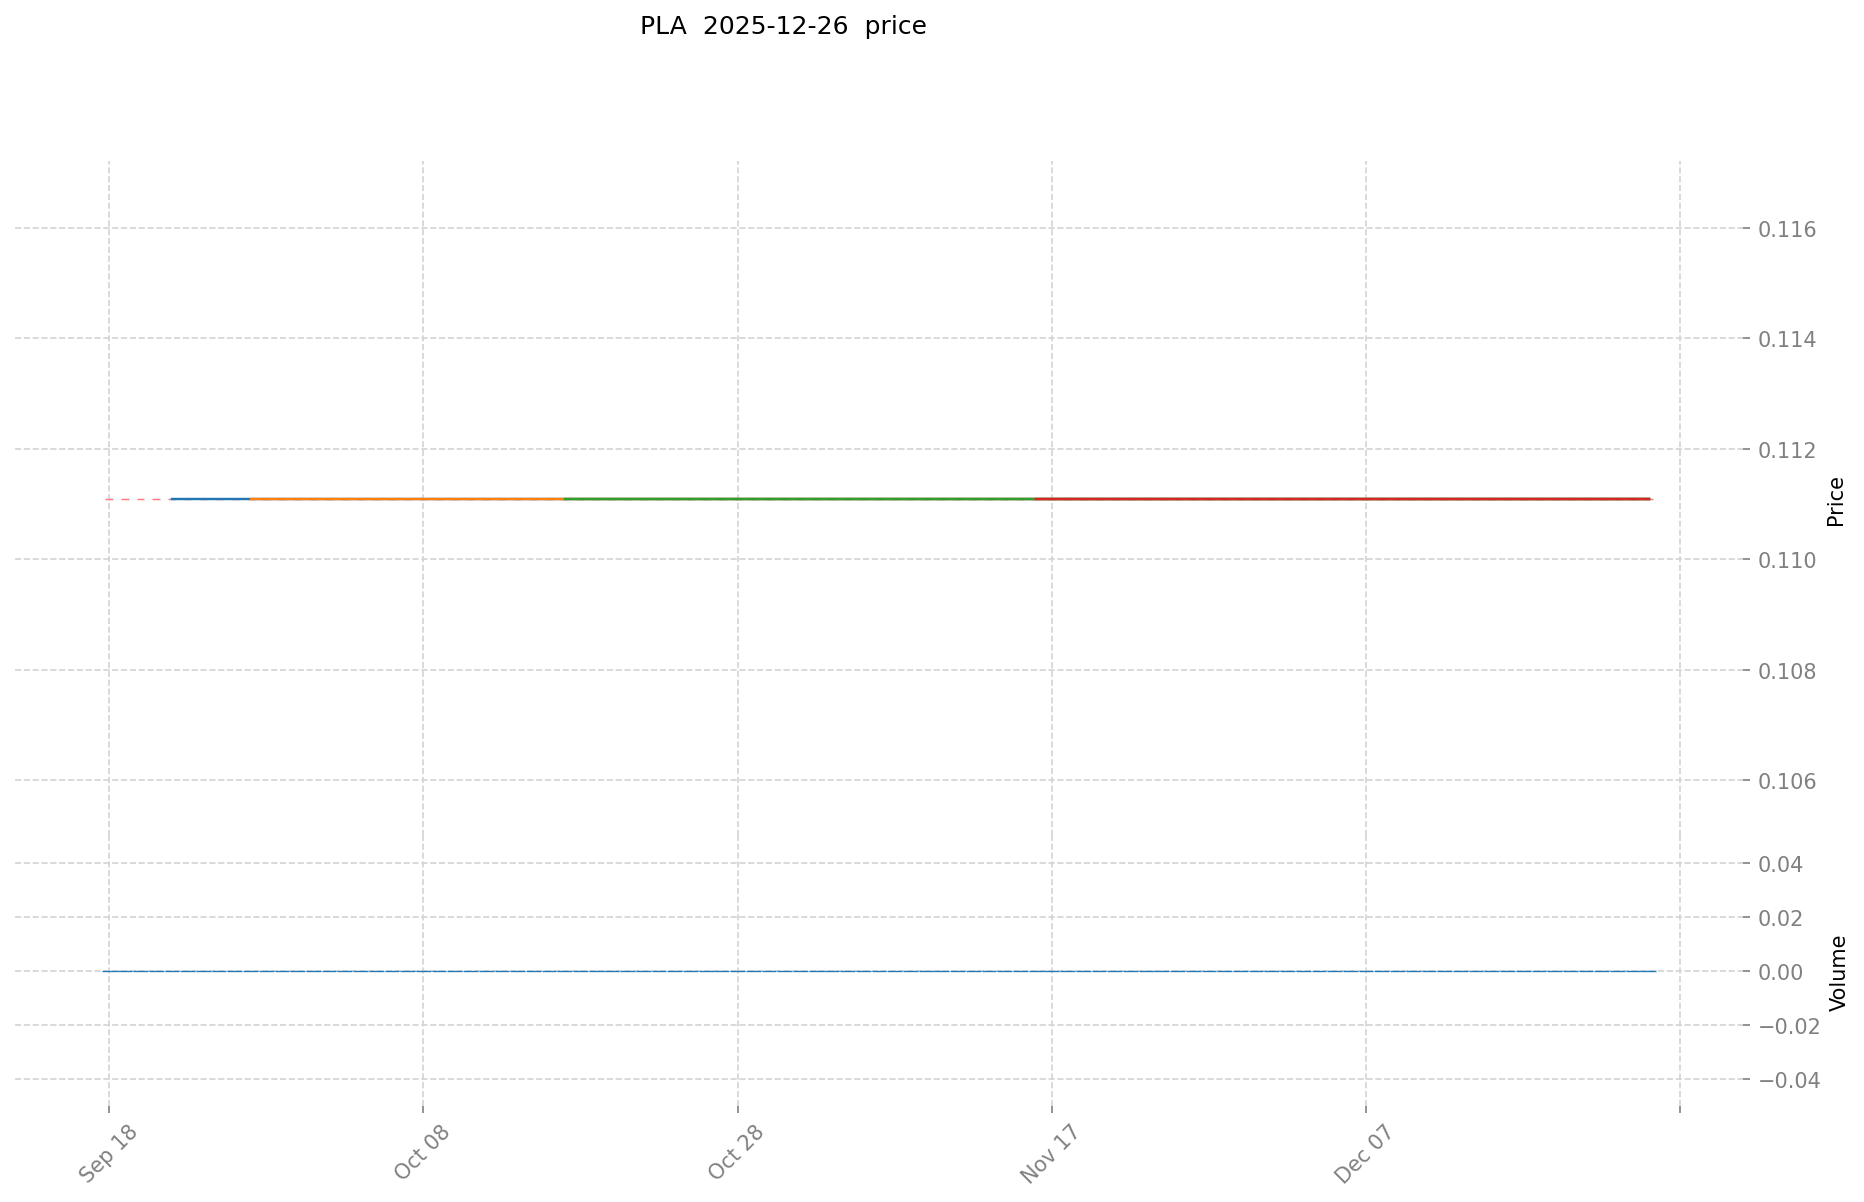
- 2021: PlayDapp (PLA) reached its all-time high of $3.74 on October 31, 2021, during the peak of the blockchain gaming hype cycle.
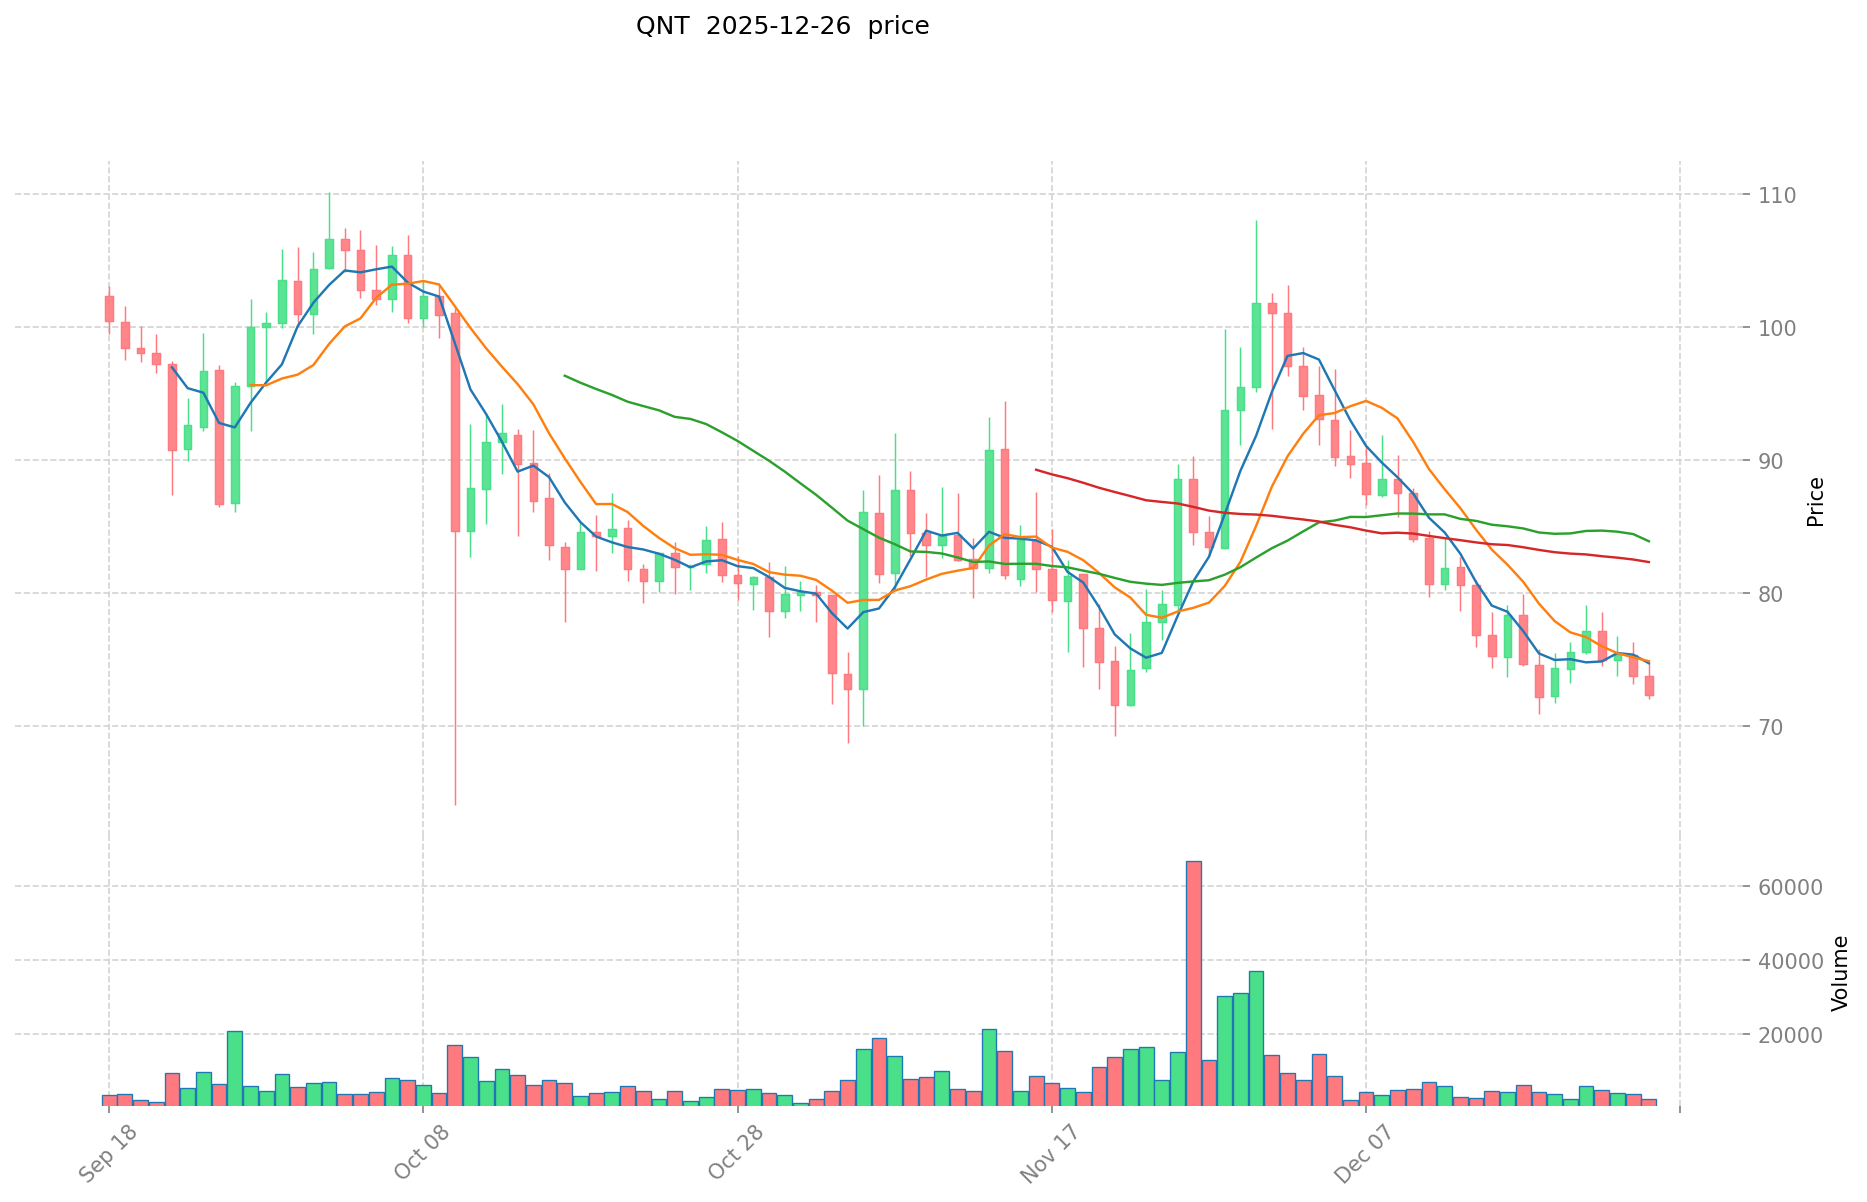
- 2021: Quant (QNT) achieved its all-time high of $427.42 on September 11, 2021, as enterprise blockchain adoption gained momentum.
- Comparative analysis: Across the market cycle from 2021 to December 2025, PLA has declined from $3.74 to $0.00213843, representing a 94.28% loss, while QNT has fallen from $427.42 to $72.28, representing an 83.10% decline. Both tokens have experienced significant bear market pressure, though QNT has maintained relatively better price resilience.
Current Market Status (December 26, 2025)
- PlayDapp (PLA) current price: $0.00213843.
- Quant (QNT) current price: $72.28.
- 24-hour trading volume: PLA reports $0 volume versus QNT's $168,737.81.
- Market Sentiment Index (Fear & Greed Index): 23 (Extreme Fear).
Click to view real-time prices:
PLA vs QNT 投资价值的核心因素
II. Key Factors Influencing Investment Value of PLA vs QNT
Tokenomics and Supply Mechanism Comparison
The reference materials provided do not contain specific information about the tokenomics, supply mechanisms, or emission schedules for PLA and QNT. Therefore, this section cannot be completed with verified data.
Institutional Adoption and Market Application
The reference materials provided do not contain detailed information regarding institutional holdings, corporate adoption rates, enterprise use cases in cross-border payments, settlement processes, or regulatory attitudes toward PLA and QNT in different jurisdictions. Therefore, this section cannot be completed with verified data.
Technology Development and Ecosystem Construction
The reference materials provided do not contain specific information about technology upgrades, technical developments, or ecosystem comparisons (including DeFi, NFT, payment systems, and smart contract implementations) for PLA and QNT. Therefore, this section cannot be completed with verified data.
Macroeconomic Factors and Market Cycles
The reference materials provided do not contain specific information about the performance of PLA and QNT in inflationary environments, their inflation-resistant properties, the impact of interest rates and the U.S. Dollar Index on these assets, or geopolitical factors affecting cross-border transaction demand. Therefore, this section cannot be completed with verified data.
Note: To provide a comprehensive analysis of the investment value factors for PLA and QNT, detailed and verified reference materials specifically addressing these cryptocurrencies' fundamental characteristics, market data, regulatory environment, and technical specifications are required.
III. 2025-2030 Price Forecast: PLA vs QNT
Short-term Forecast (2025)
- PLA: Conservative $0.0967-$0.1111 | Optimistic $0.1111-$0.1244
- QNT: Conservative $70.0243-$72.19 | Optimistic $72.19-$76.5214
Medium-term Forecast (2026-2028)
- PLA may enter accumulation phase, with estimated price range of $0.0919-$0.1708
- QNT may enter growth phase, with estimated price range of $45.3570-$129.3089
- Key drivers: Institutional capital inflows, ETF approval, ecosystem development
Long-term Forecast (2029-2030)
- PLA: Base case $0.1425-$0.1826 | Optimistic scenario $0.2272-$0.2721
- QNT: Base case $72.5125-$109.8674 | Optimistic scenario $112.0647-$147.9254
View detailed price predictions for PLA and QNT
PLA:
| 年份 |
预测最高价 |
预测平均价格 |
预测最低价 |
涨跌幅 |
| 2025 |
0.124432 |
0.1111 |
0.096657 |
5095 |
| 2026 |
0.1707607 |
0.117766 |
0.09185748 |
5407 |
| 2027 |
0.20196869 |
0.14426335 |
0.1283943815 |
6646 |
| 2028 |
0.1921587822 |
0.17311602 |
0.1332993354 |
7995 |
| 2029 |
0.272129727639 |
0.1826374011 |
0.142457172858 |
8440 |
| 2030 |
0.23647890694428 |
0.2273835643695 |
0.16371616634604 |
10533 |
QNT:
| 年份 |
预测最高价 |
预测平均价格 |
预测最低价 |
涨跌幅 |
| 2025 |
76.5214 |
72.19 |
70.0243 |
0 |
| 2026 |
100.380195 |
74.3557 |
45.356977 |
2 |
| 2027 |
93.483703825 |
87.3679475 |
79.504832225 |
20 |
| 2028 |
129.308930697375 |
90.4258256625 |
76.861951813125 |
25 |
| 2029 |
114.262073307135 |
109.8673781799375 |
72.51246959875875 |
52 |
| 2030 |
147.92543798146785 |
112.06472574353625 |
87.410486079958275 |
55 |
四、投资策略对比:PLA vs QNT
长期 vs 短期投资策略
- PLA:适合关注区块链游戏生态发展、寻求极高风险收益比的投资者,以及对NFT跨游戏资产互操作性看好的投机型投资者
- QNT:适合寻求企业级应用场景、关注机构级区块链互操作性解决方案的投资者,以及倾向于相对稳定资产的保守型投资者
风险管理与资产配置
- 保守型投资者:PLA 5% vs QNT 95%
- 激进型投资者:PLA 40% vs QNT 60%
- 对冲工具:稳定币配置、期权工具、跨币种组合配置
五、潜在风险对比
市场风险
- PLA:价格波动极大(2021年高点$3.74跌至$0.00213843,跌幅94.28%),市场流动性极低(24小时交易量为$0),易遭受市场操纵
- QNT:虽然跌幅相对较小(83.10%),但仍面临加密资产市场周期性风险,当前处于极度恐慌市场环境(恐贪指数23)
技术风险
- PLA:游戏生态建设依赖第三方开发者参与,生态稳定性存在不确定性,跨游戏资产兼容性可能面临技术挑战
- QNT:Overledger操作系统作为企业级解决方案,需保持对多条公链的适配,技术维护成本高,网络安全漏洞风险相对复杂
监管风险
- 全球监管政策对PLA和QNT的影响存在差异:PLA作为游戏代币可能面临更严格的游戏行业监管,QNT作为企业互操作性工具则面临金融基础设施相关的监管审查,两者均需关注所在司法管辖区的政策变化
六、结论:Which Is the Better Buy?
📌 投资价值总结:
- PLA优势:价格处于历史低位,若游戏生态实现突破可能带来高倍收益;进入游戏NFT领域的低成本切入点
- QNT优势:企业级应用场景明确,Overledger生态相对成熟;机构认可度高,价格相对稳定,长期预期收益更可期
✅ 投资建议:
- 新手投资者:优先选择QNT,市场认可度更高,技术应用场景更清晰,风险相对可控
- 有经验投资者:可采用PLA小额配置+QNT主仓库策略,在极度恐慌市场中适度参与PLA的风险机会,同时保持QNT的核心头寸
- 机构投资者:应重点关注QNT,其企业级应用、机构采用潜力及未来ETF审批可能性更符合机构配置需求
⚠️ 风险提示:加密货币市场波动性极高,当前处于极度恐慌环境(恐贪指数23),本文不构成投资建议,投资前请充分了解风险并谨慎决策。
FAQ
PLA和QNT有什么区别?
PLA是Platonist生态代币,主要用于去中心化应用和治理。QNT是Quant的原生代币,专注于跨链互操作性和企业级区块链解决方案。两者应用场景和技术方向不同。
PLA与QNT哪个性能更好?
PLA和QNT各有优势。PLA在交易额和用户基数上表现稳定,QNT在跨链互操作性和技术创新上领先。选择应根据您的投资策略和风险偏好而定。
PLA和QNT各自的应用场景是什么?
PLA应用于生物可降解塑料和3D打印领域,QNT则专注于跨链互操作协议,连接多个区块链网络实现数据和价值转移。
PLA和QNT的成本/价格对比如何?
PLA价格较低,而QNT目前价格为121.24美元。QNT用于Quant Overledger平台许可。两者价格差异明显,选择需根据项目实际应用场景评估。
我应该选择PLA还是QNT?
PLA适合看好长期增长的投资者,QNT适合量化交易策略。两者各有特点,选择取决于您的投资目标和风险承受能力。建议根据自身需求进行选择。
* The information is not intended to be and does not constitute financial advice or any other recommendation of any sort offered or endorsed by Gate.