The article "QBX vs GMX: Comparing Two Leading Cryptocurrency Exchanges for Optimal Trading Experience" offers a comprehensive investment comparison between QBX and GMX, detailing their historical price trends, supply mechanisms, institutional adoption, and technical developments. It addresses investor concerns about which token is a better buy, providing price predictions and investment strategies for both long and short-term perspectives. Aimed at both new and experienced investors, the article highlights the strengths of GMX in derivatives trading and QBX's growth potential in loyalty currencies. Potential risks, market conditions, and regulatory impacts are also analyzed. Access real-time prices through Gate for informed investment decisions.
Introduction: QBX vs GMX Investment Comparison
In the cryptocurrency market, QBX vs GMX comparison has been an unavoidable topic for investors. The two not only show significant differences in market cap ranking, application scenarios, and price performance, but also represent different positioning in crypto assets.
QBX (QBX): Since its launch, it has gained market recognition for its decentralized payment infrastructure for loyalty currencies.
GMX (GMX): It has been hailed as a decentralized perpetual exchange since its inception, and is one of the cryptocurrencies with high global trading volume and market capitalization.
This article will comprehensively analyze the investment value comparison between QBX and GMX, focusing on historical price trends, supply mechanisms, institutional adoption, technical ecosystems, and future predictions, attempting to answer the question most concerning investors:
"Which is the better buy right now?"
I. Price History Comparison and Current Market Status
QBX and GMX Historical Price Trends
- 2024: QBX reached its all-time high of $0.14 on December 12, 2024.
- 2025: QBX hit its all-time low of $0.0009076 on May 8, 2025, showing significant volatility.
- Comparative analysis: Over the past year, QBX has experienced a dramatic decline of 90.56% from its peak, while GMX has also seen a substantial decrease of 70.63% in the same period.
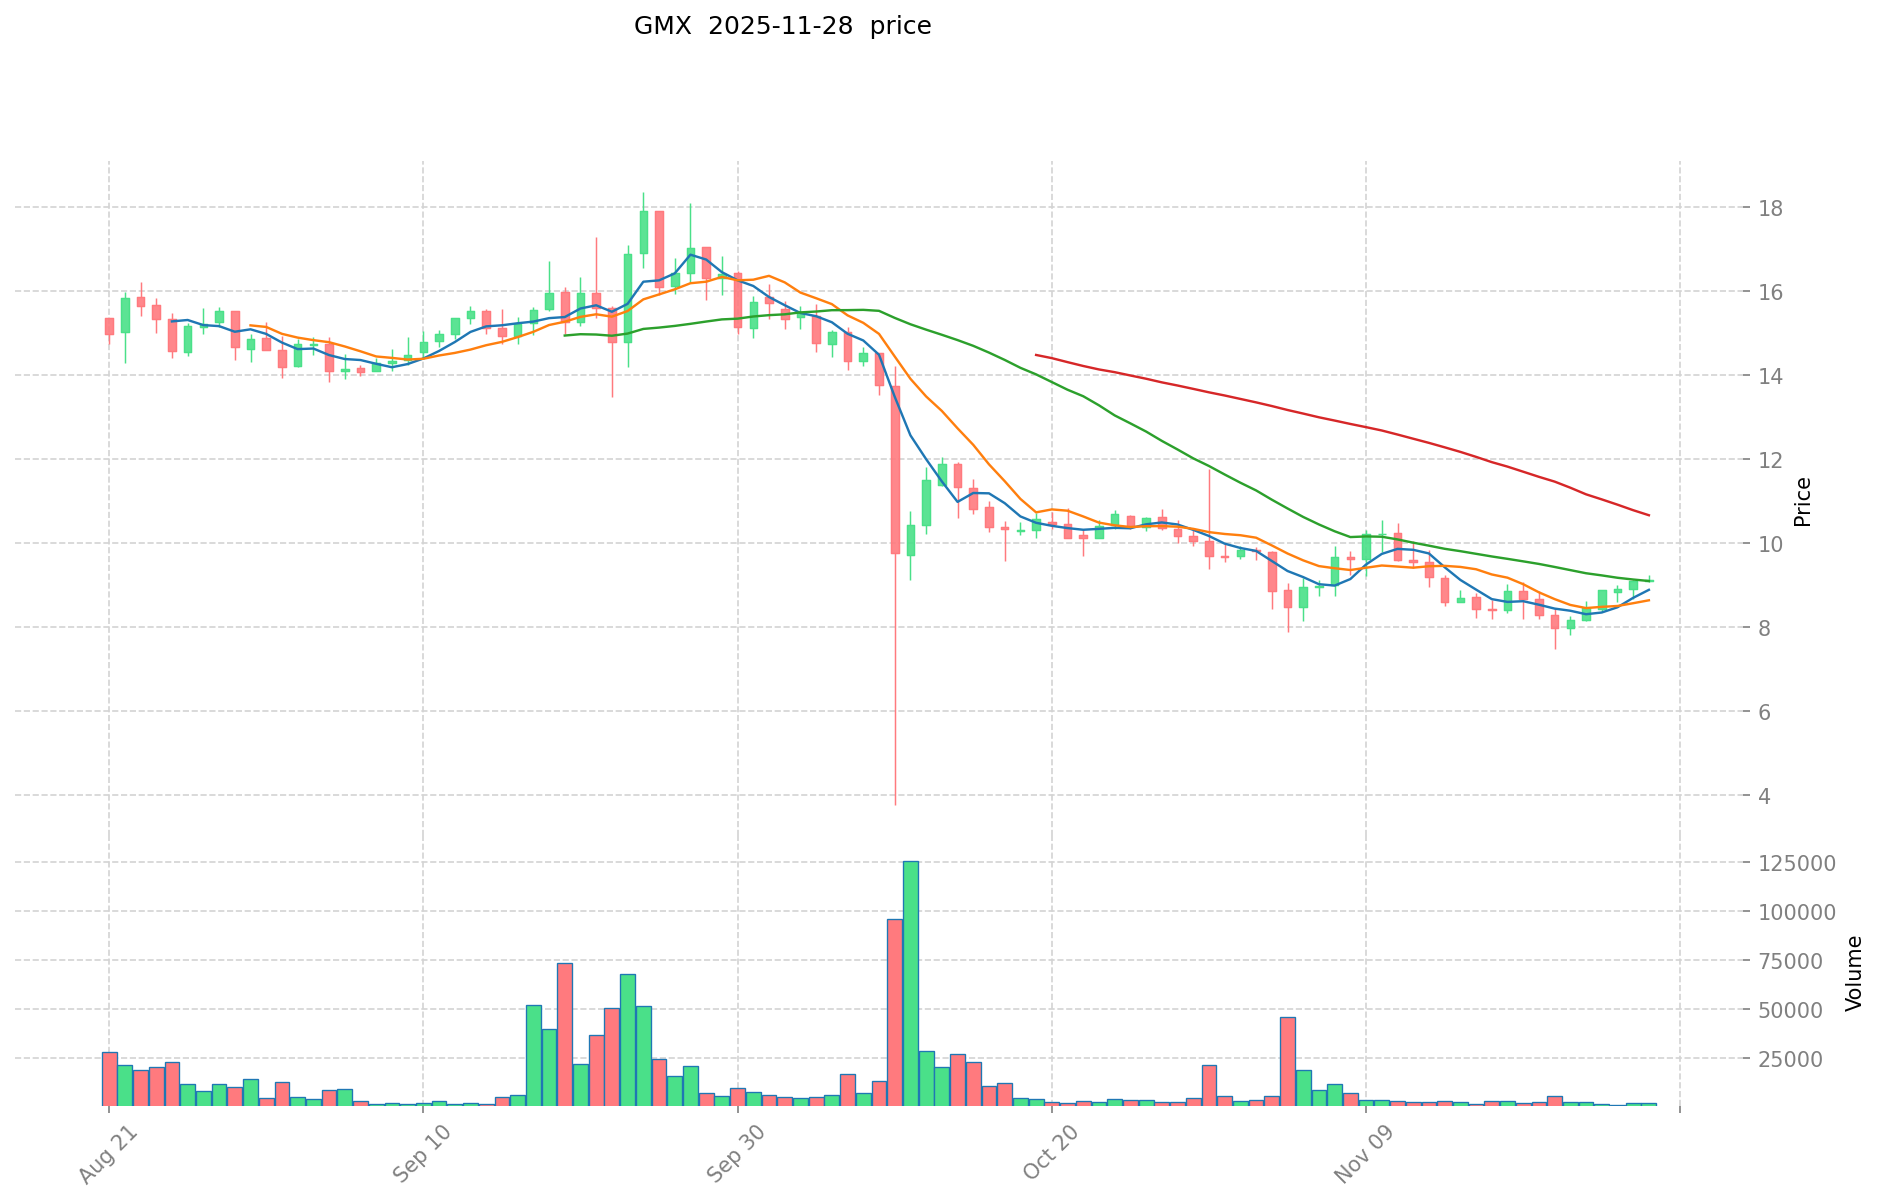
Current Market Situation (2025-11-28)
- QBX current price: $0.0031477
- GMX current price: $9.11
- 24-hour trading volume: QBX $13,364.26 vs GMX $16,245.86
- Market Sentiment Index (Fear & Greed Index): 22 (Extreme Fear)
Click to view real-time prices:
- View QBX current price Market Price
- View GMX current price Market Price

II. Key Factors Affecting Investment Value of QBX vs GMX
Supply Mechanism Comparison (Tokenomics)
- QBX: Limited supply cap of 1 billion tokens with a deflationary mechanism through fee distribution and buybacks
- GMX: Maximum supply of 13.25 million tokens with emissions-based rewards distribution
- 📌 Historical pattern: Deflationary models like QBX's tend to create upward price pressure over time when demand remains consistent, while GMX's reward-driven model supports ongoing ecosystem participation.
Institutional Adoption and Market Applications
- Institutional holdings: GMX has gained more institutional traction with adoption from trading firms and infrastructure providers
- Enterprise adoption: GMX has established itself as a leading derivatives trading protocol while QBX is building its position in the perpetual futures market
- Regulatory attitudes: Both protocols face similar regulatory scrutiny as decentralized derivatives platforms
Technical Development and Ecosystem Building
- QBX technical upgrades: Launch of the V2 protocol with improved risk management features and deeper liquidity
- GMX technical development: Implementation of GMX V2 with advanced order types and multi-asset collateral support
- Ecosystem comparison: GMX has a more mature ecosystem with broader integrations and established use cases, while QBX is expanding its partnerships to grow its ecosystem footprint
Macroeconomic Factors and Market Cycles
- Performance in inflationary environments: Both protocols generate fee revenue that can offset inflation impacts
- Macroeconomic monetary policy: Interest rates affect trading volumes on both platforms, with high volatility periods typically benefiting derivatives exchanges
- Geopolitical factors: Demand for decentralized trading platforms increases during periods of economic uncertainty
III. 2025-2030 Price Prediction: QBX vs GMX
Short-term Prediction (2025)
- QBX: Conservative $0.00220143 - $0.0031449 | Optimistic $0.0031449 - $0.004528656
- GMX: Conservative $4.65834 - $9.134 | Optimistic $9.134 - $11.14348
Mid-term Prediction (2027)
- QBX may enter a growth phase, with estimated price range $0.0038122226208 - $0.0042887504484
- GMX may enter a steady growth phase, with estimated price range $9.070116804 - $12.741354558
- Key drivers: Institutional capital inflow, ETF, ecosystem development
Long-term Prediction (2030)
- QBX: Base scenario $0.003436843225256 - $0.005054181213613 | Optimistic scenario $0.005054181213613 - $0.005306890274293
- GMX: Base scenario $10.15300776721185 - $14.300010939735 | Optimistic scenario $14.300010939735 - $16.3020124712979
View detailed price predictions for QBX and GMX
Disclaimer
QBX:
| 年份 |
预测最高价 |
预测平均价格 |
预测最低价 |
涨跌幅 |
| 2025 |
0.004528656 |
0.0031449 |
0.00220143 |
0 |
| 2026 |
0.00410535246 |
0.003836778 |
0.00322289352 |
21 |
| 2027 |
0.0042887504484 |
0.00397106523 |
0.0038122226208 |
26 |
| 2028 |
0.005451478347744 |
0.0041299078392 |
0.002395346546736 |
31 |
| 2029 |
0.005317669333753 |
0.004790693093472 |
0.004407437645994 |
52 |
| 2030 |
0.005306890274293 |
0.005054181213613 |
0.003436843225256 |
60 |
GMX:
| 年份 |
预测最高价 |
预测平均价格 |
预测最低价 |
涨跌幅 |
| 2025 |
11.14348 |
9.134 |
4.65834 |
0 |
| 2026 |
11.4567762 |
10.13874 |
6.2860188 |
11 |
| 2027 |
12.741354558 |
10.7977581 |
9.070116804 |
18 |
| 2028 |
14.71194541125 |
11.769556329 |
6.82634267082 |
29 |
| 2029 |
15.359271009345 |
13.240750870125 |
11.3870457483075 |
45 |
| 2030 |
16.3020124712979 |
14.300010939735 |
10.15300776721185 |
56 |
IV. Investment Strategy Comparison: QBX vs GMX
Long-term vs Short-term Investment Strategies
- QBX: Suitable for investors focused on loyalty and rewards ecosystems, long-term growth potential
- GMX: Suitable for traders seeking exposure to decentralized derivatives markets, shorter-term trading opportunities
Risk Management and Asset Allocation
- Conservative investors: QBX: 30% vs GMX: 70%
- Aggressive investors: QBX: 60% vs GMX: 40%
- Hedging tools: Stablecoin allocation, options, cross-currency portfolios
V. Potential Risk Comparison
Market Risks
- QBX: High volatility, relatively low liquidity
- GMX: Exposure to derivatives market fluctuations, liquidation risks
Technical Risks
- QBX: Scalability, network stability
- GMX: Smart contract vulnerabilities, oracle dependency
Regulatory Risks
- Global regulatory policies may impact both, with potential stricter oversight on decentralized derivatives platforms like GMX
VI. Conclusion: Which Is the Better Buy?
📌 Investment Value Summary:
- QBX advantages: Deflationary model, loyalty currency niche, growth potential
- GMX advantages: Established derivatives platform, higher liquidity, broader ecosystem
✅ Investment Advice:
- New investors: Consider a small allocation to GMX for exposure to decentralized trading
- Experienced investors: Balanced portfolio with both QBX and GMX, adjusting based on risk tolerance
- Institutional investors: Focus on GMX for its established market position and liquidity
⚠️ Risk Warning: Cryptocurrency markets are highly volatile. This article does not constitute investment advice.
None
VII. FAQ
Q1: What are the main differences between QBX and GMX?
A: QBX is focused on decentralized payment infrastructure for loyalty currencies with a limited supply cap of 1 billion tokens, while GMX is a decentralized perpetual exchange with a maximum supply of 13.25 million tokens. GMX has higher trading volume and market capitalization, and a more established ecosystem in the derivatives trading space.
Q2: Which token has performed better in terms of price over the past year?
A: Both tokens have experienced significant declines, but GMX has shown relatively better performance. Over the past year, QBX has declined by 90.56% from its peak, while GMX has decreased by 70.63% in the same period.
Q3: What are the key factors affecting the investment value of QBX and GMX?
A: Key factors include supply mechanisms, institutional adoption, technical development, ecosystem building, and macroeconomic factors. GMX has gained more institutional traction and has a more mature ecosystem, while QBX is expanding its partnerships and focusing on its niche in loyalty currencies.
Q4: What are the price predictions for QBX and GMX in 2030?
A: For QBX, the base scenario predicts a range of $0.003436843225256 - $0.005054181213613, with an optimistic scenario of $0.005054181213613 - $0.005306890274293. For GMX, the base scenario predicts a range of $10.15300776721185 - $14.300010939735, with an optimistic scenario of $14.300010939735 - $16.3020124712979.
Q5: How should investors allocate their portfolios between QBX and GMX?
A: Conservative investors might consider allocating 30% to QBX and 70% to GMX, while aggressive investors might allocate 60% to QBX and 40% to GMX. The exact allocation should be based on individual risk tolerance and investment goals.
Q6: What are the main risks associated with investing in QBX and GMX?
A: Both tokens face market risks such as volatility. QBX has relatively low liquidity, while GMX is exposed to derivatives market fluctuations and liquidation risks. Technical risks include scalability issues for QBX and smart contract vulnerabilities for GMX. Both face potential regulatory risks, particularly GMX as a decentralized derivatives platform.
* The information is not intended to be and does not constitute financial advice or any other recommendation of any sort offered or endorsed by Gate.


