The article provides a comprehensive comparison between two prominent blockchain governance tokens, RAI and QNT, in the decentralized finance ecosystem. It evaluates their historical price trends, market status, institutional adoption, technology development, and investment strategies, addressing the key question of which token is a better investment right now. Targeted towards investors, the analysis includes potential risks, tokenomics, and practical recommendations for both beginners and experienced investors. By focusing on crucial factors influencing investment value and providing clear guidance, the article ensures informed decision-making in crypto asset allocation.
Introduction: RAI vs QNT Investment Comparison
In the cryptocurrency market, the comparison between RAI vs QNT has always been a topic that investors cannot avoid. The two not only show significant differences in market cap ranking, application scenarios, and price performance, but also represent different positioning of crypto assets.
RAI (Rai Reflex Index): Launched in 2021, it has gained market recognition by offering a non-pegged, ETH-backed stable asset that is designed to be more stable compared to ETH and BTC while providing interest income.
QNT (Quant): Since its launch in 2018, it has been recognized as a technology provider enabling trusted digital interaction, leading the enterprise blockchain interoperability space through its global blockchain operating system, Overledger.
This article will comprehensively analyze the investment value comparison between RAI vs QNT from the perspectives of historical price trends, supply mechanisms, market positioning, and technological ecosystems, while attempting to address the question investors care most about:
"Which is the better buy right now?"
I. Historical Price Comparison and Current Market Status
Rai Reflex Index (RAI) and Quant (QNT) Historical Price Trends
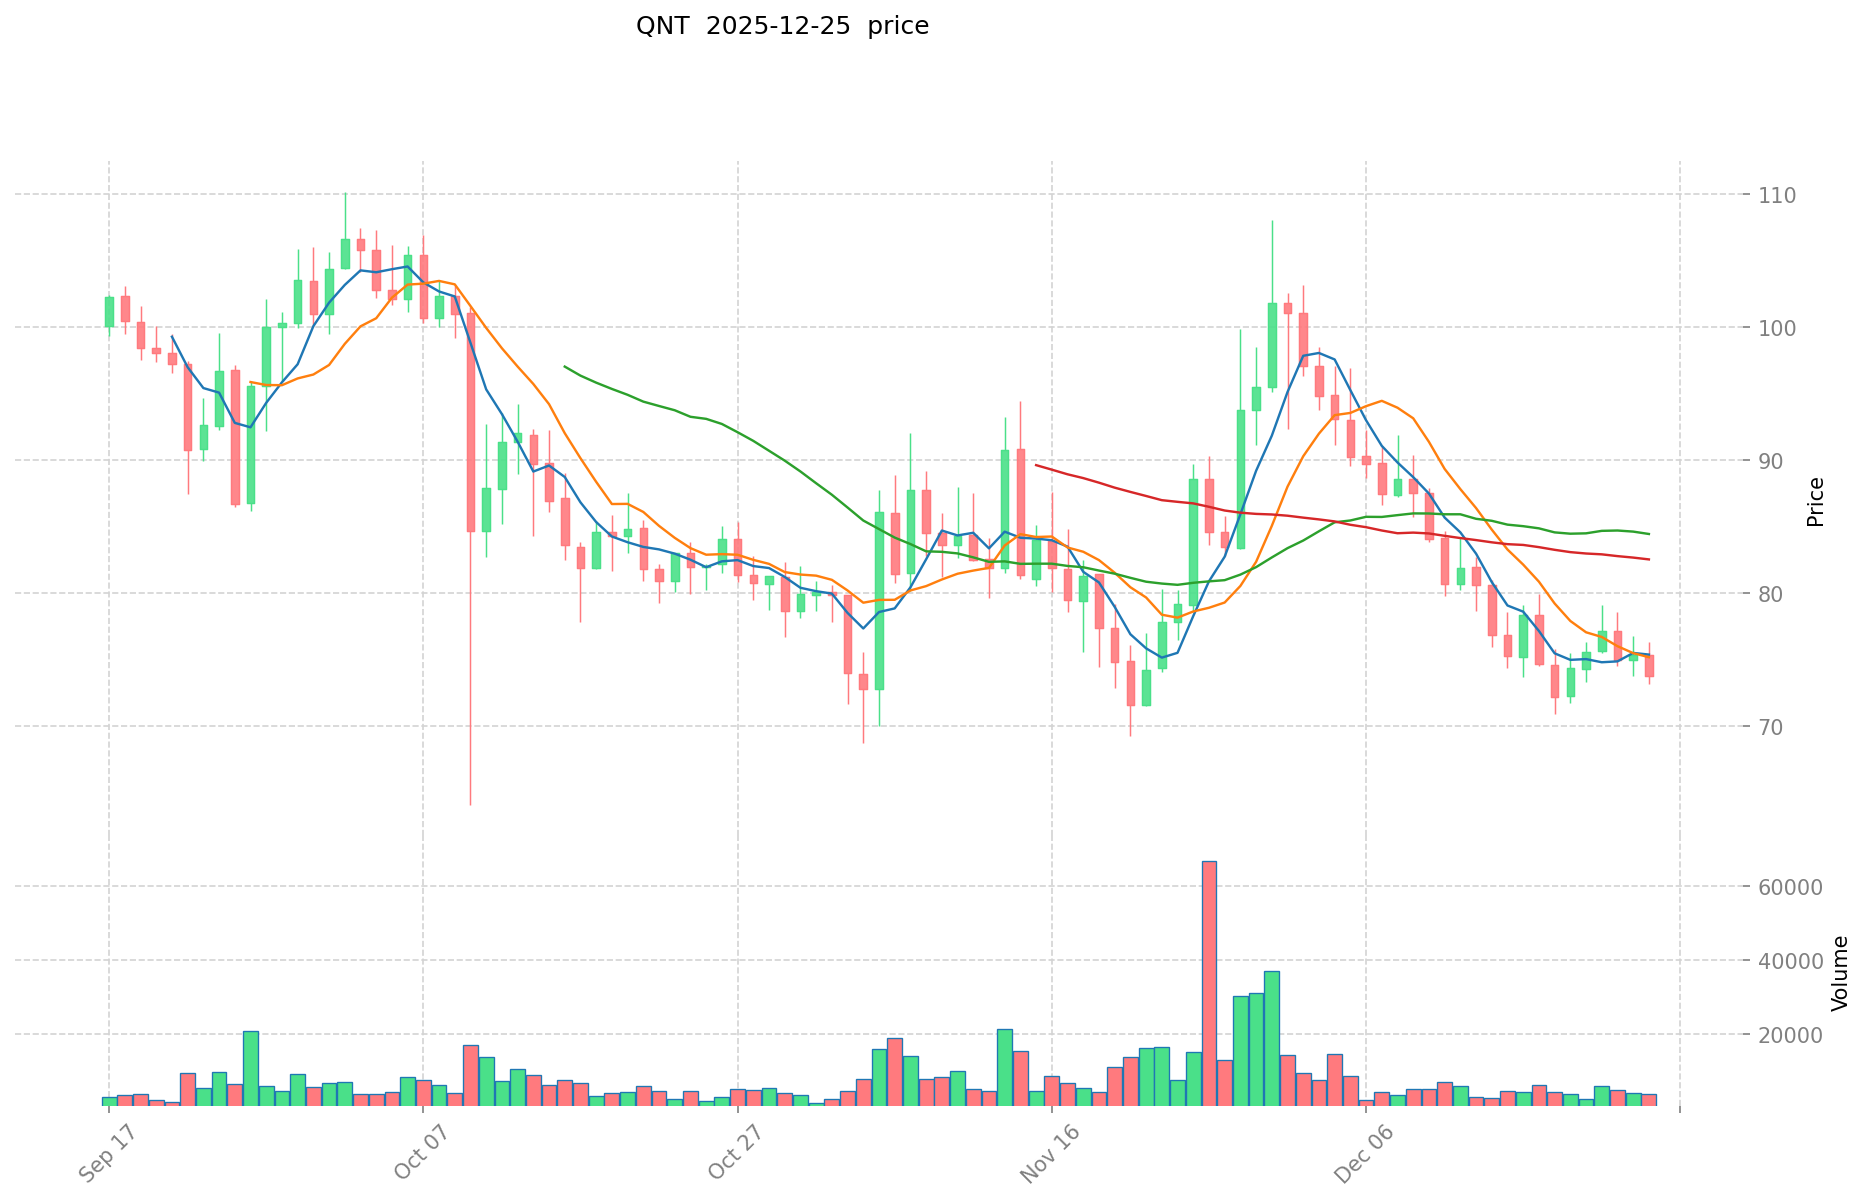
- 2021: QNT reached an all-time high of $427.42 on September 11, 2021, marking a significant peak during the bull market cycle.
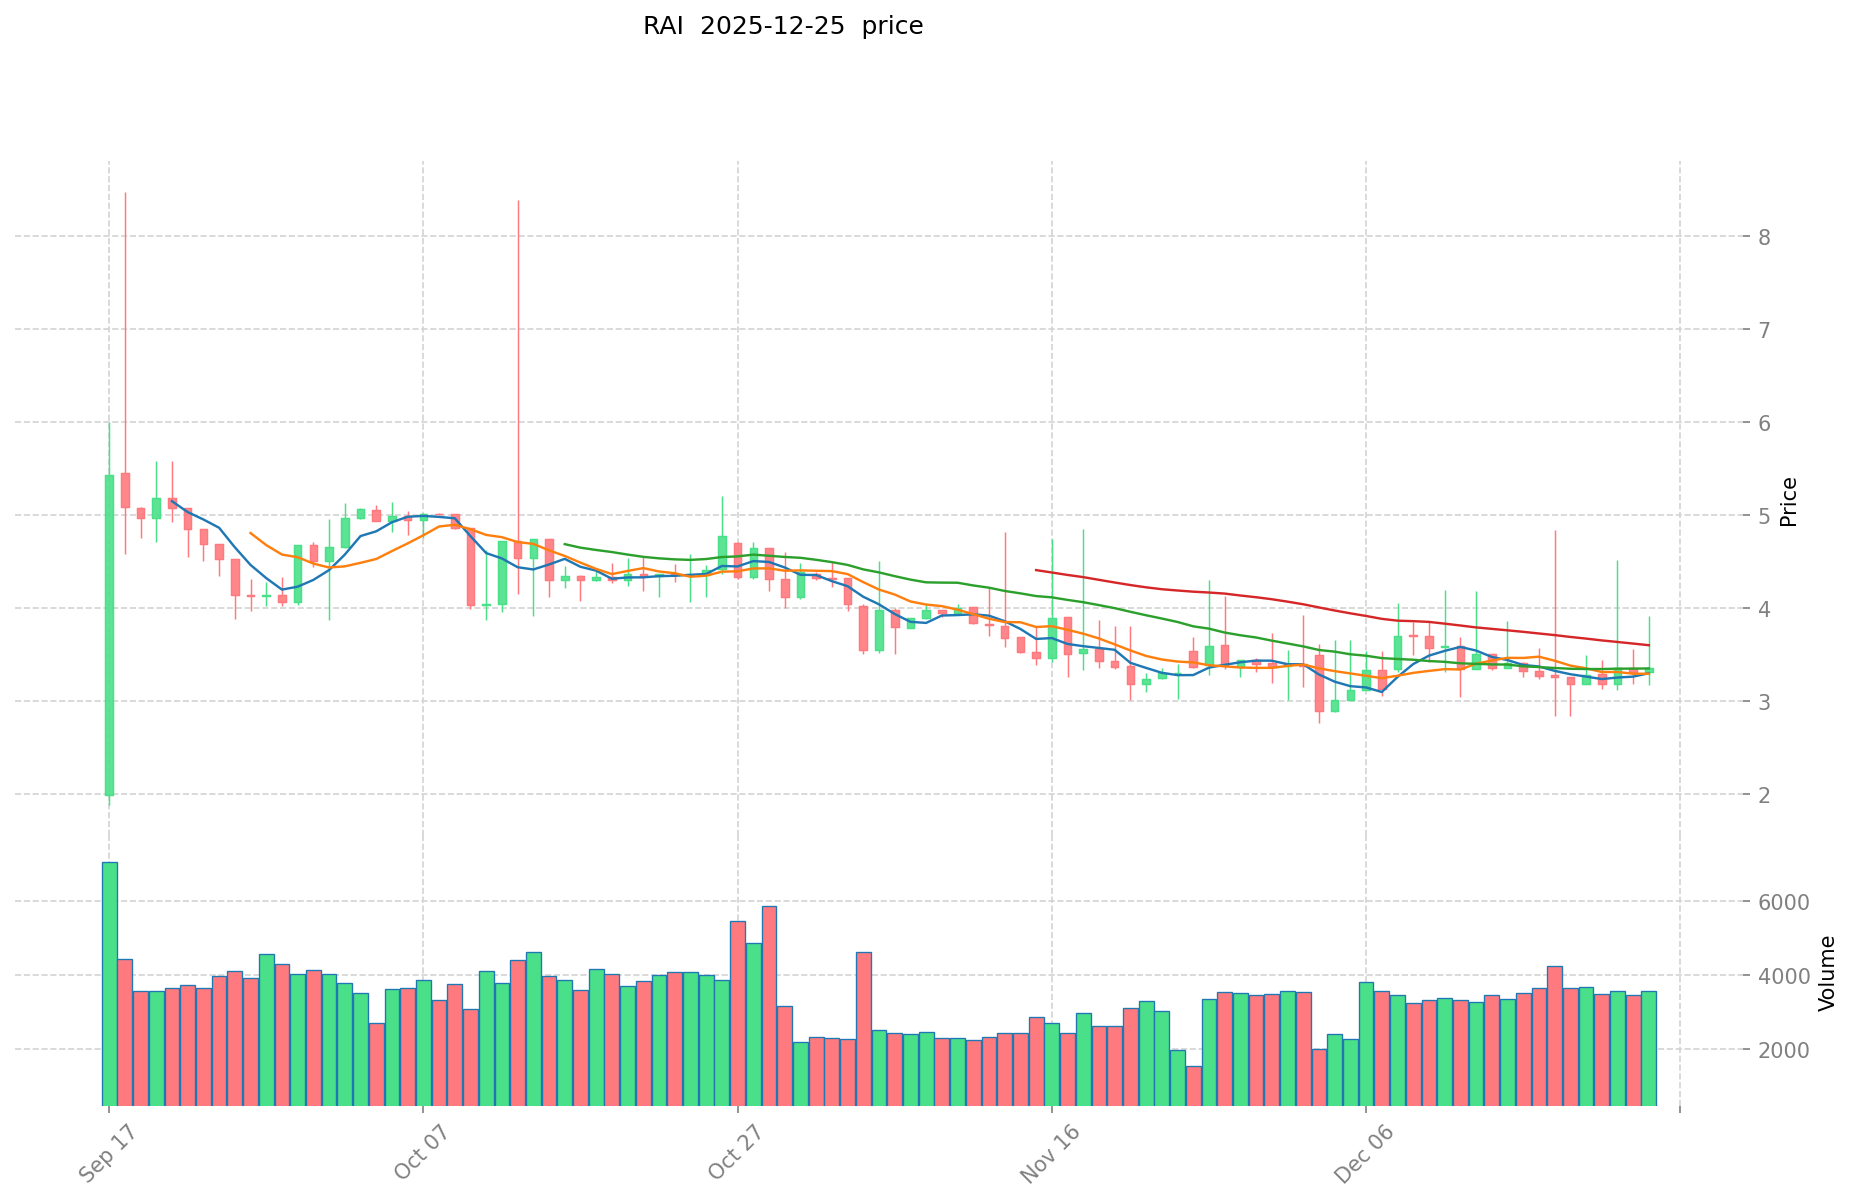
- 2023: RAI experienced a historical low of $2.44 on October 8, 2023, reflecting market pressures during the bear market period.
- Comparative Analysis: RAI has traded in a relatively narrow range between $2.44 and $5.80 since its launch, while QNT has demonstrated greater volatility, ranging from $0.215773 to $427.42 across its market history. RAI's stability reflects its design as a non-pegged stablecoin, whereas QNT's broader price range reflects its role as a utility token tied to enterprise adoption cycles.
Current Market Status (December 25, 2025)
- RAI current price: $3.365.
- QNT current price: $73.78.
- 24-hour trading volume: RAI $11,676.06 vs QNT $148,908.64.
- Fear & Greed Index: 23 (Extreme Fear).
Access real-time prices:
- View RAI current price Market Price.
- View QNT current price Market Price.
II. Core Factors Influencing RAI vs QNT Investment Value
Tokenomics Comparison
The reference materials provided do not contain specific information about the tokenomics, supply mechanisms, or technical specifications for either RAI or QNT tokens. Without detailed data on their supply structures, emission rates, or deflationary mechanisms, this section cannot be completed accurately.
Institutional Adoption and Market Application
The reference materials indicate that investment value for these tokens hinges on market demand and project utility, but do not provide specific details regarding:
- Institutional holdings or institutional preference for either token
- Enterprise adoption rates in cross-border payments, settlement, or investment portfolios
- Regulatory approaches from specific jurisdictions toward these assets
Technology Development and Ecosystem Building
The provided materials do not contain substantive information about:
- Technical upgrades or roadmap developments for either RAI or QNT
- DeFi integration, NFT support, payment functionality, or smart contract deployment
- Comparative ecosystem analysis between the two tokens
Macroeconomic Factors and Market Cycles
General market principles indicate that crypto asset performance correlates with broader economic conditions, including inflation environments, monetary policy shifts, and geopolitical factors. However, the reference materials do not provide:
- Comparative analysis of anti-inflationary properties between RAI and QNT
- Specific data on how interest rates or USD index movements affect these tokens
- Geopolitical risk assessments related to either asset
Note: The core factors affecting investment value include market demand, project utility, technological advancements, strong partnerships, and community support. However, detailed comparative analysis requires additional primary sources and project-specific documentation.
Three、2025-2030 Price Forecast: RAI vs QNT
Short-term Forecast (2025)
- RAI: Conservative $2.65-$3.36 | Optimistic $3.36-$4.70
- QNT: Conservative $50.94-$73.83 | Optimistic $73.83-$96.72
Mid-term Forecast (2026-2028)
- RAI may enter moderate growth phase, with expected price range of $3.02-$6.48
- QNT may enter consolidation and breakthrough phase, with expected price range of $56.99-$128.46
- Key drivers: Institutional capital inflow, ETF expansion, ecosystem development
Long-term Forecast (2029-2030)
- RAI: Base scenario $4.89-$5.96 | Optimistic scenario $6.44-$7.93
- QNT: Base scenario $75.66-$109.46 | Optimistic scenario $126.98-$152.51
View RAI and QNT detailed price predictions
RAI:
| 年份 |
预测最高价 |
预测平均价格 |
预测最低价 |
涨跌幅 |
| 2025 |
4.6998 |
3.357 |
2.65203 |
0 |
| 2026 |
5.23692 |
4.0284 |
3.0213 |
19 |
| 2027 |
6.254091 |
4.63266 |
3.011229 |
37 |
| 2028 |
6.477616845 |
5.4433755 |
3.755929095 |
61 |
| 2029 |
6.4373358663 |
5.9604961725 |
4.88760686145 |
77 |
| 2030 |
7.934612504832 |
6.1989160194 |
3.781338771834 |
84 |
QNT:
| 年份 |
预测最高价 |
预测平均价格 |
预测最低价 |
涨跌幅 |
| 2025 |
96.7173 |
73.83 |
50.9427 |
0 |
| 2026 |
90.390069 |
85.27365 |
73.335339 |
15 |
| 2027 |
93.10177107 |
87.8318595 |
65.873894625 |
19 |
| 2028 |
128.4628777047 |
90.466815285 |
56.99409362955 |
22 |
| 2029 |
126.979221934026 |
109.46484649485 |
93.0451195206225 |
48 |
| 2030 |
152.50642413662502 |
118.222034214438 |
75.66210189724032 |
60 |
Four、Investment Strategy Comparison: RAI vs QNT
Long-term vs Short-term Investment Strategy
- RAI: Suitable for investors focused on stablecoin stability, seeking non-pegged assets with interest income, and those pursuing capital preservation with moderate growth expectations
- QNT: Suitable for investors targeting enterprise blockchain adoption, seeking exposure to interoperability solutions, and those with higher risk tolerance for technology-driven utility tokens
Risk Management and Asset Allocation
- Conservative investors: RAI 60% vs QNT 40%
- Aggressive investors: RAI 30% vs QNT 70%
- Hedging tools: Stablecoin allocation, options strategies, cross-asset diversification
Five、Potential Risk Comparison
Market Risk
- RAI: Limited trading volume ($11,676.06 in 24-hour trading), narrow price range may indicate lower market liquidity and adoption, vulnerability to market sentiment shifts
- QNT: Greater historical volatility (ranging from $0.215773 to $427.42), cyclical enterprise adoption patterns, susceptibility to institutional capital flows
Technology Risk
- RAI: Dependency on Ethereum network stability, smart contract audit vulnerabilities, collateralization mechanism maintenance
- QNT: Overledger platform scalability, interoperability protocol updates, network effect concentration risks
Regulatory Risk
- Global regulatory frameworks for stablecoins (RAI) remain uncertain, particularly regarding reserve requirements and collateralization oversight
- Enterprise blockchain tokens (QNT) face varying regulatory treatment across jurisdictions, with some regions restricting institutional blockchain adoption
Six、Conclusion: Which Is the Better Buy?
📌 Investment Value Summary:
- RAI Advantages: Non-pegged stablecoin design providing stability relative to ETH and BTC, interest income generation, lower volatility for capital preservation
- QNT Advantages: Enterprise blockchain leadership through Overledger, established market presence since 2018, higher growth potential driven by institutional blockchain adoption
✅ Investment Recommendations:
- Beginner investors: Consider RAI for portfolio stability and predictable performance, allocating smaller QNT positions for ecosystem exposure
- Experienced investors: Construct diversified positions balancing RAI's defensive characteristics with QNT's growth potential, utilizing technical analysis to optimize entry points
- Institutional investors: Evaluate QNT for interoperability infrastructure exposure; assess RAI's collateralization mechanisms and regulatory compliance status before allocation
⚠️ Risk Disclaimer: The cryptocurrency market exhibits extreme volatility. This analysis is provided for informational purposes only and does not constitute investment advice. Investors should conduct independent research and consult financial advisors before making investment decisions.
FAQ
QNT是什么?
QNT是Quant网络的原生代币,基于以太坊区块链发行。它用于连接企业、私有和公共区块链,是Overledger生态系统的核心资产。
Quant是什么币?
Quant(QNT)是基于以太坊的代币,用于连接各个企业、私有和公共区块链。QNT是Quant网络的原生加密货币,包括Overledger OS和Overledger Network两大核心组件。
RAI是什么,有什么特点?
RAI是非锚定的ETH支持稳定资产,具有高稳定性和利息收益特点。作为DeFi生态重要资产,RAI相比ETH和BTC更稳定,提供安全可靠的价值储存方案。
RAI和QNT有什么区别?
RAI Finance专注于去中心化交易,提供可定制的DEX服务;QNT则是区块链数据清算层。RAI主要服务交易者,QNT服务于跨链数据清算。两者应用场景完全不同。
RAI和QNT哪个更值得投资?
QNT因技术创新和市场潜力更具投资价值。RAI作为稳定币选项较为保守。若追求增长,QNT前景更优;若求稳定,RAI更适合。
RAI和QNT分别应用在什么领域?
RAI主要应用于去中心化金融(DeFi)领域,提供全面的金融服务套件。QNT则应用于区块链数据和市场数据的提供,服务于多链互操作性生态。
* The information is not intended to be and does not constitute financial advice or any other recommendation of any sort offered or endorsed by Gate.