The article "REQ vs QNT: Comparing Two Leading Blockchain Solutions for Enterprise Adoption" offers an insightful analysis of two prominent crypto assets, Request (REQ) and Quant (QNT), focusing on investment value, historical price trends, tokenomics, market status, and technological ecosystems. It addresses key investment questions and offers strategic advice for both new and experienced investors, detailing supply mechanisms, institutional adoption, and risk management. Tailored for investors and institutional stakeholders, the article guides readers through short, mid, and long-term price predictions, emphasizing QNT's stability and enterprise adoption while highlighting REQ's decentralized payment potential.
Introduction: REQ vs QNT Investment Comparison
In the cryptocurrency market, Request (REQ) vs Quant (QNT) comparison has always been a topic that investors can't avoid. The two not only have significant differences in market cap ranking, application scenarios, and price performance, but also represent different positioning of crypto assets.
Request (REQ): Since its launch in 2017, it has gained market recognition for its decentralized payment request network built on Ethereum.
Quant (QNT): Introduced in 2018, it has been hailed as a technology provider enabling trusted digital interactions, leading in innovation and blockchain adoption for enterprises.
This article will comprehensively analyze the investment value comparison between REQ and QNT, focusing on historical price trends, supply mechanisms, institutional adoption, technological ecosystems, and future predictions, and attempt to answer the question investors care about most:
"Which is the better buy right now?"
I. Price History Comparison and Current Market Status
REQ (Coin A) and QNT (Coin B) Historical Price Trends
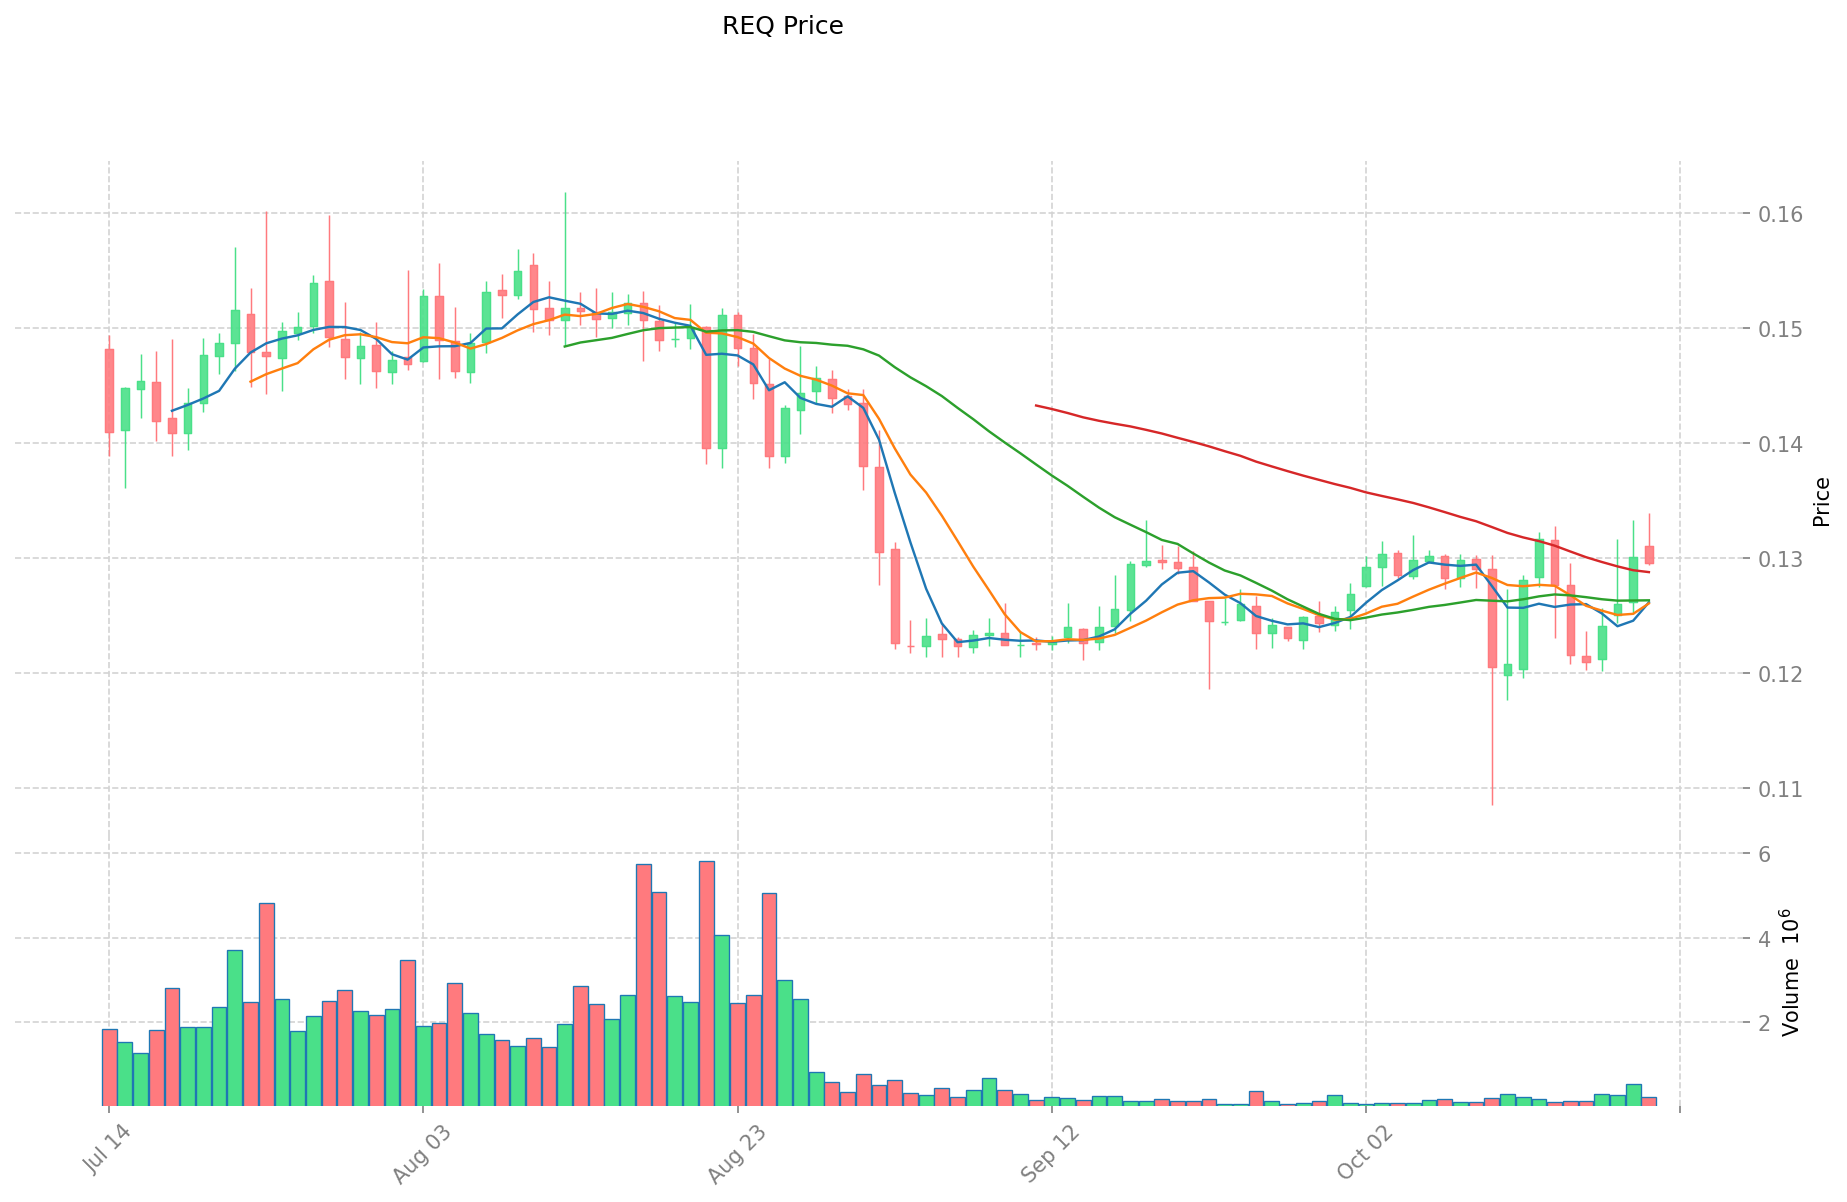
- 2021: REQ reached its all-time high of $1.059 due to increased adoption and market enthusiasm.
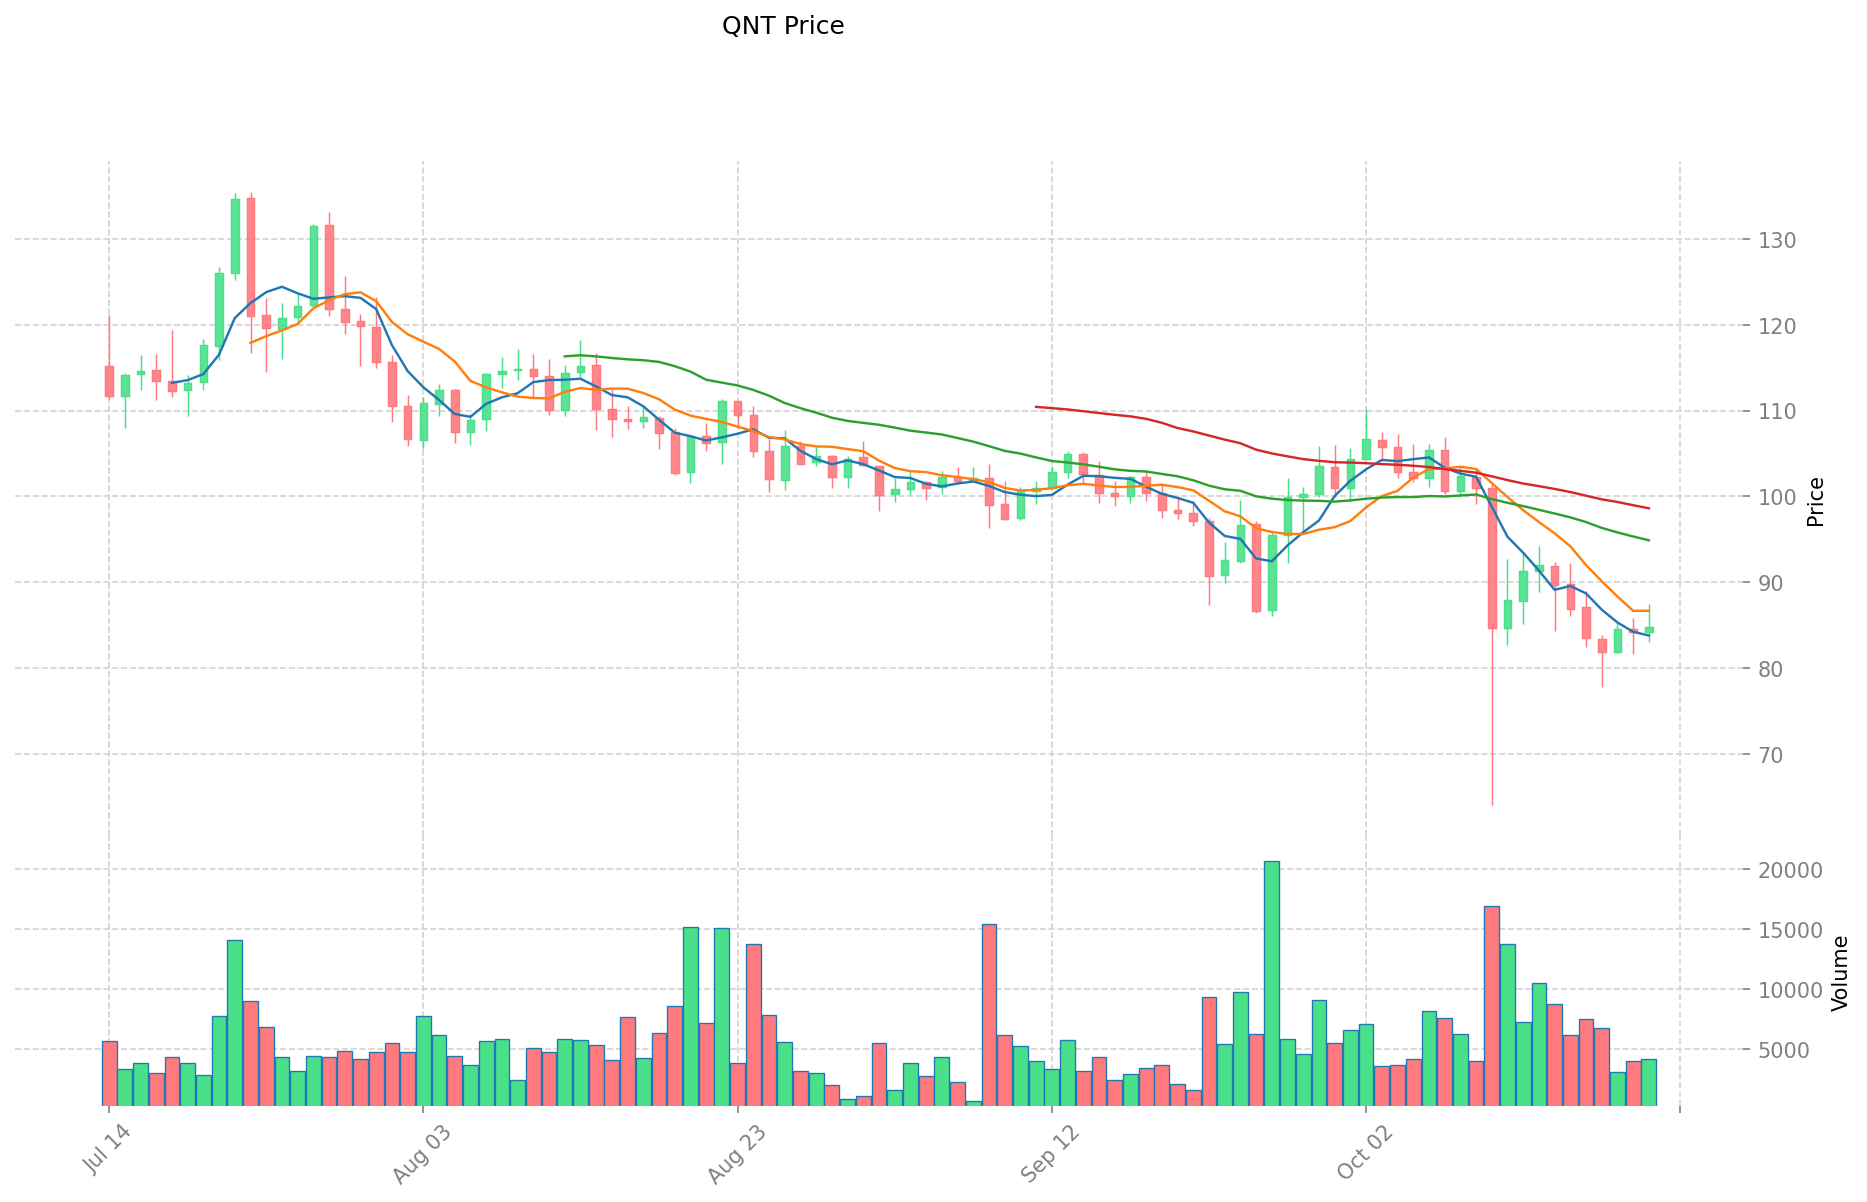
- 2021: QNT hit its record high of $427.42 in September, influenced by growing interest in interoperability solutions.
- Comparative analysis: During the 2022 market downturn, REQ dropped from its peak to a low of $0.00454707, while QNT showed more resilience, maintaining a higher price level.
Current Market Situation (2025-10-21)
- REQ current price: $0.12954
- QNT current price: $84.8
- 24-hour trading volume: REQ $31,592.62 vs QNT $391,435.99
- Market Sentiment Index (Fear & Greed Index): 29 (Fear)
Click to view real-time prices:
- Check REQ current price Market Price
- Check QNT current price Market Price
II. Core Factors Influencing REQ vs QNT Investment Value
Supply Mechanism Comparison (Tokenomics)
- QNT: The supply mechanism affects price dynamics through market demand and supply relationships
- REQ: Market trends and ecosystem development influence investment strategy value
- 📌 Historical Pattern: Understanding supply mechanisms helps capture future market opportunities and impacts price cycle changes.
Institutional Adoption and Market Applications
- Institutional Holdings: Market supply and demand changes along with investor psychology are critical factors
- Enterprise Adoption: Private credit dominates the RWA market with 58% share, representing about $14 billion in tokenized value
- Regulatory Attitudes: Different regulatory approaches affect strategic goals and investment value realization
Technology Development and Ecosystem Building
- Ecosystem Support: The ecosystem is a crucial component for project sustainability and growth
- Development Factors: Technical development serves as a core factor in determining long-term value
- Ecosystem Comparison: Ecosystem development provides valuable insights for investment strategies
Macroeconomic and Market Cycles
- Performance in Inflationary Environments: Market trends and historical patterns influence investment performance
- Macroeconomic Monetary Policy: Operating costs, accessibility, and secondary market liquidity potential affect asset valuation
- Geopolitical Factors: External factors can impact strategic goals and investment value realization
III. 2025-2030 Price Prediction: REQ vs QNT
Short-term Prediction (2025)
- REQ: Conservative $0.1023-$0.1295 | Optimistic $0.1295-$0.1438
- QNT: Conservative $76.36-$84.85 | Optimistic $84.85-$126.42
Mid-term Prediction (2027)
- REQ may enter a growth phase, with estimated prices of $0.0985-$0.2098
- QNT may enter a steady growth phase, with estimated prices of $86.37-$136.66
- Key drivers: Institutional capital inflow, ETF, ecosystem development
Long-term Prediction (2030)
- REQ: Base scenario $0.1641-$0.1823 | Optimistic scenario $0.1823-$0.1987
- QNT: Base scenario $108.02-$152.14 | Optimistic scenario $152.14-$178.00
View detailed price predictions for REQ and QNT
Disclaimer: This analysis is for informational purposes only and should not be considered as financial advice. Cryptocurrency markets are highly volatile and unpredictable. Always conduct your own research before making any investment decisions.
REQ:
| 年份 |
预测最高价 |
预测平均价格 |
预测最低价 |
涨跌幅 |
| 2025 |
0.1438338 |
0.12958 |
0.1023682 |
0 |
| 2026 |
0.144909314 |
0.1367069 |
0.121669141 |
5 |
| 2027 |
0.20980407943 |
0.140808107 |
0.0985656749 |
8 |
| 2028 |
0.18056527601145 |
0.175306093215 |
0.0946652903361 |
35 |
| 2029 |
0.186832468843886 |
0.177935684613225 |
0.106761410767935 |
37 |
| 2030 |
0.198798643634125 |
0.182384076728555 |
0.1641456690557 |
40 |
QNT:
| 年份 |
预测最高价 |
预测平均价格 |
预测最低价 |
涨跌幅 |
| 2025 |
126.4265 |
84.85 |
76.365 |
0 |
| 2026 |
113.0329275 |
105.63825 |
53.8755075 |
24 |
| 2027 |
136.6694859375 |
109.33558875 |
86.3751151125 |
28 |
| 2028 |
157.4432478 |
123.00253734375 |
83.64172539375 |
45 |
| 2029 |
164.06078430909375 |
140.222892571875 |
133.21174794328125 |
65 |
| 2030 |
178.005950975366718 |
152.141838440484375 |
108.020705292743906 |
79 |
IV. Investment Strategy Comparison: REQ vs QNT
Long-term vs Short-term Investment Strategies
- REQ: Suitable for investors focused on payment solutions and ecosystem potential
- QNT: Suitable for investors seeking stability and interoperability solutions
Risk Management and Asset Allocation
- Conservative investors: REQ: 30% vs QNT: 70%
- Aggressive investors: REQ: 60% vs QNT: 40%
- Hedging tools: Stablecoin allocation, options, cross-currency portfolios
V. Potential Risk Comparison
Market Risks
- REQ: Higher volatility, susceptible to market sentiment
- QNT: Relatively more stable, but still subject to market cycles
Technical Risks
- REQ: Scalability, network stability
- QNT: Interoperability challenges, potential security vulnerabilities
Regulatory Risks
- Global regulatory policies may have differing impacts on both assets
VI. Conclusion: Which Is the Better Buy?
📌 Investment Value Summary:
- REQ advantages: Decentralized payment request network, potential for growth in DeFi sector
- QNT advantages: Enterprise adoption, interoperability solutions, resilience during market downturns
✅ Investment Advice:
- New investors: Consider a balanced approach with a slight preference for QNT due to its stability
- Experienced investors: Explore a strategic mix of both assets based on risk tolerance and market analysis
- Institutional investors: Focus on QNT for its enterprise solutions and potential for institutional adoption
⚠️ Risk Warning: Cryptocurrency markets are highly volatile. This article does not constitute investment advice.
None
FAQ
Q1: What are the key differences between REQ and QNT?
A: REQ is a decentralized payment request network built on Ethereum, while QNT is a technology provider enabling trusted digital interactions for enterprises. REQ focuses on payment solutions, while QNT specializes in interoperability and blockchain adoption for businesses.
Q2: How have REQ and QNT performed historically in terms of price?
A: In 2021, REQ reached its all-time high of $1.059, while QNT hit its record high of $427.42. During the 2022 market downturn, REQ experienced a more significant drop, while QNT showed more resilience and maintained a higher price level.
Q3: What are the current prices and trading volumes for REQ and QNT?
A: As of 2025-10-21, REQ's price is $0.12954 with a 24-hour trading volume of $31,592.62. QNT's price is $84.8 with a 24-hour trading volume of $391,435.99.
Q4: How do the supply mechanisms of REQ and QNT compare?
A: QNT's supply mechanism affects price dynamics through market demand and supply relationships, while REQ's market trends and ecosystem development influence its investment strategy value. Understanding these mechanisms helps capture future market opportunities and impacts price cycle changes.
Q5: What are the price predictions for REQ and QNT in the short, mid, and long term?
A: For REQ: Short-term (2025) prediction is $0.1023-$0.1438, mid-term (2027) is $0.0985-$0.2098, and long-term (2030) is $0.1641-$0.1987. For QNT: Short-term (2025) prediction is $76.36-$126.42, mid-term (2027) is $86.37-$136.66, and long-term (2030) is $108.02-$178.00.
Q6: How should investors allocate their assets between REQ and QNT?
A: Conservative investors might consider allocating 30% to REQ and 70% to QNT, while aggressive investors might opt for 60% REQ and 40% QNT. It's important to note that these allocations should be adjusted based on individual risk tolerance and market analysis.
Q7: What are the main risks associated with investing in REQ and QNT?
A: Both assets face market risks, with REQ showing higher volatility. Technical risks include scalability and network stability for REQ, and interoperability challenges for QNT. Regulatory risks may impact both assets differently depending on global policies.
Q8: Which is considered the better buy between REQ and QNT?
A: The better buy depends on individual investment goals and risk tolerance. QNT may be preferable for new investors due to its stability and enterprise adoption. Experienced investors might consider a mix of both assets, while institutional investors may lean towards QNT for its enterprise solutions.
* The information is not intended to be and does not constitute financial advice or any other recommendation of any sort offered or endorsed by Gate.


