This comprehensive guide compares SATS and SAND tokens across multiple investment dimensions. SATS, a Bitcoin BRC-20 token launched in June 2023 with market cap of $33.24 million, represents emerging ordinals-based innovations. SAND, an Ethereum gaming metaverse utility token since August 2020, commands a larger $368.62 million market cap with significantly higher liquidity. The article analyzes historical price performance, current market status as of January 2026, investment strategies for different risk profiles, and technical risk factors. Long-term price predictions through 2031 suggest SAND demonstrates higher growth trajectory potential. Both tokens present distinct opportunities—SATS for Bitcoin ecosystem exposure, SAND for metaverse gaming exposure—requiring careful risk assessment and portfolio allocation decisions based on individual investment objectives and risk tolerance levels.
Introduction: SATS vs SAND Investment Comparison
In the cryptocurrency market, the comparison between SATS and SAND has been a topic of interest among investors. The two tokens exhibit notable differences in market cap ranking, application scenarios, and price performance, representing distinct crypto asset positioning.
SATS: Launched in June 2023, this BRC-20 token has gained market recognition as part of the Bitcoin ecosystem expansion. Currently ranked #669 with a market cap of approximately $33.24 million, SATS represents a segment of the ordinals and inscription-based token movement.
SAND (Sandbox): Since its launch in August 2020, SAND has been positioned as a key utility token in the virtual gaming metaverse space. Ranked #153 with a market cap of approximately $368.62 million, it enables players to create, own, and monetize gaming experiences through Ethereum-based functionality.
This article will provide a comprehensive analysis comparing SATS vs SAND across multiple dimensions including historical price movements, supply mechanisms, adoption patterns, technical ecosystems, and future outlook. We aim to address the key question that concerns investors:
"Which is the better buy right now?"
I. Historical Price Comparison and Current Market Status
Historical Price Trends of SATS (Coin A) and SAND (Coin B)
- 2023: SATS reached a notable price level of $0.000000941 on December 15, influenced by market dynamics during that period.
- 2021: SAND experienced a price movement to $8.4 on November 25, reflecting significant market activity at that time.
- 2025: SATS recorded a price of $0.00000000638 on October 10, representing a lower price point in its trading history.
- 2020: SAND was priced at $0.02897764 on November 4, marking an earlier phase of its market presence.
- Comparative Analysis: During various market cycles, SATS has shown price variations between $0.000000941 and $0.00000000638, while SAND has demonstrated price movements ranging from $8.4 to $0.02897764.
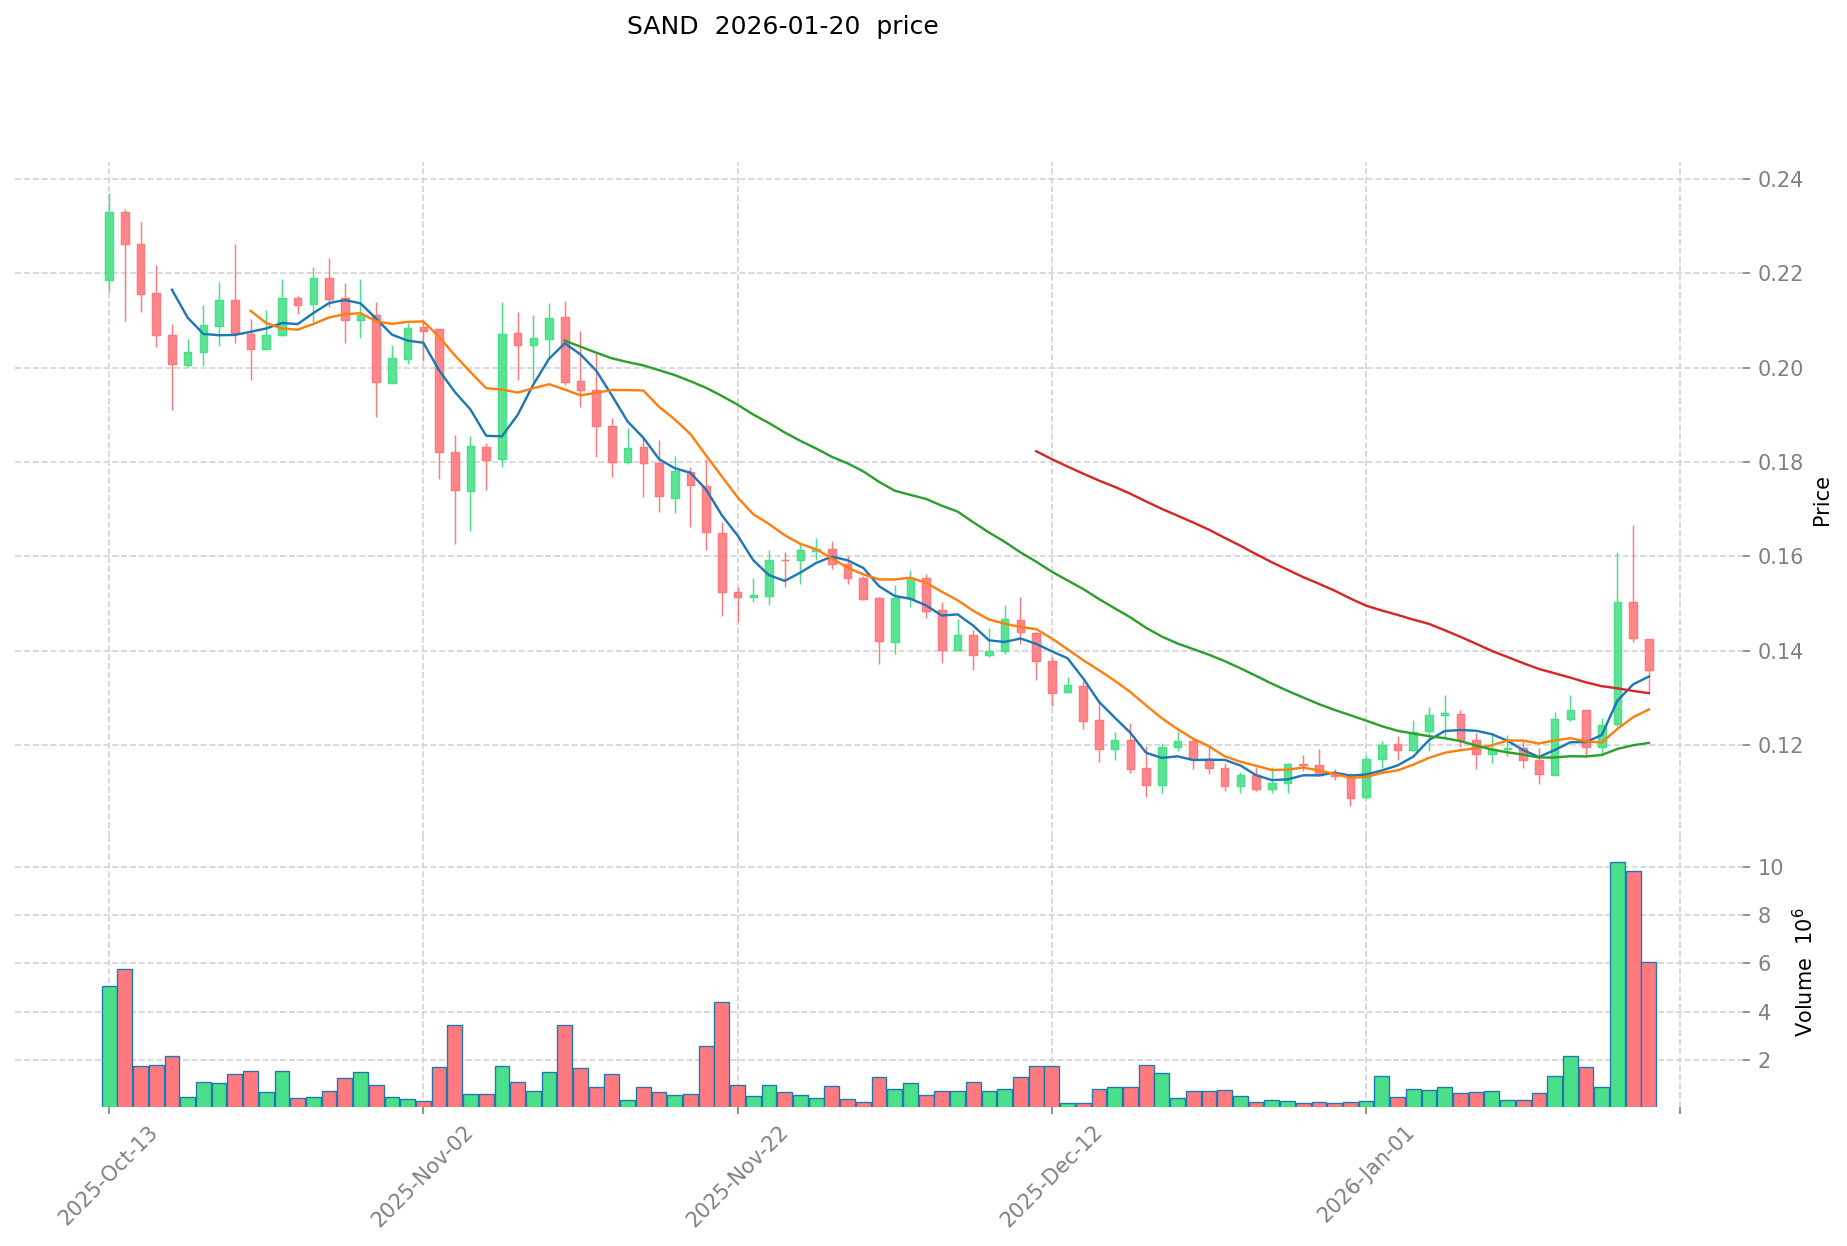
Current Market Status (January 21, 2026)
- SATS current price: $0.00000001583
- SAND current price: $0.1382
- 24-hour trading volume: SATS $211,924.66 vs SAND $2,067,472.29
- Market sentiment index (Fear & Greed Index): 32 (Fear)
View real-time prices:

II. Core Factors Affecting SATS vs SAND Investment Value
Given the absence of specific data in the provided materials regarding SATS and SAND's supply mechanisms, institutional adoption, technical developments, and macroeconomic performance, a comprehensive comparative analysis cannot be conducted at this time. Key aspects that would typically inform investment decisions—including tokenomics structures, institutional holding patterns, enterprise adoption rates, regulatory landscapes, technical upgrade roadmaps, ecosystem development metrics, and historical performance under various macroeconomic conditions—require substantial data points that are not currently available in the reference materials.
Investors seeking to evaluate these assets should independently verify current supply metrics, monitor institutional activity through on-chain analytics, track technical development progress through official project channels, and assess broader market conditions through established financial data sources.
III. 2026-2031 Price Prediction: SATS vs SAND
Short-term Prediction (2026)
- SATS: Conservative 0.0000000128142 - 0.00000001582 | Optimistic 0.00000001582 - 0.0000000162946
- SAND: Conservative 0.112996 - 0.1378 | Optimistic 0.1378 - 0.143312
Mid-term Prediction (2028-2029)
- SATS may enter a gradual growth phase, with estimated price range of 0.000000013851026 - 0.000000023656096
- SAND may enter an expansion phase, with estimated price range of 0.1432546752 - 0.290067103872
- Key drivers: institutional capital inflows, ETF developments, ecosystem growth
Long-term Prediction (2030-2031)
- SATS: Baseline scenario 0.000000012674054 - 0.000000021851817 | Optimistic scenario 0.000000021851817 - 0.000000033024651
- SAND: Baseline scenario 0.198652064104166 - 0.243029195136 | Optimistic scenario 0.243029195136 - 0.40619899675031
View detailed price predictions for SATS and SAND
Disclaimer
SATS:
| Year |
Predicted High Price |
Predicted Average Price |
Predicted Low Price |
Price Change |
| 2026 |
0.0000000162946 |
0.00000001582 |
0.0000000128142 |
0 |
| 2027 |
0.000000020392771 |
0.0000000160573 |
0.000000015415008 |
1 |
| 2028 |
0.000000021870042 |
0.000000018225035 |
0.000000013851026 |
15 |
| 2029 |
0.000000023656096 |
0.000000020047539 |
0.000000014634703 |
26 |
| 2030 |
0.000000030155508 |
0.000000021851817 |
0.000000012674054 |
38 |
| 2031 |
0.000000033024651 |
0.000000026003662 |
0.00000001768249 |
64 |
SAND:
| Year |
Predicted High Price |
Predicted Average Price |
Predicted Low Price |
Price Change |
| 2026 |
0.143312 |
0.1378 |
0.112996 |
0 |
| 2027 |
0.17428944 |
0.140556 |
0.10120032 |
1 |
| 2028 |
0.2345598528 |
0.15742272 |
0.1432546752 |
13 |
| 2029 |
0.290067103872 |
0.1959912864 |
0.135233987616 |
41 |
| 2030 |
0.34996204099584 |
0.243029195136 |
0.23330802733056 |
75 |
| 2031 |
0.40619899675031 |
0.29649561806592 |
0.198652064104166 |
114 |
IV. Investment Strategy Comparison: SATS vs SAND
Long-term vs Short-term Investment Strategies
-
SATS: May appeal to investors interested in Bitcoin ecosystem expansion and ordinals-based token innovations. The token's position within the BRC-20 framework suggests potential alignment with investors monitoring inscription-based asset developments.
-
SAND: May suit investors focused on virtual gaming metaverse utility and Ethereum-based digital asset creation. The token's established presence since 2020 and gaming ecosystem integration may attract those interested in NFT-enabled gaming platforms.
Risk Management and Asset Allocation
-
Conservative Investors: Portfolio construction might consider SATS allocation of 20-30% alongside SAND allocation of 70-80%, reflecting SAND's more established market position and higher liquidity profile.
-
Aggressive Investors: Risk-tolerant portfolios might allocate SATS 40-50% versus SAND 50-60%, incorporating exposure to emerging Bitcoin ecosystem developments while maintaining metaverse gaming sector participation.
-
Hedging Tools: Diversification approaches may include stablecoin reserves for volatility management, options strategies for directional exposure, and cross-asset positioning across different blockchain ecosystems.
V. Potential Risk Comparison
Market Risk
-
SATS: Trading volume of $211,924.66 suggests lower liquidity conditions compared to more established assets. Market cap ranking at #669 indicates exposure to volatility patterns common in smaller-cap digital assets. Price movements have shown variation across different market cycles.
-
SAND: With 24-hour trading volume of $2,067,472.29 and market cap ranking at #153, the token demonstrates higher liquidity levels. Historical price ranges from $0.02897764 to $8.4 reflect sensitivity to broader metaverse and gaming sector sentiment shifts.
Technical Risk
-
SATS: As a BRC-20 token launched in June 2023, considerations include the evolving nature of Bitcoin-based token standards and inscription protocols. Network dependency on Bitcoin infrastructure presents specific technical considerations.
-
SAND: Ethereum-based architecture involves considerations related to network scalability and transaction costs. Gaming platform functionality depends on smart contract performance and ecosystem technical maintenance.
Regulatory Risk
- Both assets operate within evolving regulatory frameworks that vary across jurisdictions. Digital asset classification, securities considerations, and gaming-related token regulations may affect operational parameters differently based on each token's specific use case and jurisdictional presence.
VI. Conclusion: Which Is the Better Buy?
📌 Investment Value Summary:
-
SATS Characteristics: Represents exposure to Bitcoin ecosystem expansion through BRC-20 infrastructure. Market cap of approximately $33.24 million positions it within emerging digital asset segments. Current price of $0.00000001583 reflects early-stage market positioning.
-
SAND Characteristics: Established presence in virtual gaming metaverse with market cap of approximately $368.62 million. Ethereum-based utility enables content creation and monetization functionalities. Current price of $0.1382 with higher trading volumes suggests greater market liquidity.
✅ Investment Considerations:
-
Entry-level Participants: May consider starting with assets demonstrating higher liquidity and established market presence. Thorough research into tokenomics, ecosystem development, and risk factors remains essential before any allocation decisions.
-
Experienced Market Participants: Portfolio construction might incorporate diversification across different blockchain ecosystems and use cases. Technical analysis, on-chain metrics, and ecosystem development tracking can inform positioning strategies.
-
Institutional Participants: Due diligence processes should examine regulatory compliance frameworks, custody solutions, liquidity depth, and alignment with investment mandates. Systematic risk assessment across market, technical, and operational dimensions remains fundamental.
⚠️ Risk Disclosure: Cryptocurrency markets exhibit high volatility characteristics. This analysis does not constitute investment advice. Market participants should conduct independent research and consult qualified financial professionals before making investment decisions. Past performance does not indicate future results. Digital asset investments carry risk of partial or total capital loss.
VII. FAQ
Q1: What is the primary difference between SATS and SAND in terms of blockchain infrastructure?
SATS operates on Bitcoin's BRC-20 token standard as part of the ordinals and inscription-based token movement, while SAND functions as an Ethereum-based ERC-20 utility token within the gaming metaverse ecosystem. This fundamental distinction means SATS benefits from Bitcoin's network security and the emerging inscription protocol innovations launched in June 2023, whereas SAND leverages Ethereum's smart contract capabilities for NFT creation and gaming functionalities since August 2020. The infrastructure difference affects transaction costs, network scalability, and ecosystem integration patterns for each token.
Q2: How do the current market capitalizations of SATS and SAND reflect their investment risk profiles?
SATS ranks #669 with approximately $33.24 million market cap, while SAND ranks #153 with approximately $368.62 million market cap, indicating SAND maintains an 11x larger market presence. This disparity translates to higher liquidity risk for SATS with 24-hour trading volume of $211,924.66 compared to SAND's $2,067,472.29—nearly 10x greater trading activity. Smaller market cap assets like SATS typically experience higher volatility and price sensitivity to market movements, whereas SAND's more established position suggests relatively greater price stability, though both remain subject to broader cryptocurrency market dynamics.
Q3: Which token demonstrates stronger historical price performance across different market cycles?
SAND has exhibited a wider historical price range from $0.02897764 (November 2020) to $8.4 (November 2021), representing approximately 290x variation, while SATS has shown movements between $0.00000000638 (October 2025) and $0.000000941 (December 2023), approximately 147x variation. However, direct performance comparison proves challenging due to different launch timelines and market cycle exposures. SAND captured the 2021 metaverse narrative surge, whereas SATS emerged during the 2023 Bitcoin ordinals innovation wave. Current pricing as of January 21, 2026 shows SATS at $0.00000001583 and SAND at $0.1382, both experiencing significant corrections from their respective historical peaks.
Q4: What are the recommended portfolio allocation percentages for SATS versus SAND based on risk tolerance?
Conservative investors might consider SATS allocation of 20-30% alongside SAND allocation of 70-80%, prioritizing SAND's established market position, higher liquidity profile, and longer operational track record since 2020. Aggressive investors with higher risk tolerance might allocate SATS 40-50% versus SAND 50-60%, incorporating greater exposure to emerging Bitcoin ecosystem developments while maintaining metaverse gaming sector participation. These allocations reflect SAND's comparative stability advantages while acknowledging SATS's potential upside within Bitcoin-based innovation trends. All allocations should incorporate stablecoin reserves for volatility management and consider individual risk capacity.
Q5: How do the 2030-2031 price predictions compare between SATS and SAND?
Long-term predictions for 2030-2031 suggest SATS baseline scenario ranges from $0.000000012674054 to $0.000000021851817 with optimistic potential reaching $0.000000033024651, representing approximately 64% price increase from current levels by 2031. SAND's baseline scenario projects $0.198652064104166 to $0.243029195136 with optimistic scenarios extending to $0.40619899675031, indicating approximately 114% potential increase by 2031. In percentage terms, SAND demonstrates higher projected growth trajectory, though absolute returns depend on initial investment size. These predictions assume continued ecosystem development, institutional adoption patterns, and favorable macroeconomic conditions—all subject to significant uncertainty.
Q6: What specific technical risks differentiate SATS from SAND?
SATS faces technical risks inherent to the evolving BRC-20 token standard and Bitcoin inscription protocols, including potential protocol changes, ordinal numbering system dependencies, and Bitcoin network constraint considerations that could affect token functionality. As a newer implementation launched in June 2023, long-term protocol stability remains under market observation. SAND's Ethereum-based architecture encounters different technical considerations including network scalability limitations, gas fee fluctuations affecting user experience, smart contract vulnerabilities within gaming platform infrastructure, and dependency on Ethereum's ongoing technical upgrades. Both tokens' technical risks require ongoing monitoring of their respective blockchain development roadmaps.
Q7: Under current market conditions with Fear & Greed Index at 32 (Fear), which token presents better entry opportunities?
Market sentiment at 32 (Fear) typically suggests potential accumulation opportunities for risk-tolerant investors, though timing remains uncertain. SAND's higher liquidity ($2,067,472.29 daily volume) enables easier position entry and exit during fearful market conditions, reducing execution risk compared to SATS's lower liquidity ($211,924.66 daily volume). However, SATS's smaller market cap may offer greater percentage upside potential if Bitcoin ecosystem adoption accelerates. Conservative approaches favor SAND during fear periods due to established infrastructure and demonstrated market resilience since 2020. Aggressive strategies might incrementally accumulate both assets using dollar-cost averaging to manage volatility risk inherent in fear-driven market environments.
Q8: What regulatory considerations should investors evaluate when choosing between SATS and SAND?
Both assets operate within evolving regulatory frameworks that vary significantly across jurisdictions. SAND's gaming utility and NFT integration may face scrutiny under gaming regulations, virtual asset laws, and securities considerations depending on jurisdictional interpretation of gaming tokens and digital collectibles. SATS as a Bitcoin-based BRC-20 token encounters Bitcoin classification precedents while navigating emerging regulatory approaches to inscription-based tokens and ordinals—areas with limited regulatory clarity as of January 2026. Investors should assess their jurisdiction's stance on cryptocurrency taxation, securities classification for utility tokens, gaming-related digital asset regulations, and cross-border transaction requirements before allocating capital to either asset.
* The information is not intended to be and does not constitute financial advice or any other recommendation of any sort offered or endorsed by Gate.